| New Year's Day Weather for Northern Illinois: Statistics for Chicago and Rockford
Chicago: The following statistics comprises 146 years of data. However snowfall data started in 1885 so it comprises 133 years. Data collection began at the University of Chicago, then at Midway, and currently at O'Hare which is now the official station for Chicago.
 |
||||||||
|
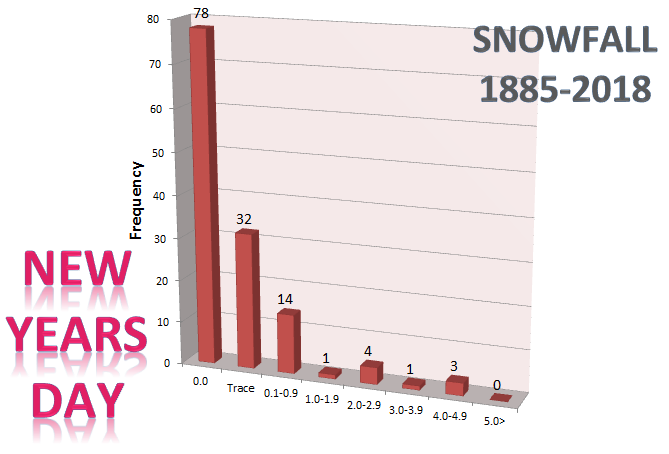
Frequency distribution of snowfall for Chicago. This dataset shows that the most frequent amount of snowfall recorded on New Year’s Day is 0.0”, which accounts for 59% of the days in the dataset. The next most frequent range is a Trace. The highest amount of snowfall recorded on New Year’s Day occurred in 1918 when 5.0” of snow fell. In 2018, no snow fell. |
||||||||
|
MAX TEMP |
MIN TEMP WARMEST |
PCPN WETTEST |
SNOW MOST |
| 65 1876 |
43 1950 * |
1.33 1948 |
5.0 1918 |
| 57 1897 |
41 1892 |
1.25 1891 |
4.6 1978 |
| 55 1892 |
40 1876 |
0.94 1965 |
4.4 1948 |
| 54 1891 * |
37 1916 |
0.70 1941 |
4.3 1985 |
| 52 1916 |
36 1941 * |
0.68 1916 |
3.1 1984 |
| 49 2004 * |
35 2000 * |
0.61 1985 |
|
| 48 2000 * |
34 1972 * |
0.57 1892 |
|
| 46 1941 * |
33 1997 * |
0.48 1890 |
|
| 45 2006 |
32 1996 * |
0.47 1918 |
|
| 44 2012 * |
31 1992 * |
0.44 1876 |
|
| MAX TEMP COLDEST |
MIN TEMP COLDEST |
PCPN DRIEST |
SNOW LEAST |
| 1 2018 |
-10 1969 |
0.00 2018 * |
0.0 2018 * |
| 5 1969 |
-9 2018 * |
T 2016 * |
T 2016 * |
| 7 1928 |
-6 1887 |
0.01 1997 * |
0.1 1967 * |
| 8 1988 * |
-5 1924 * |
0.02 1995 * |
0.2 1995 |
| 12 1924 |
-3 1945 * |
0.03 2006 * |
0.3 1959 |
| 13 1977 |
-2 1974 |
0.04 2012 * |
|
| 14 1920 |
-1 1988 |
0.05 2008 * |
|
| 15 1968 * |
0 1978 * |
0.06 1911 |
|
| 16 2010 * |
1 1920 |
0.08 1979 * |
|
| 17 1957 * |
2 1935 * |
0.09 1921 |
|
ACS on 12/22/2018


 Follow us on YouTube