Sorry, but the page you selected is still under construction.
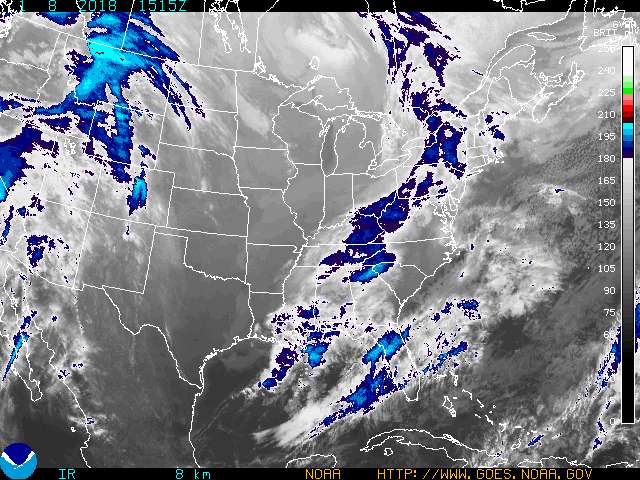
Click image to open ZAU Weather Briefing
A color coded graphic which displays ceiling, visibility, precipitation, and wind data beginning with the latest observation and continuing out 12 hours using data from the latest TAF. Runway cross wind, head wind, and tail wind values based on the latest observation and the latest TAF (looking out 12 hours) are also displayed. The color coding can be customized to address your specific thresholds.


 Follow us on YouTube