|
March Comes in Like a Lion! Feb 28 - Mar 1, 2010 |
|
 |
|
|
Radar animation from 5:08 am to 6:18 am on March 1, 2010. Much of the precipitation at this time was rain, though snow was beginning to mix in across the Texas Panhandle and South Plains. |
|
|
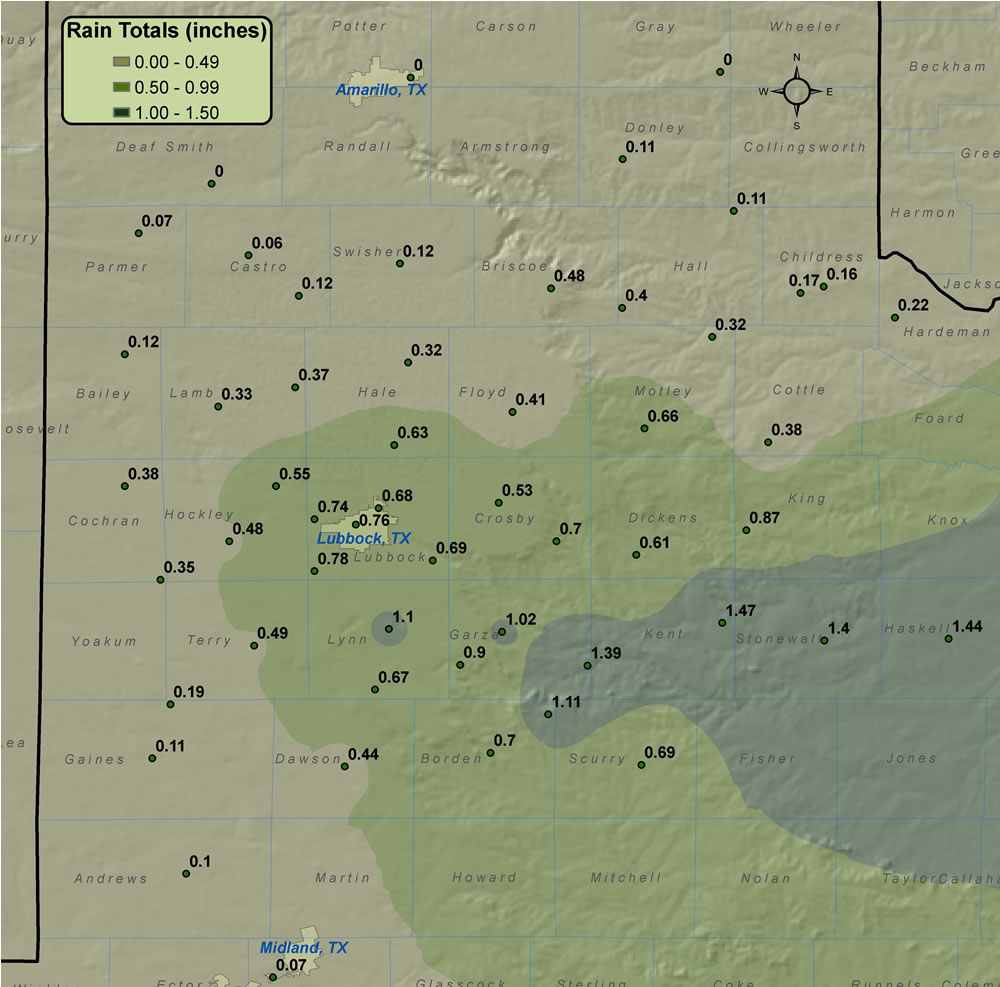
Even though a little snow did fall, the main story was another round of widespread beneficial rain. This storm system was initially moisture starved, but with time if began to draw in better amounts of Gulf of Mexico moisture. This allowed the rain shield to blossom across the region late Sunday night (Feb 28). The precipitation then took its sweet time exiting the region to the east during the day Monday (Mar 1). Everyone from the extreme southern Texas Panhandle through the South Plains and Rolling Plains received precipitation, with areas of the central South Plains into the Rolling Plains seeing anywhere from a half inch to an inch and a half. The below map illustrates the spatial distribution of the preciptation. |
|
|
|
|
|
Graphic displaying 2-day rainfall totals, in inches, from February 28 - March 1, 2010. Rain totals are courtesy of the West Texas Mesonet and the National Weather Service. Click on the image for a larger view. |
|
|
|
|


 Follow us on YouTube