 |
|
Storms hit heavy and often across the South Plains during the month of May 2015. The map below highlights the extraordinary rainfall totals that were recorded. Even in the western South Plains, where rainfall was less than five inches in some areas, the totals represented over double the normal May rainfall! The heaviest rainfall of 10 to 15 inches fell in a swath from the central South Plains into southwest Oklahoma. Although the rainfall almost wiped out a multi-year drought across the area, it also caused quite a bit of flooding and delayed spring planting. At Lubbock, at least a trace of rain was reported on 21 of May's 31 days.
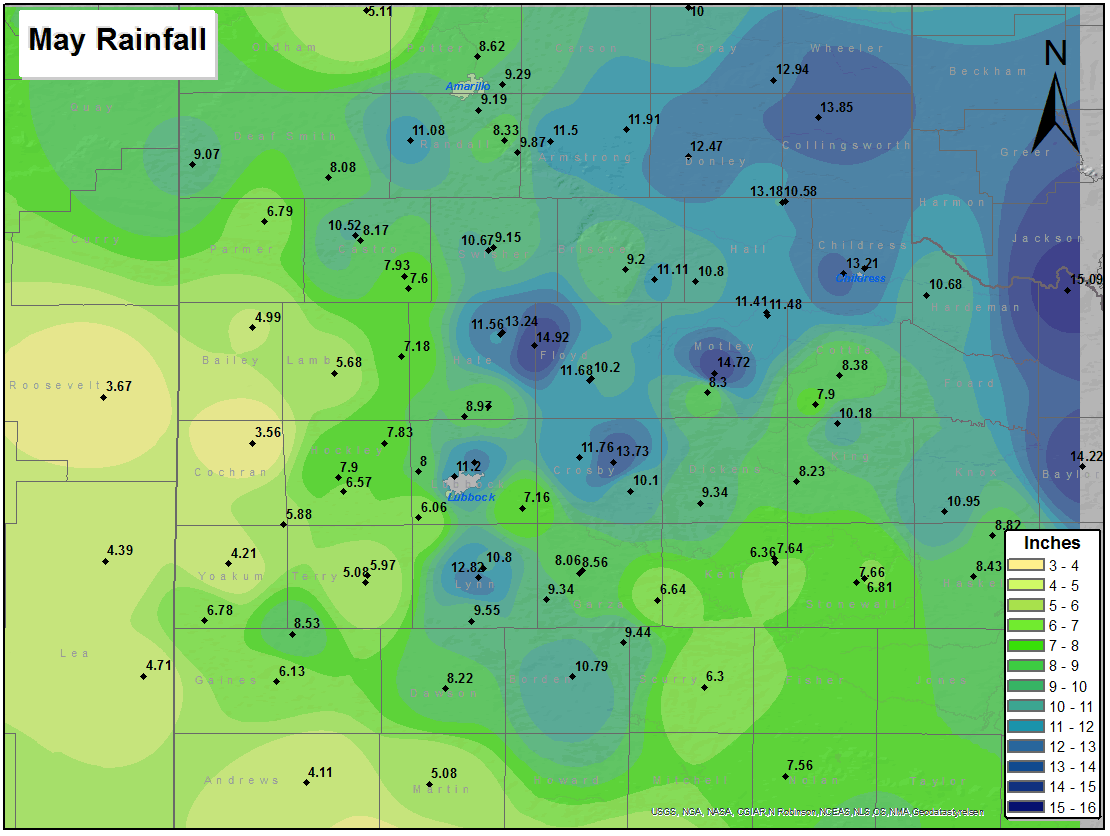
Map displaying May 2015 total rainfall from National Weather Service and West Texas Mesonet stations. Click on the image to view a larger map.
|
|
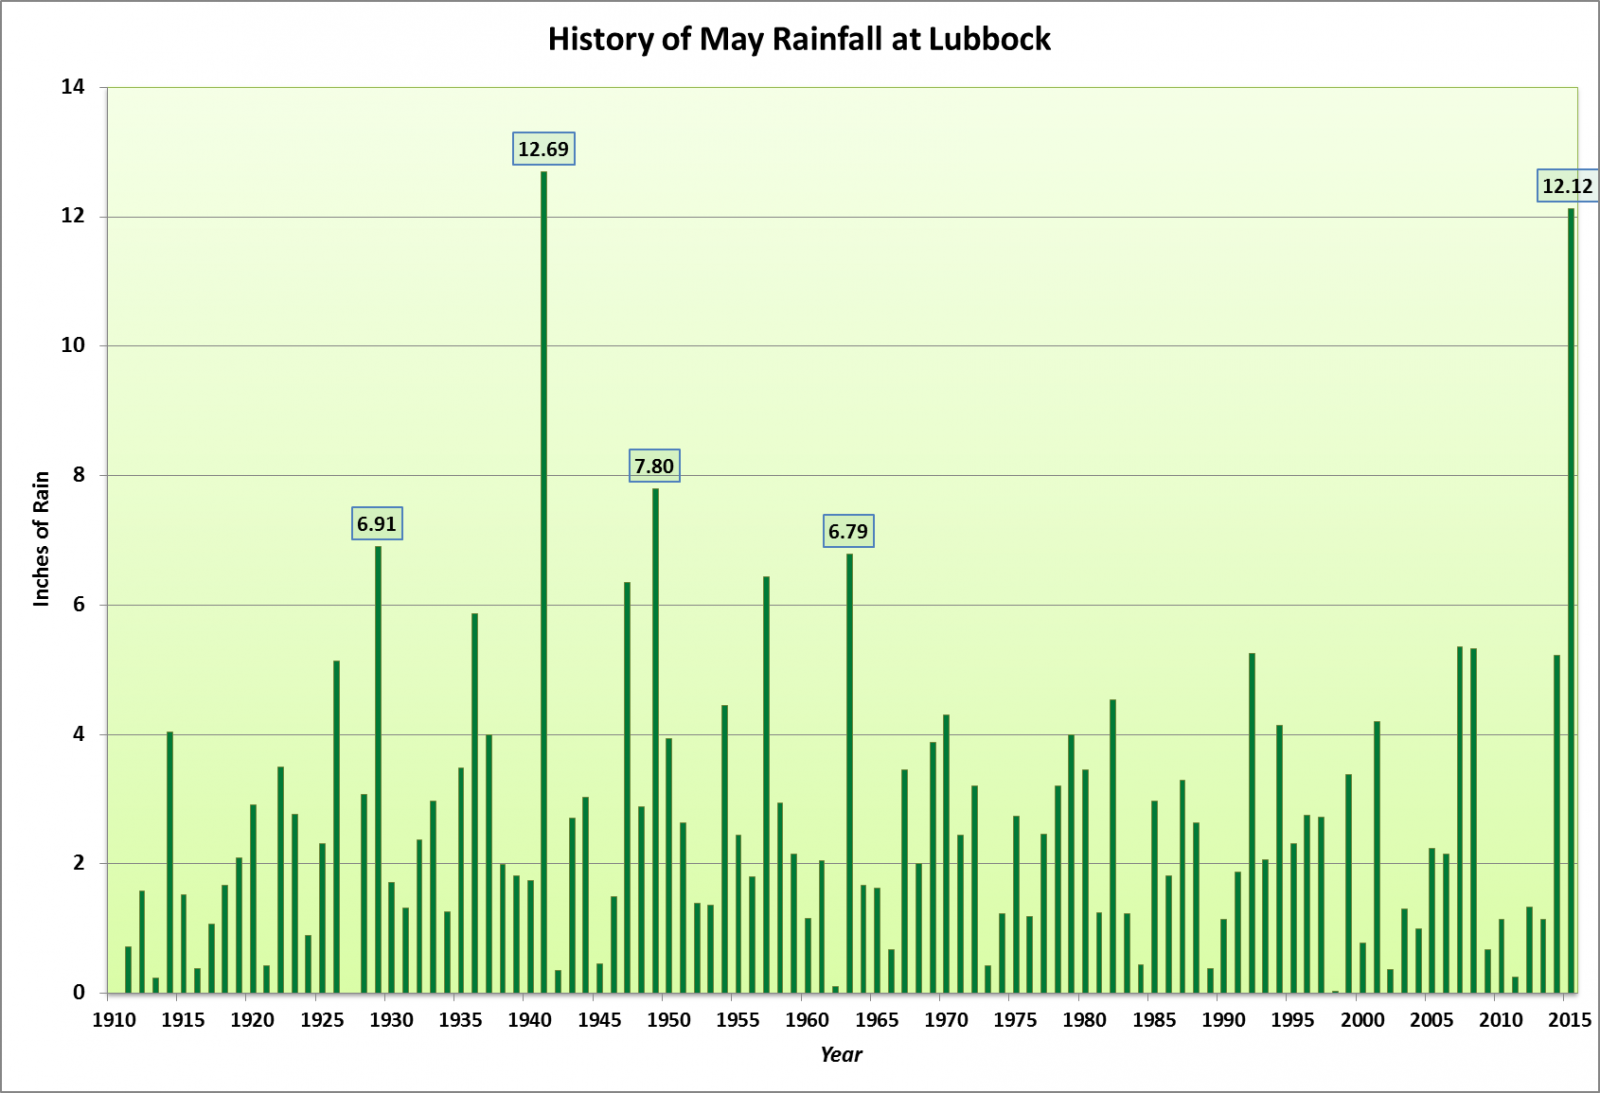
As the below graph shows, the 12.12 inches of rain that fell in Lubbock ranks as the second wettest May on record, only falling short of the 12.69 inches that was recorded way back in 1941. Impressively, May 2015 exceeded the previous second wettest May by a whopping 4.32 inches (7.80 inches in 1949). It was also the first time Lubbock received over 6 inches of rain in May since the 1960s (6.79 inches in 1963). The average rainfall for May in Lubbock is 2.30 inches, nearly 10 inches below what fell in 2015. |
 |
|
This chart shows the history of May rainfall at Lubbock. For most of the record the rain has been measured at the Lubbock airport. Click on the map to view a full-sized version.
|
|
May 2015 was not only the second wettest May on record; it was also the third wettest month ever on record at Lubbock. In addition to May 1941, September of 1936 recorded nearly 14 inches of rain. May also became only the fourth month to record 10 or more inches of rain in over 1,250 months of records going back to 1911. |
 |
|
This chart shows the top 10 wettest months on record in Lubbock. Click on the map to view a full-sized version.
|
|
The above bar graph also shows that the majority (7 out of 10) of the top ten wettest months for Lubbock occurred in the late summer and early fall months of August, September and October, though May and June also contain three of the top ten, including two of the top three. |
 |
|
This chart shows the history of May rainfall at Childress. Click on the map to view a full-sized version.
|
|
Even more impressively, Childress not only exceeded its wettest May on record, it also set a new all-time wettest month on record in 2015 by tallying 13.21 inches. This beat the previous record by a full 1.16 inches (12.05 inches in June of 1941). May 2015 brought only the second time ever that Childress recorded double digit rainfall in May (only other is 10.28 inches in 1935). The heavy rain, wet ground and cloud cover also helped keep temperatures relatively cool, with neither Lubbock nor Childress recording a single 90 degree day through the entire month of May. |
 |
|
This chart shows the top 10 wettest months on record in Childress. Click on the map to view a full-sized version.
|
|
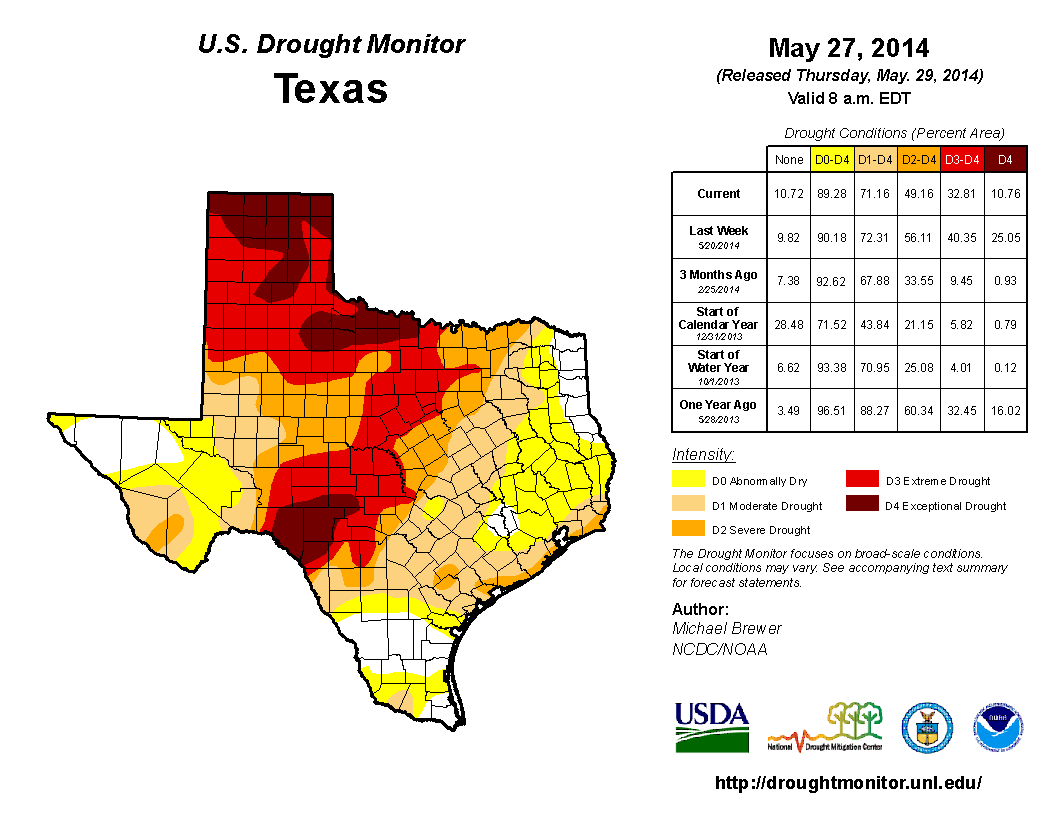
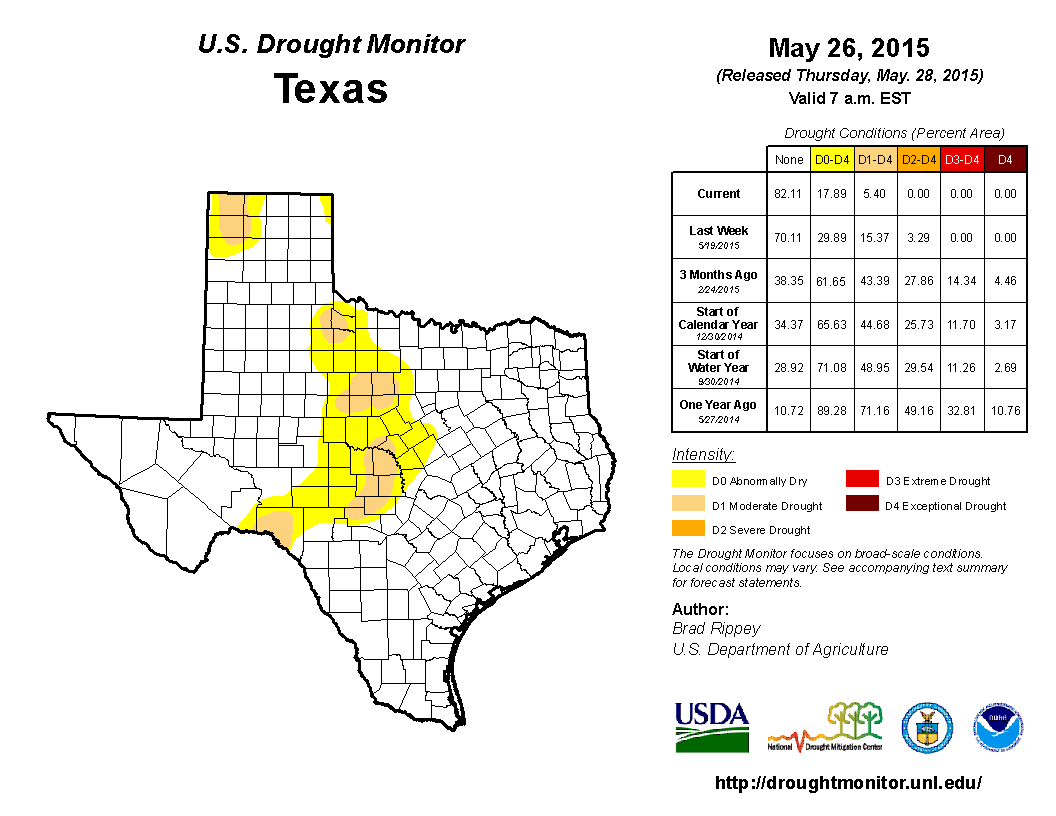
The above bar graph also shows that in contrast to Lubbock, the top 10 wettest months at Childress are roughly evenly divided between Spring and Autumn. Interestingly, 7 of the top ten events came during the first half of of the historical record (before 1950). The wet May brought a welcome change to the water budget of West Texas, which had been dominated by drought and low water levels the past few years. The charts below show the progression of drought conditions across the state of Texas for roughly the past year. In May of 2014, much of the South Plains of West Texas was in an extreme drought. Precipitation last summer to this spring significantly eroded the drought conditions, then the heavy rains in May for the most part eliminated the remaining drought. |
 |
 |
 |
|
The Texas Drought Monitor valid: May 27, 2014 (left); April 28, 2015 (center); and May 26, 2015 (right). Click on the images to view a full-sized version.
|
||
|
Runoff from the heavy rainfall resulted in significant increases in water levels at reservoirs across the region. The graphs below show the water level data at Mackenzie Reservoir, White River lake and Lake Alan Henry. Lake Alan Henry is now at 100 percent capacity for the first time in five years. |
||
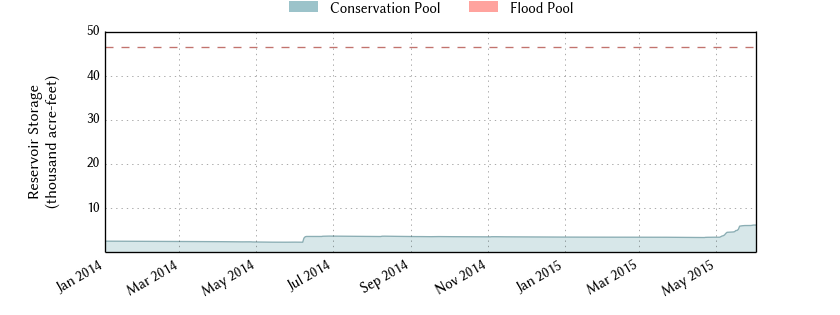 |
| Graph of the water levels at Mackenzie Reservoir. This graph is courtesy of the Texas Water Development Board (https://www.waterdatafortexas.org/) |
|
|
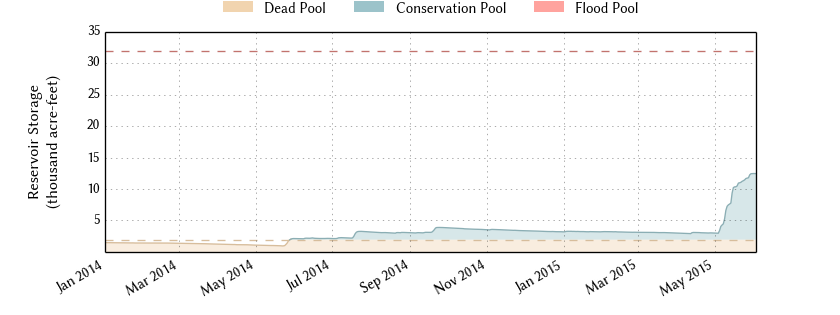 |
| Graph of the water levels at White River Lake. This graph is courtesy of the Texas Water Development Board (https://www.waterdatafortexas.org/) |
|
|
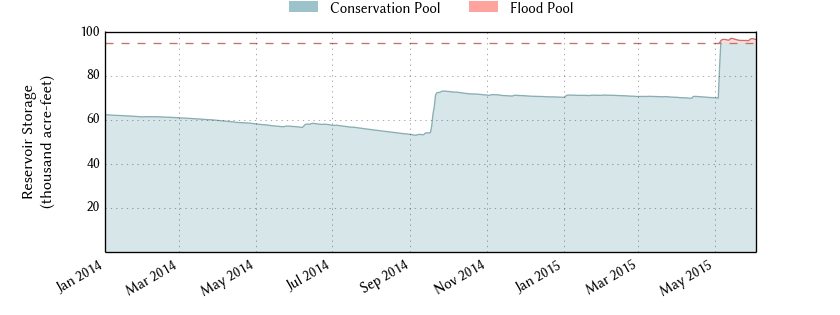 |
| Graph of the water levels at Lake Alan Henry. This graph is courtesy of the Texas Water Development Board (https://www.waterdatafortexas.org/) |
|
|


 Follow us on YouTube