The main weather story of 2015 was the above average precipitation which fell across the South Plains area for the second year in a row, punctuated by an extremely wet May. The rounds of heavy rain helped lift West Texas, and more generally the state of Texas, out of the prolonged drought that had reigned supreme through the early 2010s. 29.56 inches of precipitation fell at Lubbock during 2015, which was the sixth highest amount in the historical record.
The year started out cold and wintry, and we experienced several winter weather episodes through early March. April brought several days of severe weather and some heavy rain. This trend continued through May, in fact, at least a trace of rain was reported at Lubbock on 21 of May's 31 days! Summer and early autumn were fairly quiet, although heavy rain brought some flooding to the area on July 6th and 7th. By October, the big news nationally was the intensification of the El Nino climate pattern in the central and eastern Pacific, and its impact on the nation's weather. A strong El Nino brings better odds of wetter conditions through the winter months to Texas, and this El Nino did not disappoint! We were hit by heavy rain in October and one of the worst snowstorms on record in the final week of 2015. Below you will find more detailed information about the weather of 2015 and we hope you find the report interesting and useful.
2015 Maps of Significant Weather Events
The map below highlights some of the more significant weather events that occurred across the area in 2015. It was a busy year weather-wise, highlighted by several episodes of heavy rain and punctuated by a major blizzard to close out the year.
Map displaying many of the more notable weather impacts to the region in 2015. Note that this is just a sampling of events, many more have been omitted due to space contraints. Click on the image to view a larger map.
For the sixth consecutive year, the Lubbock County Warning Area (CWA) enjoyed a below average number of tornadoes. Only five tornadoes were observed in 2015, well below the 30-year average of 18 for our 24-county area. Of the five tornadoes, all remained over open land and were rated EF-0 because they caused little to no damage. All of the observed tornadoes for the Lubbock CWA occurred in the spring (April and May), though an outbreak of tornadoes did also occur on November 16th just to our north, from the central Texas Panhandle into western Kansas.
Graphic showing the tornadoes that impacted the Lubbock CWA in 2015.
Precipitation Summary
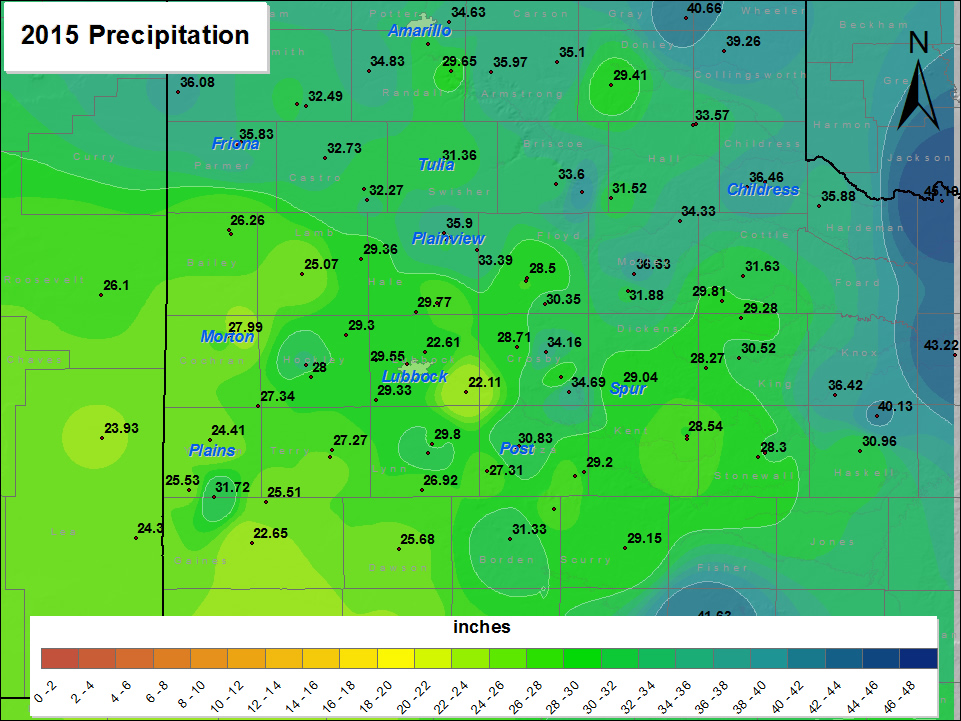
This map displays the 2015 year precipitation totals. The map was created with data gathered from the NWS Cooperative observers and the West Texas Mesonet. Click on the map to view a full-sized version.
Precipitation was abundant and relatively uniform across the South Plains in 2015, with most areas receiving between 25 and 35 inches. The precipitation showed a broad increasing trend from southwest to northeast, although as usual there were pockets of higher and lower amounts. The West Texas Mesonet site near Quitaque recorded 38.83 inches of precipitation, the most for the Lubbock NWS area of responsibility, while the West Texas Mesonet station near Morton was the driest with 21.02 inches.
The map below shows the 2015 precipitation as a percent of the long-term average, or "normal". This image shows even the driest areas across the western South Plains and portions of the Rolling Plains received near average yearly precipitation. Slaton stands out as about the only area that received below average precipitation - about 90 percent of normal.
This map shows the 2015 rainfall as a percent of the 30-year normal rainfall (1971-2000). Also plotted is the rainfall observed, in inches, at each collection site. Please click on the map to view a full-sized version. If you would like to see the precipitation as a departure from normal please CLICK HERE.
Drought Update and Reservoir Levels
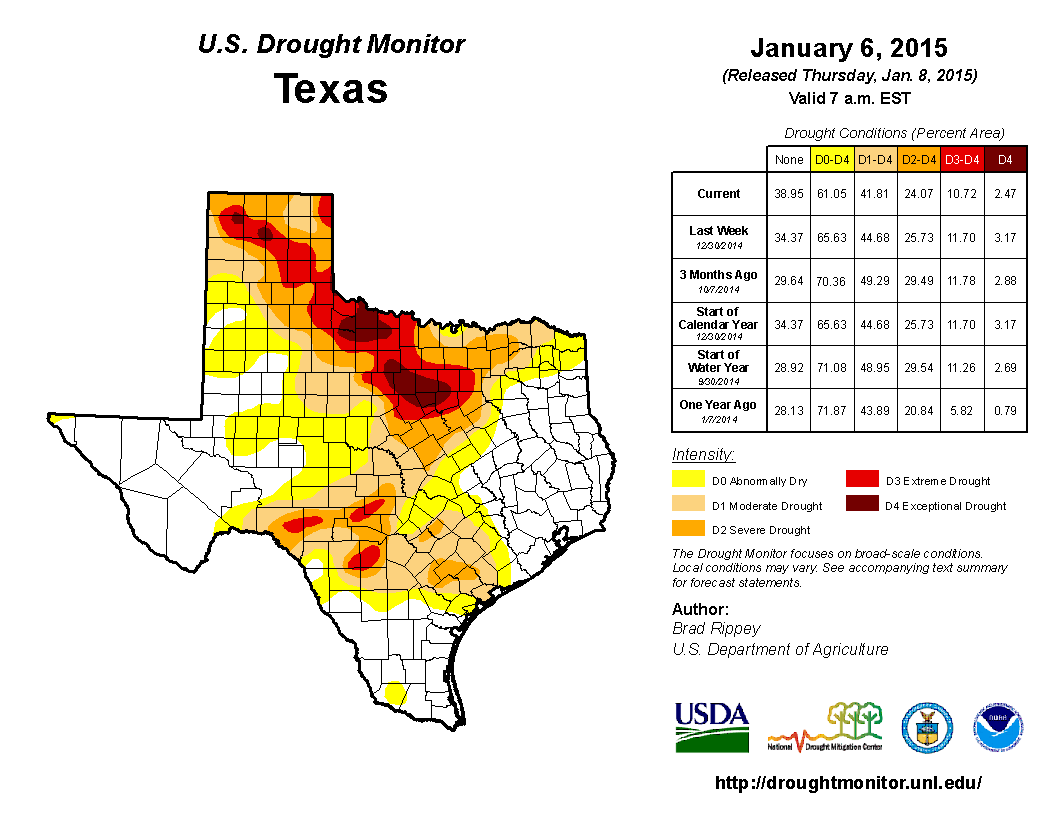
The year started with drought lingering from the Texas Panhandle through the Rolling Plains and into North and Central Texas. The first few months of the year brought occasional precipitation to the region and state, though not enough to change drought conditions significantly. However, with the flipping of the calendar to May the weather took a dramatic turn. Widespread heavy and flooding rain impacted most of Texas, including here in West Texas. Most of the South Plains region recorded 8 inches or more through the course of the month, much of which fell in only a few days. Many locations along the I-27/US-87 corridor northeastward into the eastern Texas Panhandle recorded monthly totals near a foot or greater. All of this rain quickly squashed the lingering drought, with almost no drought left by June. In fact, the amount of Texas officially experiencing drought conditions fell from 30% at the beginning of May to less than 1% to start June. Lubbock officially recorded 12.12 inches of rain in May, making it the second wettest May on record (to 12.69 inches in 1941), and third wettest month on record (September of 1936 recorded 13.93 inches). To read more about the wet May CLICK HERE. Drought conditions did gradually creep back into the Rolling Plains during the fall before widespread moderate rain in late October knocked the building drought back, and occasional precipitation through the remainder of the year kept the drought (or lack thereof) in check.
This map shows the drought conditions on January 6, 2015. Click on the map to view a full-sized version.
This map shows the drought conditions on December 29th, 2015. Click on the map to view a full-sized version.
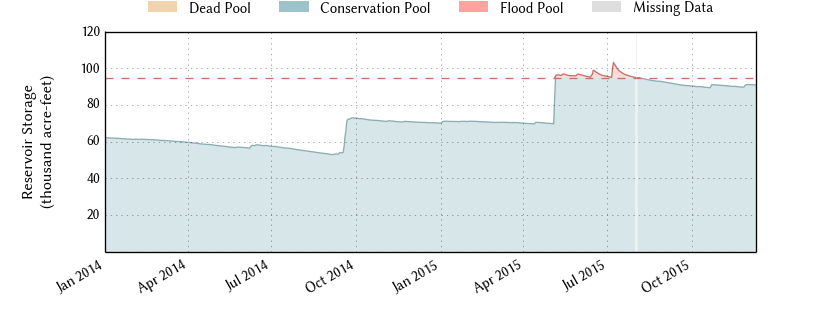
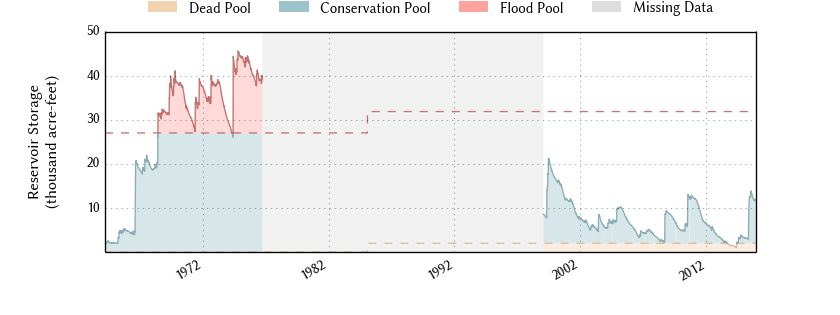
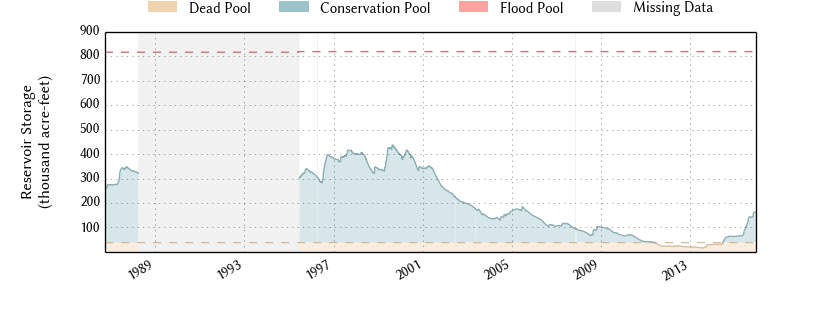
Along with the drastic improvement in drought conditions in 2015, all of the rain and the resulting runoff did help to fill area lakes and reservoirs. The most significant increases in lake and reservoir levels occurred in spring, and more specifically in May, when the near-record to record amounts of rain contributed to sizable flows in area rivers and streams. The captured runoff filled Lake Alan Henry to 100% of capacity for the first time since 2010. Additionally, White River Lake and Lake Meredith returned after being effectively empty early in the year. Lake Mackenzie also rebounded to pre-drought levels.
Recent plot of the water level for Lake Alan Henry. Click on the image for a full-sized version. A longer record of data for Lake Alan Henry can also be VIEWED HERE. The graphs are courtesy of: www.waterdatafortexas.org
Recent plot of the water level for White River Lake. Click on the image for a full-sized version. A longer record of data for White River Lake can also be VIEWED HERE. The graphs are courtesy of: www.waterdatafortexas.org
Recent plot of the water level for Mackenzie Reservoir. Click on the image for a full-sized version. A longer record of data for Mackenzie Reservoir can also be VIEWED HERE. The graphs are courtesy of: www.waterdatafortexas.org
Recent plot of the water level for Lake Meredith. Click on the image for a full-sized version. A longer record of data for Lake Meredith can also be VIEWED HERE. The graphs are courtesy of: www.waterdatafortexas.org
Lubbock Statistics
2015 will go down in the books as the 18th warmest and 6th wettest year since records began in 1911. The year was punctuated by its above normal precipitation, both locally and statewide, which tamed the lingering drought that was in place to start the year. The year began with periodic precipitation events, including 11.8 inches of snow tallied between January and March, well above the three-month average of 4.8 inches for this same stretch. However, the widespread heavy rainfall didn't hit the region and state until May, when several strong and moisture-rich storm systems moved through and produced intense rainfall. The initial batch of heavy rain impacted West Texas from May 3rd through the 9th, when Lubbock recorded 4.86 inches (3.42 inches of which fell on the 4th). The rain just kept on coming in May with Lubbock seeing at least a trace of rain on 21 of the 31 days, and the monthly rainfall tallied to an incredible 12.12 inches. This made May the second wettest May on record and the third wettest month on record. Although less generous than May, periodic rain did continue to visit Lubbock (and the South Plains region) through the remainder of the year, with the final total for the year summing to 29.45 inches. Combined with the 22.56 inches of rain that fell in Lubbock in 2014, the two-year stretch of above average precipitation far outpaced the preceding 3 years. In addition, 2014-2015 was the first consecutive two year stretch of above normal moisture since 2007-2008, and 2015 was the wettest year since 2004 when 33.25 inches fell. Interestingly, 7 months finished with below average precipitation for the year, but May, and to a much lesser degree July and October, easily compensated for the drier months.
The year began on the cool side, with average monthly temperatures for January and February finishing around a degree shy of normal. March and April were then on the warm side of average, while all of the cloud cover and rain helped May finish nearly 4 degrees below average. June experienced near average temperatures before the thermostat was turned up, and the remaining months of the year finished above average. Relative to average, September was the warmest, finishing 4.6 degrees above the 30-year average. As is often the case for this area, the warmer stretches of weather were generally associated with relatively dry conditions. Collectively, the year finished with an average temperature of 61.4 degrees, which was the 18th warmest on record and about 0.7 degrees above the 1981-2010 average.
The hottest temperature in 2015 was 100 degrees, reached on four different occasions (August 6th, 13th, 14th and September 18th), which was well below the average of 10 per season. One the other side of the pendulum, the coldest temperature of the year was 13 degrees, experienced February 27th and again on the 28th. Four record highs were tied or set in 2015: 81 degrees on February 6th; 84 degrees on February 7th; 87 degrees on March 23rd; and 100 degrees on September 18th. One record low was set in 2015: 57 degrees on August 19th.
LUBBOCK
Average High
Average Low
Precip (inches)
January
50.7
27.5
1.61
February
59.4
27.9
0.66
March
68.0
36.9
0.30
April
76.3
47.9
1.24
May
77.8
54.2
12.12
June
88.5
66.0
2.15
July
92.3
70.0
3.96
August
93.6
67.0
0.25
September
89.4
63.3
0.49
October
76.2
52.1
4.29
November
64.1
36.7
0.81
December
57.3
29.5
1.57
Annual
74.5 (44th warmest)
48.4 (10th warmest)
29.45 (6th wettest)
Normal
74.3
47.0
19.12
Departure
+0.2
+1.4
+10.33
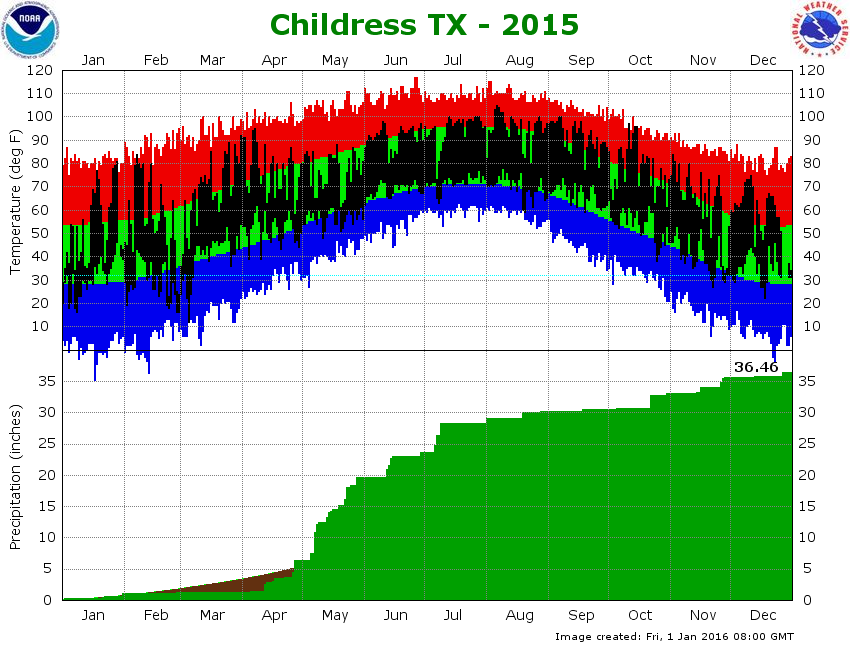
The top portion of the below graph shows the daily high and low temperature distribution for 2015 at Lubbock Preston Smith International Airport. A large portion of the year saw temperature near to above average, with a few pockets of below average temperatures. The hottest temperatures occurred during the second half of the summer, from mid-July through mid-September, while May was on the cool side thanks in part to all of the clouds and rain. The coldest stretch of 2015 occurred from late February into early March when several inches of snow fell and temperatures struggled to make it to the freezing mark. The year also closed out on the chilly side, coupled with a blizzard that impacted the area over the Christmas Holiday Weekend.
(Top) Plot of the maximum and minimum temperatures (connected by a black line) observed at the Lubbock Preston Smith International Airport in 2015. Also plotted are the respective normals (green - range of average highs and lows) and record highs (red) and record lows (blue) for each date. Units are in degrees Fahrenheit. (Bottom) Plot of the rain accumulation (green), in inches, observed at the Lubbock Preston Smith International Airport in 2015. Also plotted is the distribution of the average rainfall (brown). Click on the graph for a larger view. Click HERE to view the graph for Childress.
The lower portion of the above graph nicely shows how wet 2015 was. After several cool season precipitation events, the year-to-date rainfall briefly slipped just below average in April. However, that quickly changed in May with numerous rain events, several of which were 1-2+ inches. Rain was less regular and lighter through the second half of the summer into the beginning of fall before becoming more frequent again in October. Amazingly, Lubbock secured above average yearly precipitation for 2015 in early July, mostly thanks to the extremely wet May which brought 12.12 inches and saw at least a trace of rain in 21 of the 31 days. The wettest day of the year was May 4th when 3.42 inches fell. The next wettest day was May 28th when 3.21 inches was recorded. A total of 7 days saw an inch or more of rain, including July 6th (2.43 inches), October 22nd (1.83 inches), May 14th (1.24 inches), May 5th (1.22 inches) and May 13th (1.02 inches). The final rain total of 29.45 inches finished as the wettest year on record in Lubbock since 2004 (33.25 inches) and the 6th wettest year overall. 2015 was also seventh time the Lubbock airport has recorded 20 inches or more in a year since the turn of the century. The moisture that fell was not all confined to the liquid phase. In fact, late December also brought a blizzard that dumped an impressive 11.2 inches of snow over a 2-day stretch, making it the third biggest snow event in Lubbock history. Collectively, with several snow events early in the year, 2015 recorded an impressive 23.0 inches of snow.
The graph above shows the 2015 daily temperature and a 10-day running mean (yellow line) at Lubbock as a departure from the 1981-2010 normals. Click on the graph for a larger view.
The above graph displays the daily (and 10-day running mean) temperature departure from normal. Lubbock began the year on the chilly side, with a more pronounced cold snap in late February and early March when widespread snow and freezing fog affected the region. Much of May was also on the cool side, thanks in part to the heavy rains and considerable amounts of cloud cover. A few other brief cool stretches occurred, including a cold end to the year complete with a historic blizzards after Christmas. The coldest temperature measured at Lubbock in 2015 was 13 degrees, reached on February 27th and again on the 28th. Warm spells included mid-January to mid-February, late March through mid-April and a large portion of the second half of the year. The hottest temperature of the year was 100 degrees, reached on four different occasions including three times in August and once in September. Overall, the average temperature at Lubbock for the entire year ended up 0.7 degrees above the 30-year average, spurred on primarily by rather mild overnight lows, while afternoon highs averaged just above the long-term mean.
2015 Monthly Highlights
JANUARY:
1-3rd: The year began on the cold and wintry side, with several rounds of ice, sleet and snow. A more complete summary to the kick off of the New Year can be FOUND HERE. 21-22nd: A couple of upper level disturbances phasing together along with gradually cooling air brought a period of snow to much of the South Plains. Four to six inches of snow fell across the northern South Plains into the southwest Texas Panhandle, with upwards of a foot near Amarillo. Read more about this round of snow HERE. 30-31st: Northwest Texas experienced a widespread cold rain with temperatures in the 30s and lower 40s. Rain totals of 0.50 to 0.75 inch was commonplace. Read more about the chilly rain event HERE.
FEBRUARY:
22-23rd: A strong front brought drastically colder air to the region, including a record minimum high at Lubbock of 22 degrees on the 23rd. The cold combined with a couple of rounds of light wintry precipitation to make travel difficult. To read a more complete summary CLICK HERE. 26th-March 1st: February closed out on the cold side, with a couple of rounds of snow and a few additional days of clouds, cold temperatures and prolonged periods of freezing fog. Snow totals of 5 to 7 inches were common from the southwest Texas Panhandle through the central South Plains and northern Rolling Plains. In addition, riming from the freezing fog created many beautiful winter landscapes, though it did also keep roadways slick. Read more about this wintry stretch HERE.
MARCH:
4th: A cold rain gradually changed to freezing rain, then sleet and finally snow as abundant moisture interacted with colder air moving in behind a strong cold front through the day. Sleet and snow totals of 1 to 2 inches were common, though Turkey recorded 4.5 inches. Read more about the wintry mix HERE.
APRIL:
8th: The first severe storms of the season struck West Texas. Strong wind gusts, in excess of 60 mph, were the primary hazard, though a few spots did receive small hail too. A peak wind gust of 82 mph was measured near Sundown. A detailed summary of this event can be READ HERE. 13th: Widespread rain impacted the region, with many spots recording over an inch. The southwestern South Plains were hardest hit, where 3 to 4+ inches were measured from Seagraves to Plains. This heavy rain did lead to flooding in parts of Yoakum County. Read more about this round of spring rain HERE. 16th: A couple of rounds of thunderstorms developed and moved across the region, with a few of the storms becoming severe. Several locations, including Spur, Ralls and Tahoka, saw hail to golf ball size. A summary of this event is AVAILABLE HERE. 22nd: Severe thunderstorms produced large hail, high winds and a brief tornado. The tornado occurred in an open field northwest of Floydada and produced no known damage. Hail as large as baseballs fell in Happy, while a wind gust to 67 mph was measured by the West Texas Mesonet site near Tulia. In addition, very heavy rain produced flooding in Caprock Canyons State Park. More details on this active evening can be FOUND HERE. 26-28th: A potent upper level storm system brought a round of strong and severe storms to the Rolling Plains, followed by widespread rain for the South Plains region. Many locations across the Texas Panhandle into the northern Rolling Plains recorded 1 to 2+ inches over the course of the event. To learn more about this wet period READ HERE.
MAY:
3rd-9th: Several rounds of thunderstorms brought severe weather and very heavy rain. This active stretch of weather kicked off an incredibly wet month. In addition to all the rain, one storm produced two brief tornadoes south of Lorenzo on the 5th. Read more about this unsettled stretch HERE. 13th: A large shield of rain dropped 0.75 to 1+ inches over most of the South Plains. In addition, an isolated storm behind the main shield of rain produced a brief tornado over open land near Guthrie. A more detailed write-up on this soggy day can be FOUND HERE. 14th: Another round of severe storms dumped large hail and torrential rainfall as well as producing strong outflow winds. The most intense storm of the day moved through Garza County, just north and west of Post, while widespread heavy rain produced flooding in and around Lubbock. For details on this event CLICK HERE. 16th: Scattered severe thunderstorms impacted the southern Texas Panhandle into the Rolling Plains. One storm produced a brief tornado over open land northeast of Silverton shortly after 1 pm. To learn more about these storms READ HERE. 23rd-29th: An active late May brought rounds of severe thunderstorms with heavy rain. A persistent supercell storm near Hale Center on the 27th dropped baseball to softball size hail and torrential rainfall. The next day Shallowater received nearly 7 inches of rain, most of which fell in a couple of hours. A more detailed story on this active period can be FOUND HERE. Entire Month: Numerous rounds of showers and thunderstorms resulted in near-record amounts of rain for the month, with Lubbock finishing with 12.12 inches. This was the second wettest May on record and third wettest month on record for Lubbock. A much more detailed analysis of this incredibly wet month can be ACCESSED HERE.
JUNE:
12-15th: Rounds of severe thunderstorms and heavy rain again impacted the region. Hail as large as tennis balls fell just west of Plains on the 12th, with baseball-sized hail near Ropesville. The 13th brought wind gusts to 65+ mph across the southern South Plains as a squall line moved through, while additional activity dumped heavy rain on the region on the 14th and 15th. To read more on this active stretch of weather CLICK HERE.
JULY:
6-7th: Widespread slow-moving storms dropped heavy rain over much of the South Plains region. The heaviest rain fell from Lubbock through Post and Lake Alan Henry where 3-5+ inches were recorded. Read more about this mid-summer round of rain HERE. 8-9th: Another round of heavy rain struck the region, this time focused across the southern Texas Panhandle into the northern Rolling Plains where 3-6+ inches fell. The heavy rain resulted in a surge of water down the Prairie Dog Town Fork of the Red River north of Childress, briefly peaking about a foot and a half above flood stage. Learn more about this round of heavy rain HERE.
AUGUST:
19th: An unseasonably strong late summer cold front sparked thunderstorms across the central Texas Panhandle. These storms moved southeastward and brought heavy rain to the southern Texas Panhandle during the late night hours. In addition, one storm produced a 61 mph wind gust near Tulia as it moved through. A full write-up on this event can be accessed HERE.
SEPTEMBER:
1st-30th: As opposed to September of 2014, this month was relatively quiet with below average precipitation and above average temperatures. Lubbock officially made it to the 100 degree mark for the final time in the year on the 18th.
OCTOBER:
3rd-5th: The month started on the cool and damp side, with much of the southern Texas Panhandle into the central and western South Plains seeing 1 to 2 inches of rain. More on this cool and wet start to October can be FOUND HERE. 7th-8th: A large batch of heavy rain again affected the southwest Texas Panhandle into the western and central South Plains, with many spots recording 1-2+ inches. More on this round of rain can be FOUND HERE. 21st-22nd: Widespread heavy rain affected West Texas as a slow-moving storm system approached from the west. Many spots received 1-3 inches of rain, with localized 3-4 inch amounts. This rain squashed the reemerging drought in the Rolling Plains. Read more about this rain event HERE.
NOVEMBER:
16th-17th: An intense upper level storm system spurred numerous strong to severe thunderstorms during the afternoon and evening hours. The Texas Panhandle was hardest hit with several tornadoes touching down there. The South Plains region didn't see any tornadoes, but did have locally heavy rains and damaging wind gusts. A gust to 71 mph was measured at the Lubbock Airport around 7 pm. A complete summary of this late season round of severe thunderstorms can be FOUND HERE. 26th-29th: After a unseasonably warm Thanksgiving, a strong cold front and slow moving upper level storm system brought numerous rounds of wintry weather over the remainder of the holiday weekend. Much of the precipitation fell in the form of freezing rain and sleet, with a little snow occasionally mixing in. The ice made travel tricky for several days. More on this wintry holiday weekend can be FOUND HERE.
DECEMBER:
26th-27th: The Christmas Weekend Blizzard struck the region, bringing freezing rain, sleet and heavy snow coupled with cold temperatures and severe north winds. Many spots on the Caprock saw 6 to 12+ inches of snow, which drifted to 5 to 10+ foot drifts. The storm crippled the region for several days before conditions slowly improved. Read more on this historic blizzard HERE.
Satellite view of the snowpack from the blizzard on Monday afternoon, December 28th. Click on the image to view a larger version. The image is from the MODIS instrument on NASA's TERRA satellite.

 The main weather story of 2015 was the above average precipitation which fell across the South Plains area for the second year in a row, punctuated by an extremely wet May. The rounds of heavy rain helped lift West Texas, and more generally the state of Texas, out of the prolonged drought that had reigned supreme through the early 2010s. 29.56 inches of precipitation fell at Lubbock during 2015, which was the sixth highest amount in the historical record.
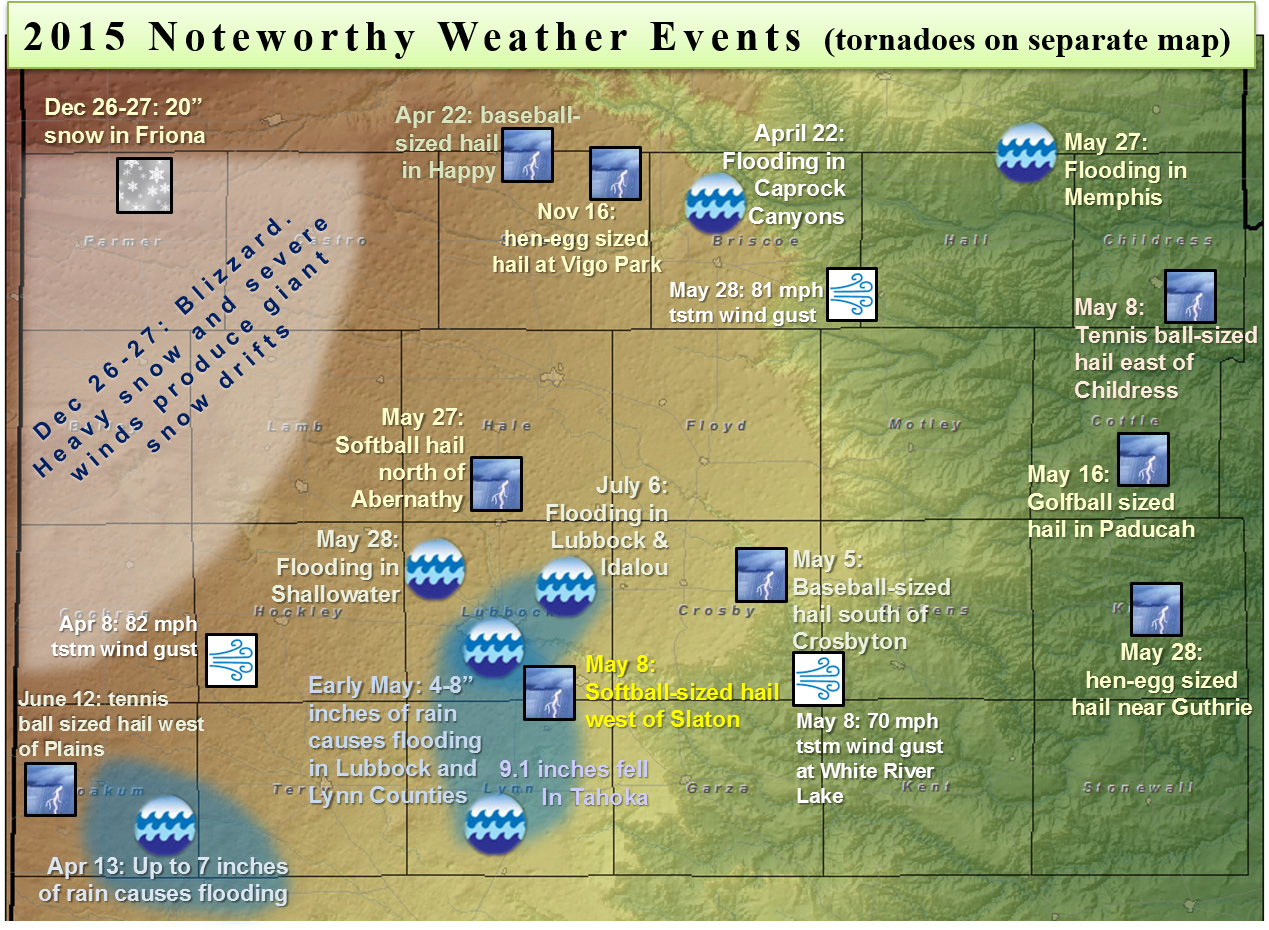


 Follow us on YouTube