The main weather story of 2016 was the overall warmth. The year ended as the third warmest on record, finishing with an average yearly temperature of 63 degrees. Precipitation was regular and heavy enough to keep drought conditions from developing on more than localized and modest levels. 13.47 inches of precipitation fell at Lubbock during 2016, which was the 26th lowest in the historical record.
As usual, the Texas South Plains saw a wide variety of weather through the year. Fortunately, we made through late winter and early spring with only one of the strong wind storms which often plague the region that time of year. And this contributed to keeping the wildfire season in check. Our traditional severe weather season of April, May and June was also a little quieter than usual. We were again fortunate that the few tornadoes that developed hit mainly open country. Summer was generally hot with a few breaks with thunderstorms and rain. Autumn brought some more thunderstorms, and winter was mild aside from an Arctic blast in mid-December. If you are interested in delving further into the weather of 2016, read on!
2016 Maps of Significant Weather Events
The map below highlights some of the more significant weather events that occurred across the area in 2016. May was an active period of severe weather focused on Hall and Motley Counties. The town of Turkey, in southwest Hall County, seemed to be at the epicenter for much of the severe weather in 2016. In contrast, the year as a whole was a little quieter than average up on Caprock, although there were still some localized major events.
Map displaying many of the more notable weather impacts to the region in 2016. Note that this is just a sampling of events, many more have been omitted due to space constraints. Click on the image to view a larger map.
Eight tornadoes were observed in the Lubbock 24-county service area in 2016. This was an increase from the five observed in 2015, but still well below the long-term yearly average of 18. It was the seventh straight year of below average number of tornadoes. At least two of the reported tornadoes (May 22 in Hall County and May 23 in Motley County) were large and intense tornadoes - fortunately they occurred over rangeland.
Precipitation Summary
This map displays the 2016 year precipitation totals. The map was created with data gathered from the NWS Cooperative observers and the West Texas Mesonet. Click on the map to view a full-sized version.
Precipitation in 2016 varied widely across the region. Overall, precipitation totals were down significantly from the very wet 2015, with the exception of the northern Rolling Plains - where the yearly totals were roughly similar. An "Arrow"-shaped region from Castro County, southeast to Crosby County, then southwest through Terry County, generally saw the least precipitation in our forecast area, although there is quite a bit of variation in the rainfall even just across Lubbock County. This is fairly typical for the high plains where convective-type precipitation dominates. For example, Lubbock International Airport only received 13.47 inches of precipitation, well below the long-term average of 19.12 inches. However, one gauge in southwest Lubbock measured 20.86 inches, a couple inches above normal.
The map below shows the 2016 precipitation as a percent of the long-term average, or "normal". This image shows a dry region extending from the southwest Texas Panhandle through much of the central South Plains, and extending into the western Rolling Plains. Total precipitation in the western South Plains was mixed, while much of Lynn and Garza Counties were relatively wet. Most of the Rolling Plains north of Stonewall County received slightly above average precipitation in 2016.
This map shows the 2016 rainfall as a percent of the 30-year normal rainfall (1971-2000). Also plotted is the rainfall observed, in inches, at each collection site. Please click on the map to view a full-sized version. If you would like to see the precipitation as a departure from normal please CLICK HERE.
Drought Update and Reservoir Levels
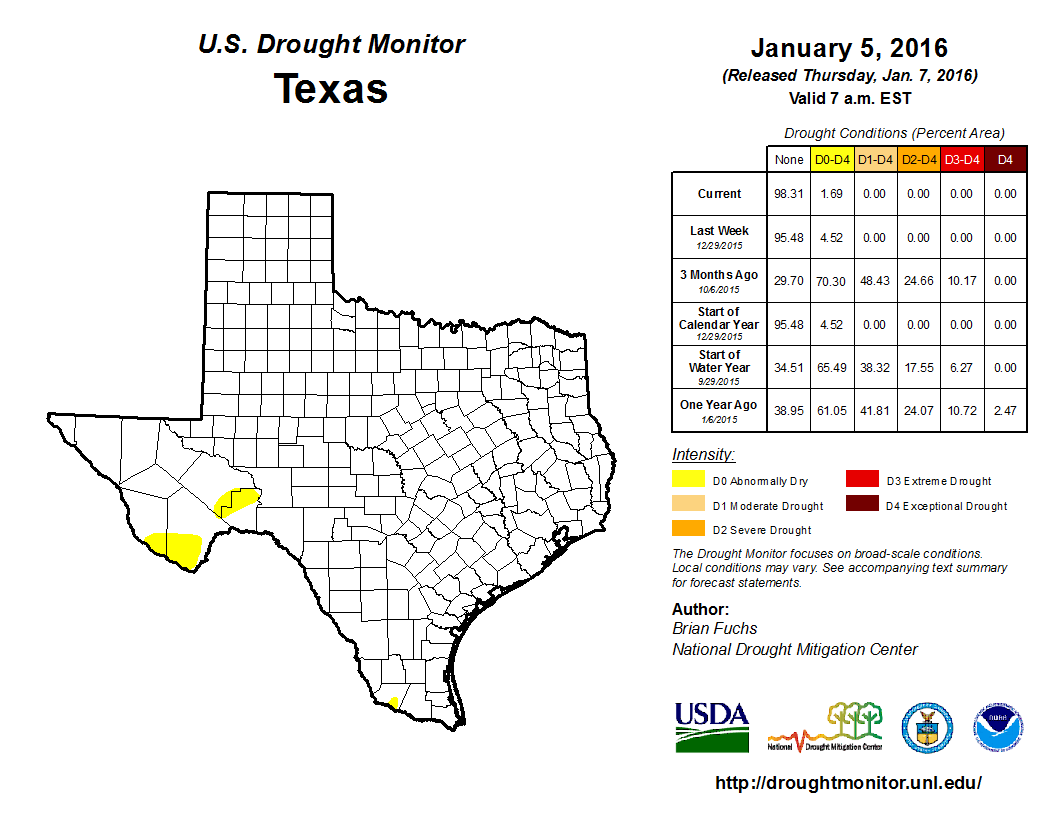
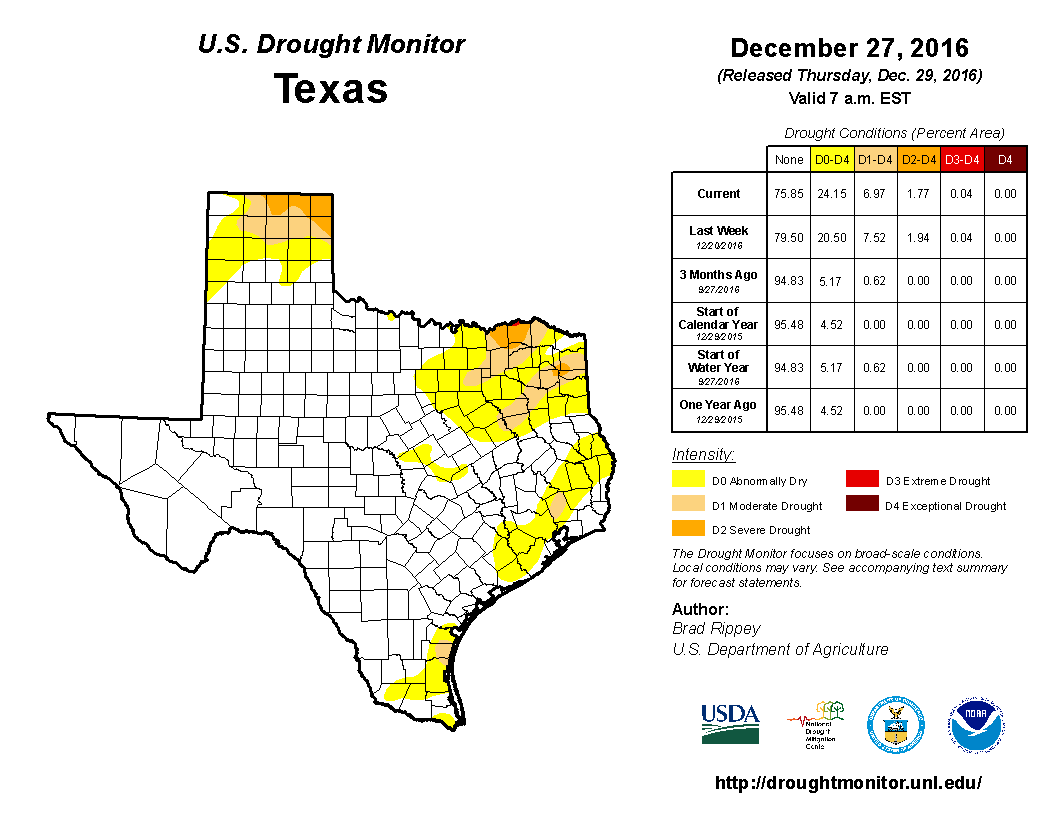
The year started on a good note with no drought anywhere in the state, and only a small area of abnormally dry conditions (D0) over parts of the Big Bend. Through the course of the spring and summer portions of the South Plains region did occasionally stray into a moderate drought (D1), though rains were generally frequent, widespread and heavy enough to keep the drought in check. A relative wet period at the end of the summer and early fall essentially wiped out any lingering drought conditions. A few bouts of rain through the late fall and early winter also kept moisture levels in check, though parts of the Panhandle and East Texas were drier and did see drought conditions creep back.
This map shows the drought conditions on January 5, 2016. Click on the map to view a full-sized version.
This map shows the drought conditions on December 27th, 2016. Click on the map to view a full-sized version.
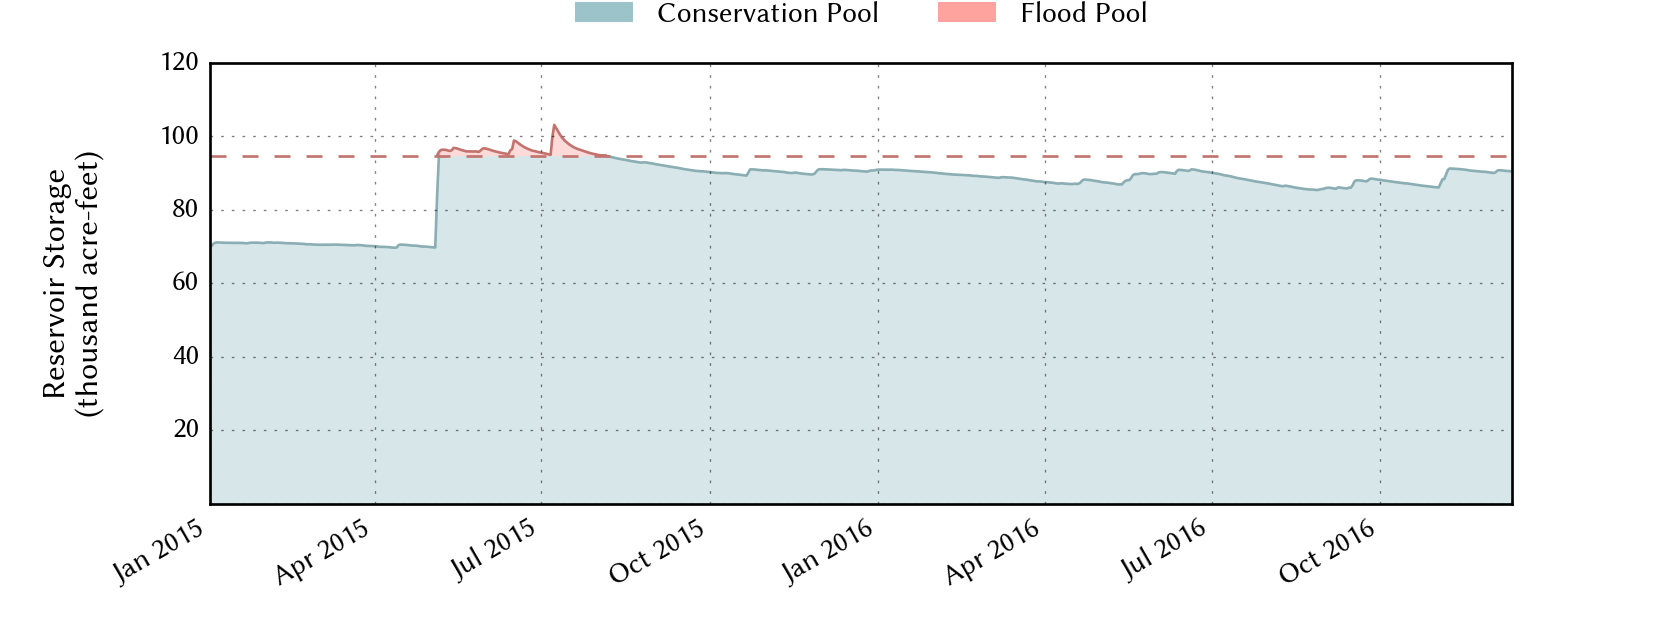
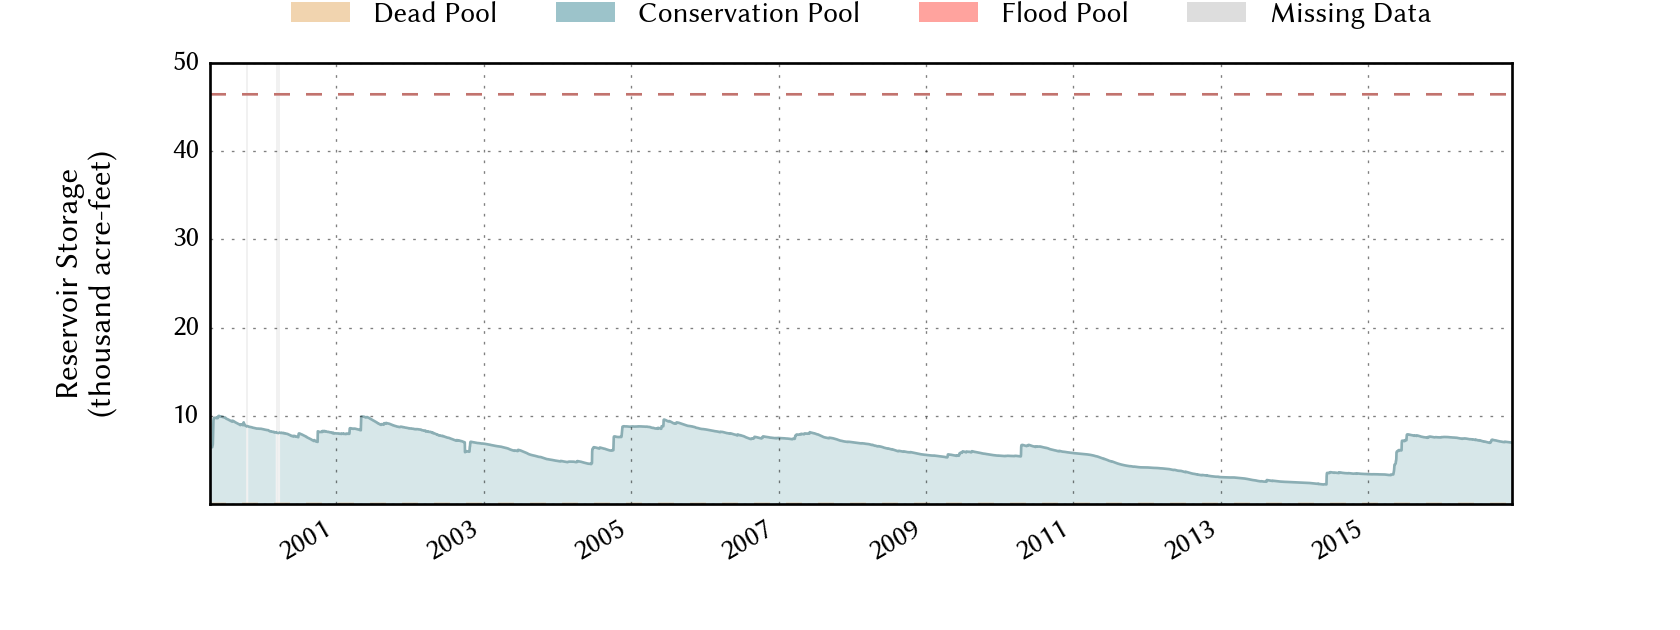
The overall lack of drought and relatively regular precipitation (by West Texas' standards) through the course of 2016 helped maintain rather steady lake and reservoir levels. Lake Alan Henry maintained levels between 90% and 97% of capacity, and ended the year near what it began at 95%. Additionally, White River Lake, Lake Meredith and Lake Mackenzie held fairly steady through the year and finished at 25%, 18%, and 23% of capacity levels, respectively.
Recent plot of the water level for Lake Alan Henry. Click on the image for a full-sized version. A longer record of data for Lake Alan Henry can also be VIEWED HERE. The graphs are courtesy of: www.waterdatafortexas.org
Recent plot of the water level for White River Lake. Click on the image for a full-sized version. A longer record of data for White River Lake can also be VIEWED HERE. The graphs are courtesy of: www.waterdatafortexas.org
Recent plot of the water level for Mackenzie Reservoir. Click on the image for a full-sized version. A longer record of data for Mackenzie Reservoir can also be VIEWED HERE. The graphs are courtesy of: www.waterdatafortexas.org
Recent plot of the water level for Lake Meredith. Click on the image for a full-sized version. A longer record of data for Lake Meredith can also be VIEWED HERE. The graphs are courtesy of: www.waterdatafortexas.org
Lubbock Statistics
2016 will go down in the books as the third warmest and 26th driest year since records began in 1911 at Lubbock. Warm temperatures prevailed most of the year, with May and August being the only months to finish with below average mean temperatures. Not surprisingly, May and August were also the two months that recorded above average precipitation. The warmest months, with respect to average, were March (+5.2°F), July (+5.4°F) and October (+6.0°F) which all finished greater than 5 degrees above average.
Precipitation was sluggish to begin the year, but recovered to near normal with a burst of rain in mid-May. After that, rain tallies fell below the long-term average, but were regular enough to keep drought conditions from gaining hold. After the historic blizzard at the end of 2015, snow was rather sparse, with 2.1 inches recorded in January and trace amounts in February, April, and December. The Lubbock Airport recorded a total of 13.47 inches of precipitation for 2016, finishing a little more than 5 inches below average. Interestingly, the Lubbock Airport was within a relative precipitation minimum, with most of the remainder of the region seeing amounts closer to normal. In fact, a West Texas Mesonet Station located about 7 mile southwest of the official rain gauge recorded over 19 inches of rain for the year. Not surprisingly, at the airport, 10 months finished with below average precipitation for the year, with May and August being the exceptions. Two daily record rainfalls were set in 2016: 0.44 inches on April 19th; and 1.88 inches on May 14th. Over an inch of rain was recorded only on two days at the Lubbock Airport in 2016, May 14th (1.88") and October 13th (1.01").
The hottest temperature in 2016 was a scorching 109 degrees, reached on July 7th. This tied with four other dates as the 6th hottest reading on record, and was only 5 degrees shy of the all-time record of 114°F set on June 27, 1994. The high reached or exceed 105 degrees on four other occasions: July 6 (105°F); July 11th (108°F); July 12th (107°F) and July 13th (108°F). In all temperatures reached the triple digits on 13 occasions, which was slightly above the long term average of 10. On the other side of the pendulum, the coldest temperature of the year was 4 degrees, experienced December 18th. Only six nights fell below 20°F for the entire year, three in early February and three in mid-December. Thirteen record highs were tied or set in 2016: 80°F on January 30th; 87°F on February 18th; 85°F on February 19th; 85°F on February 20th; 87°F on March 22nd; 105°F on July 6th; 109°F on July 7th; 108°F on July 11th; 107°F on July 12th; 108°F on July 13th; 94°F on October 17th; 88°F on November 1st; and 78°F on December 16th. In addition, 12 record high minimum temperatures were set in 2016. One record low was set, the 4°F on December 18th. No record low maximum temperatures were set in 2016.
LUBBOCK
Average High
Average Low
Precip (inches)
January
55.3
27.0
0.30
February
65.4
30.8
0.09
March
72.6
41.5
0.20
April
76.8
46.8
1.02
May
81.2
54.5
3.66
June
91.5
66.2
1.04
July
99.5
71.4
0.58
August
90.6
66.6
3.03
September
84.2
62.1
1.47
October
81.9
53.0
1.05
November
67.5
41.1
0.54
December
55.6
28.4
0.49
Annual
76.9
(9th warmest)
49.2
(2nd warmest)
13.47
(26th driest)
Normal
74.3
47.0
19.12
Departure
+2.6
+2.2
-5.65
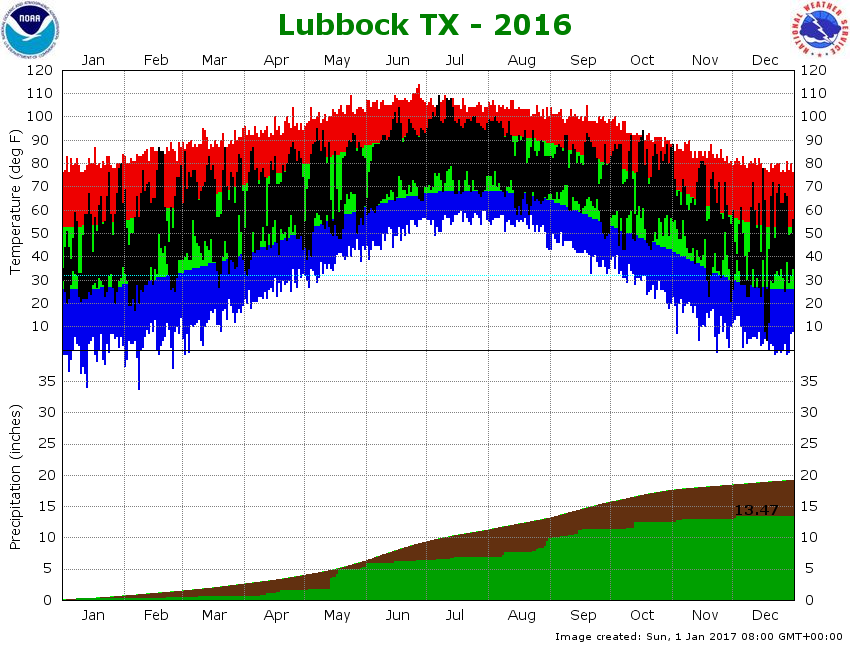
The top portion of the below graph shows the daily high and low temperature distribution for 2016 at Lubbock Preston Smith International Airport. Most of the year we saw temperatures warmer than average. Notably, the average temperature each day in the month of July was above the normal average temperature. However, the average temperature for the months of May and August were slightly below average. The year also closed out on the mild side, after an incursion of Arctic air that resulted in the coldest temperature of the year, 4 degrees on December 18th.
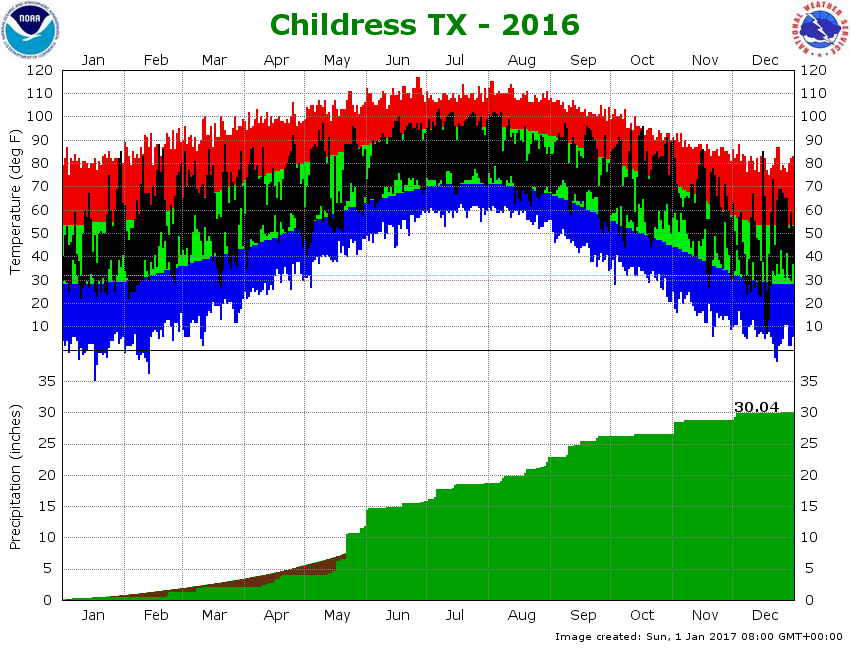
(Top) Plot of the maximum and minimum temperatures (connected by a black line) observed at the Lubbock Preston Smith International Airport in 2016. Also plotted are the respective normals (green - range of average highs and lows) and record highs (red) and record lows (blue) for each date. Units are in degrees Fahrenheit. (Bottom) Plot of the rain accumulation (green), in inches, observed at the Lubbock Preston Smith International Airport in 2016. Also plotted is the distribution of the average rainfall (brown). Click on the graph for a larger view. Click HERE to view the graph for Childress.
The lower portion of the graph shows how dry Lubbock was, with the precipitation total of 13.47 inches nearly six inches below average. As noted above though, many places around Lubbock, including the south and west side of town, received significantly more precipitation. As can be seen in the graph, the year-to-date precipitation was near average to start June, but we then fell more and more behind until a relatively wet period from August through October.
2016 snowfall in Lubbock was a paltry 2.1 inches, compared to 23 inches in 2015. The 2.1 inches was the lowest yearly total since 2008, when only 1.6 inches fell.
The graph above shows the 2016 daily temperature and a 10-day running mean (yellow line) at Lubbock as a departure from the 1981-2010 normals. Click on the graph for a larger view.
The graph above displays the daily temperature as the departure from the "normal", or 30-year average temperature. The yellow line represents the 10-day running mean of the daily temperature departure and is used to smooth out the day-to-day extremes so that longer trends are easier to see. Three very warm periods can be seen; Mid-February through Mid-March, late June through early August, and most of October and November. Cold spells were of much shorter duration and more frequent from January through May. Overall, the average temperature of 63.0 degrees at Lubbock for the entire year was 1.4 degrees above the 30-year average.
2016 Monthly Highlights
JANUARY:
1st-31st: The month had a great amount of variability in temperature, as is common for January, but finished less than a degree above average. The month was also relatively dry, finishing with only 0.30" of precipitation in Lubbock. 8th: A quick moving storm system joined with a strong cold front to bring widespread light to moderate precipitation to the region. Rain turned to snow through the evening hours with a dusting to a couple of inches of snow common over parts of the South Plains. Lubbock officially recorded 2.1 inches of snow while Crosbyton was the big winner with a quick four inches.
FEBRUARY:
22-23rd: The first widespread precipitation in over a month fell over the South Plains region as sufficient moisture was tapped by a relatively strong upper level storm system. Moderate rain and even a little lightning were observed. Sleet and snow even mixed in as cooler air moved in on the 23rd, though relatively warm roadways kept travel issues to a minimum. To read a more complete summary CLICK HERE.
MARCH:
23rd: West Texas was graced with a round of strong winds and blowing dust. Wind gusts as high as 60-67 mph were recorded over the southern Texas Panhandle. This same storm system responsible for our winds brought a blizzard to parts of Colorado, Kansas and Nebraska. Read more about the windy and dusty day HERE.
APRIL:
1st: The first of the month brought cold rain and even up to a couple of inches of snow to parts of the South Plains. Mild temperatures kept overall impacts low though. A detailed summary of this event can be READ HERE. 10th: The first round of severe storms for the year developed and tracked across the area through the afternoon and evening hours. Golf ball to tennis ball size hail fell in and around Edmonson, Kress, Slaton, Ralls, and Dickens. Read more about this round of spring rain HERE. 16th: A dryline and upper level storm system sparked severe thunderstorms in the Rolling Plains. A few tornadoes were observed over open lands of northern Kent and eastern Dickens Counties. Additionally, copious amounts of rain and hail fell in a swath from Spur northeastward through Guthrie. A summary of this event is AVAILABLE HERE. 20th-21st: A round of thunderstorms which occasionally strengthened to severe levels swept southward over the South Plains and Rolling Plains during the evening and overnight hours. More details on this active evening can be FOUND HERE. 28th: A cold front and dryline provided the focus for the development of two supercellular storms. The storms tracked over the northeast South Plains into the southeast Texas Panhandle, dropping up to 2" diameter hail and producing occasional wall clouds. To learn more about this round of severe weather READ HERE.
MAY:
13th-14th: Two clusters of storms moved southeastward across the eastern South Plains and much of the Rolling Plains during the evening of the 13th. Hail as large as golf balls was reported in northeast Childress County while wind damage occurred in Cottle and King Counties. Additional storms formed on the morning of the 14th, bringing much needed rain to the Lubbock area, where yearly rainfall was doubled in the day. Read more about this stormy stretch HERE. 22nd-23rd: Two rounds of severe thunderstorms impacted the eastern South Plains into the western Rolling Plains and southeast Texas Panhandle. One particularly intense supercell produced a tornado near Plaska during the evening of the 22nd. This same storm dropped baseball to softball size hail and torrential rainfall over parts of Hall County. The next night a tornadic storm moved northwestward narrowly missing the town of Turkey. A more detailed write-up on these two days of high-impact weather can be FOUND HERE. 29th-30th: A large complex of thunderstorms developing southward out of the Texas Panhandle brought hail, wind, dust and heavy rainfall to the region. Hail as large as baseballs fell just north of Paducah. Another round of storms developed late on the 30th, with smaller hail and widespread moderate to heavy rain. For details on these storms CLICK HERE.
JUNE:
1st: June starts out with heavy rain across much of the western South Plains. Southwest Lubbock got hit with torrential rainfall that measured up to 5 inches and caused flooding. For more information, CLICK HERE.
9th-15th: Mid-June brought several rounds of thunderstorms to the area. A cluster of storms in the western South Plains on June 11th brought wind gusts of 60 to 75 mph and blowing dust. On June 15th, a severe thunderstorm near the town of Turkey dropped softball-sized hail. Read more on this activity HERE.
JULY:
5-7th: Early July brought extreme heat to the region with temperatures topping out well over 100 degrees on several days. In addition, a couple of afternoons brought severe thunderstorms that dropped locally heavy rainfall and strong downburst winds. Read more about this mid-summer heat and storms HERE.
AUGUST:
23rd-26th: A slow moving storm system and plenty of moisture brought an unsettled stretch of weather to West Texas. One to three inches of rainfall was fairly common with localized higher amounts over the course of the four day stretch. A full write-up on this event can be accessed HERE.
28th-31th: Another unsettled period of weather closed out the month of August. Many locations across the central and western South Plains and southwest Texas Panhandle recorded 2 to 5+ inches over the wet late-August stretch. A full write-up on this event can be accessed HERE.
SEPTEMBER:
6th-7th: A couple of rounds of thunderstorms produced heavy rains across much of the Caprock. Rain totals of 1 to 2 inches were pretty common. Read more about these rounds of rain HERE.
15th-18th: Several more rounds of thunderstorms brought heavy rain to the region. One particularly strong storm produced a wall cloud and severe wind gusts near Anton. Read more about the rounds of storms HERE.
OCTOBER:
1st-31st: October 2016 when down in the record books as the warmest October in history. It beat out the previous record of 1934 by an astounding 1.3 degrees. More about this warm month can be FOUND HERE.
NOVEMBER:
2nd: Early November brought a late season round of severe thunderstorms and heavy rain, with the bulk of the activity affecting the southern South Plains into the Rolling Plains. A complete summary of this late season round of severe thunderstorms can be FOUND HERE.
DECEMBER:
2nd-3rd: A widespread cold rain visited northwest Texas, with even a few reports of sleet and snow across the southwest Texas Panhandle. Locations off the Caprock fared the best recording widespread 1 to 2 inch totals. Read more on this dreary period HERE.
16th-17th: An Arctic blast caused temperatures to drop from the 60s and 70s to teens and single digits in the span of one afternoon. The front generated strong to severe wind gusts. Additionally, a little light wintry precipitation affected the region, though with minimal impacts. Wind chills late on the 16th and early on the 17th dropped to as low as 20 degrees below zero. Read more on this bone-chilling stretch HERE.
25th: Christmas Day 2016 brought a brief early-day line of showers and thunderstorms followed by a windy, mild and dusty afternoon. Read more about this eventful Christmas HERE.

 The main weather story of 2016 was the overall warmth. The year ended as the third warmest on record, finishing with an average yearly temperature of 63 degrees. Precipitation was regular and heavy enough to keep drought conditions from developing on more than localized and modest levels. 13.47 inches of precipitation fell at Lubbock during 2016, which was the 26th lowest in the historical record.
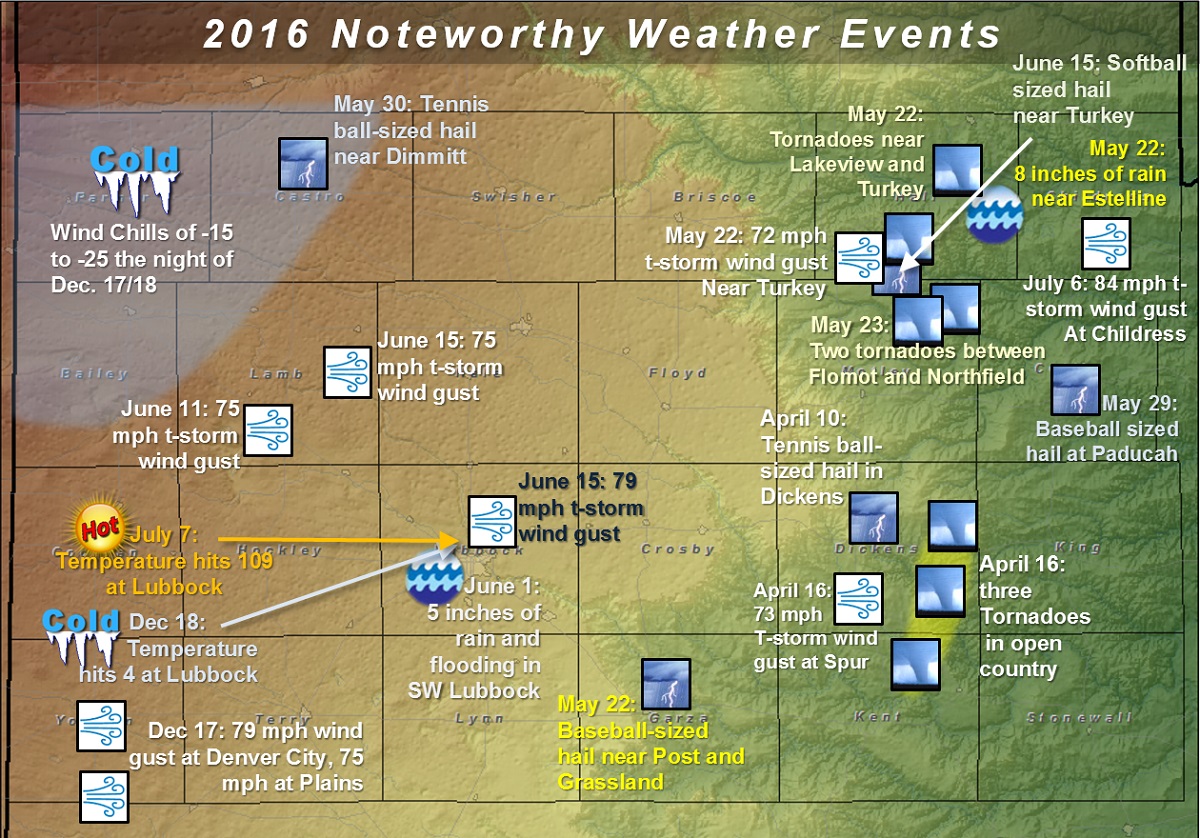


 Follow us on YouTube