The July Heat Wave of 2020
The middle part of July 2020 brought intense heat to West Texas. Both high and low temperature records were threatened and broken through the middle portion of the month, as can be seen below.
| Latest Max/Min Temperatures at Lubbock | ||||||
|---|---|---|---|---|---|---|
| Date | High | New Record | Current/Old Record | Low | New Record | Current/Old Record |
| Wed 7/8 | 100 | X | 106/2009 | 69 | X | 74/2011 |
| Thu 7/9 | 105 | X | 107/2009 | 80 | ✓ | 77/2011 |
| Fri 7/10 | 102 | X | 109/1940 | 79 | ✓ | 74/2006 |
| Sat 7/11 | 106 | X | 108/2016 | 76 | X | 77/2016 |
| Sun 7/12 | 105 | X | 107/2016 | 79 | ✓ | 78/2016 |
| Mon 7/13 | 110 | ✓ | 108/2016 | 79 | ✓ | 79/2016 |
| Tue 7/14 | 111 | ✓ | 108/1933 | 86* | ✓ | 76/2018 |
| Wed 7/15 | 103 | X | 105/2001 | 76 | X | 77/2011 |
| Thu 7/16 | 101 | X | 105/2001 | 69 | X | 75/2011 |
| Fri 7/17 | 101 | X | 105/1989 | 77 | ✓ | 76/2019 |
| Sat 7/18 | 100 | X | 103/2018 | 73 | X | 78/1978 |
| Sun 7/19 | 96 | X | 108/1936 | 75 | X | 81/2018 |
* All time record high minimum temperature. The previous record was 81 degrees, set on July 19, 2018.
Why was it hotter than normal?
"Normal" or average high temperatures this time of year are in the lower 90s for Lubbock and middle 90s for Childress, while normal low temperatures are in the upper 60s for Lubbock and near 70 for Childress. The "normal" is just an average of all the temperatures recorded at each station. The normal values can be calculated from the entire historical record for a station, or in 30-year periods (official NWS method, current period is from 1981-2010).
Although every year is different, during a typical summer there is usually at least one period where a large ridge of high pressure and warm air aloft develops across the western United States, often centered around the Four Corners region. This is partly due to the general global circulation which results in the descending branches of the Hadley (low-latitude) and Ferrel (mid-latitude) cells meeting across the region, combined with the particular geography of the North American Continent. (see https://www.weather.gov/jetstream/circ for more information.)
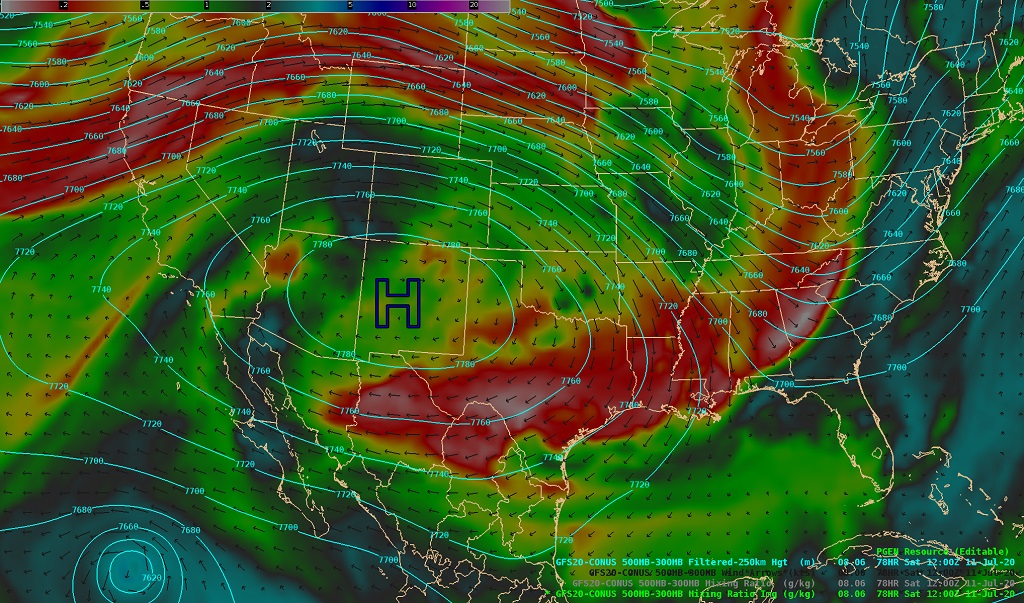
In July 2020, a dome of high pressure and warm air aloft developed over the Desert Southwest and into the southern Rockies and High Plains. The image below shows one model's (GFS) forecast of this pattern valid on Saturday morning, July 11 (click image to enlarge it).
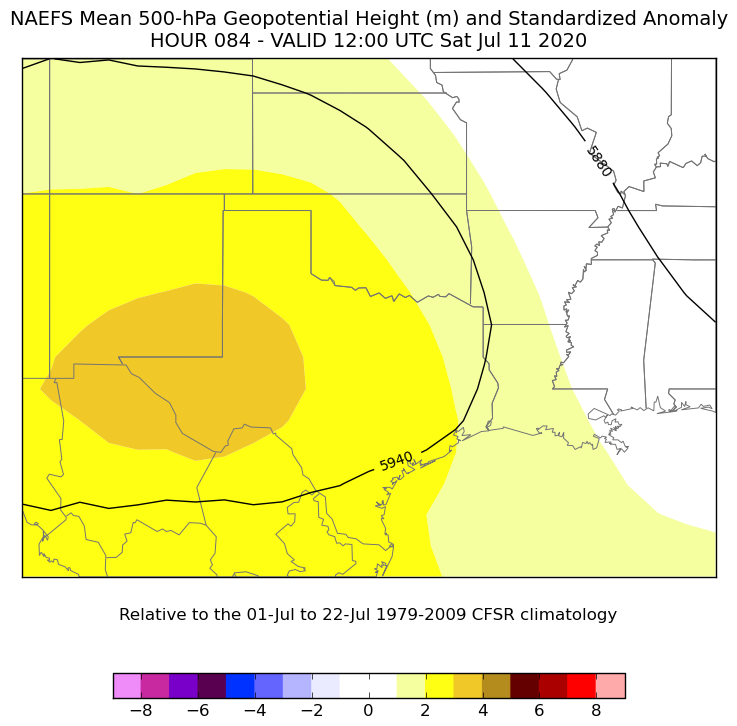
This high pressure ridge was stronger than usual. The image below, showing a forecast at the same time as above, tells us that the height of the 500 mb pressure level was forecast to be higher (the yellows and browns), which results in a warmer atmosphere than is typical for this already hot time of year (click image to enlarge it).
The high pressure dome remain parked over this area through the entire middle portion of July. This kept the heat going across West Texas, with high and low temperatures well above normal, including several daily record.
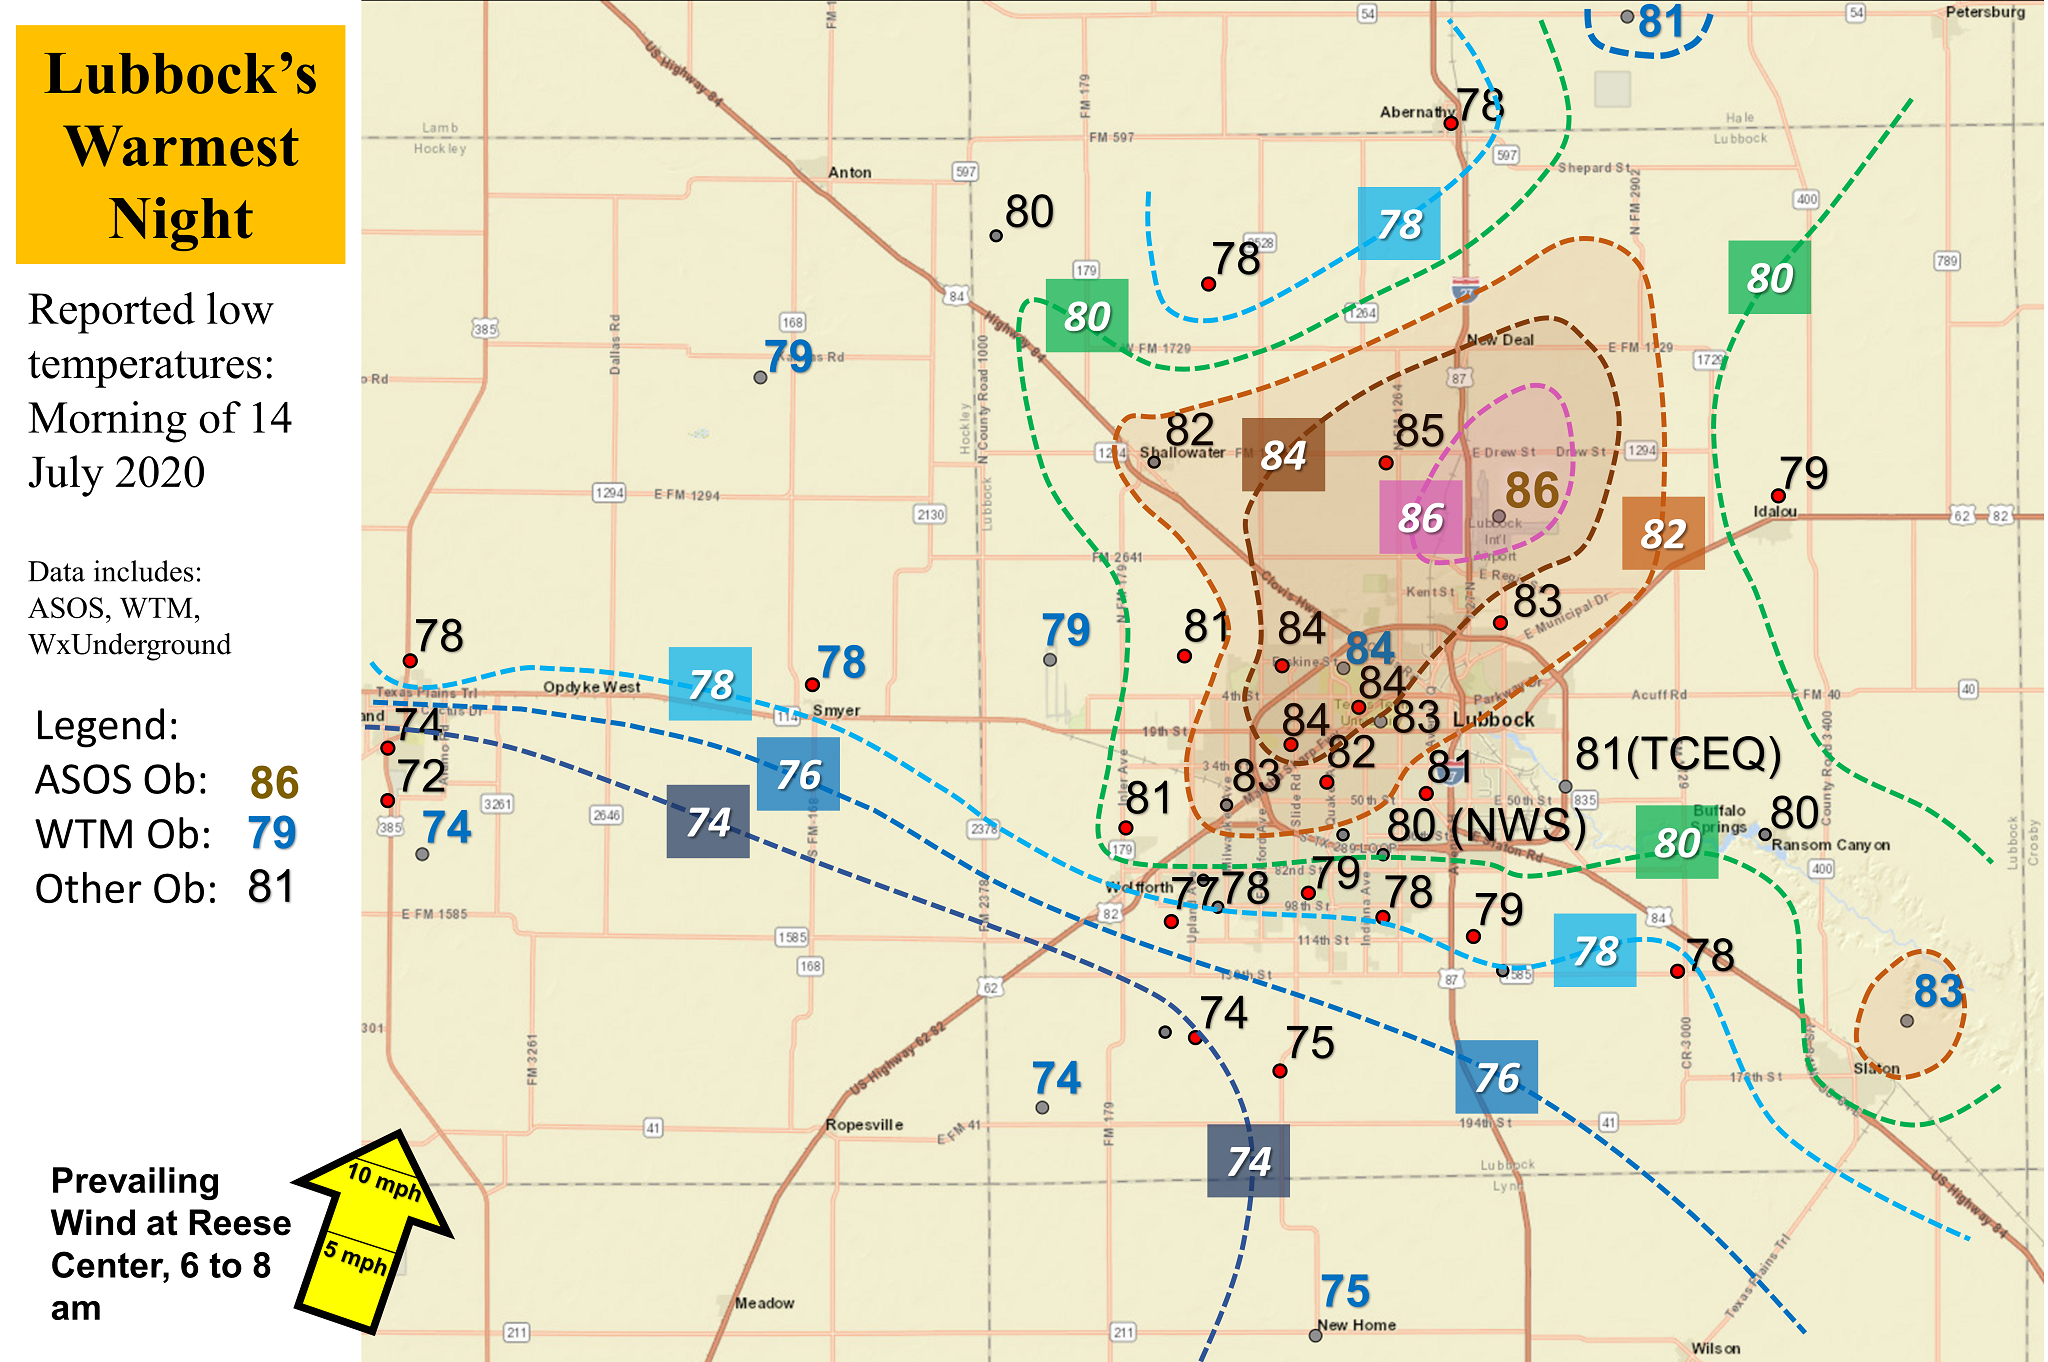
In addition to the daily records, Lubbock recorded its warmest low temperature ever on July 14 when the mercury only dipped to 86 degrees that morning. This shattered the previous warm low record of 81 degrees, which was set on July 19, 2018. The below map shows the observed lows around the Lubbock area on the 14th. The warmest lows, in the lower to middle 80s, favored the northern half of the city, with the peak being at the official observing site at the Lubbock International Airport north of town. This was, in part, due to the prevailing south-southwesterly early morning breezes carrying the warmest air over the city (caused by all the structures and pavement) toward the north-northeast. Outside of the immediate city influences, lowers were generally in the middle 70s to around 80 degrees.
The extremely warm start to the 14th led to a scorching afternoon when the high reached 111 degrees. The 111 degrees tied for the 4th hottest day on record at Lubbock, and collectively July 13th (high of 110 degrees) and 14th are now the only two days, outside of June, where highs were 110 degrees or higher. In total, July 2020 recorded 11 straight days where the high temperature reached 100 degrees or hotter, tying 1994 for the second longest stretch of such a dubious honor. Only 1980 collected more consecutive 100 degree days (12), though 2011 did record two such stretches in the top 10 (9 straight days and 7 straight days).
The following charts show some of the climate data for Lubbock and Childress that help put this hot spell into perspective.
|
High Temperature Records
(July 9 to July 17) |
|||||
| Lubbock | Childress | ||||
| Day | Degrees (F) | Year | Day | Degrees (F) | Year |
| 7/9 | 107 | 2009* | 7/9 | 108 | 2009 |
| 7/10 | 109 | 1940 | 7/10 | 110 | 2009 |
| 7/11 | 108 | 2016 | 7/11 | 109 | 1940 |
| 7/12 | 107 | 2016 | 7/12 | 107 | 2001 |
| 7/13 | 110 | 2020 | 7/13 | 110 | 2020 |
| 7/14 | 111 | 2020 | 7/14 | 112 | 2020 |
| 7/15 | 105 | 2001* | 7/15 | 108 | 1936 |
| 7/16 | 105 | 2001 | 7/16 | 106 | 2009 |
| 7/17 | 105 | 1989 | 7/17 | 109 | 1989 |
| 7/18 | 103 | 2018* | 7/18 | 108 | 1978 |
| * and previous years | |||||
|
Warm Low Temperature Records
(July 9 to July 17) |
|||||
| Lubbock | Childress | ||||
| Day | Degrees (F) | Year | Day | Degrees (F) | Year |
| 7/9 | 80 | 2020 | 7/9 | 78 | 2011* |
| 7/10 | 79 | 2020 | 7/10 | 77 | 1980* |
| 7/11 | 77 | 2016 | 7/11 | 87 | 2001 |
| 7/12 | 79 | 2020 | 7/12 | 80 | 1956 |
| 7/13 | 79 | 2020* | 7/13 | 81 | 1934 |
| 7/14 | 86 | 2020** | 7/14 | 85 | 2020 |
| 7/15 | 77 | 2011 | 7/15 | 82 | 1956 |
| 7/16 | 75 | 2011 | 7/16 | 88 | 2001 |
| 7/17 | 77 | 2020 | 7/17 | 78 | 1971 |
| 7/18 | 78 | 1978 | 7/18 | 81 | 1978 |
|
* and previous years ** all time record warm low |
|||||
Number of Excessively Hot Days and Warm Nights (yearly total)
|
Days with highs of 100 degrees or higher *updated through July 29th |
|||||
| Lubbock | Childress | ||||
| Rank | Number of Days | Year | Rank | Number of Days | Year |
| 1 | 48 | 2011 | 1 | 94 | 2011 |
| 2 | 29 | 1934 | 2 | 71 | 1934 |
| 3 | 26 | 1994 | 3 | 70 | 1939 |
| T4 | 25 | 2018 | 4 | 58 | 1930 |
| T4 | 25 | 1998 | T4 | 56 | 1936 |
| T6 | 24 | 2012 | T6 | 53 | 1998 |
| T6 | 24 | 1924 | T6 | 53 | 1943 |
| T8 | 22 | 2006 | T8 | 52 | 1946 |
| T8 | 22 | 1940 | T8 | 52 | 1937 |
| T8 | 22 | 1936 | 10 | 51 | 1945 |
|
Days with lows of 75 degrees or higher *updated through July 29th |
|||||
| Lubbock | Childress | ||||
| Rank | Number of Days | Year | Rank | Number of Days | Year |
| 1 | 27 | 2011 | 1 | 63 | 2011 |
| 2 | 13 | 2020 | T2 | 46 | 1934 |
| T3 | 12 | 2019 | T2 | 33 | 1998 |
| T3 | 12 | 2018 | 4 | 31 | 1980 |
| T5 | 12 | 2016 | 5 | 25 | 1970 |
| T6 | 10 | 1978 | T6 | 24 | 2012 |
| T6 | 10 | 1966 | T6 | 24 | 1964 |
| T8 | 9 | 1998 | T6 | 24 | 1954 |
| T8 | 9 | 1980 | T6 | 24 | 1953 |
| 10 | 7 | 2001 | 10 | 23 | 1969* |
| * and previous years | |||||
Number of Consecutive 100+ Days
The chart below shows the records for the number of consecutive days with high temperatures of 100 degrees or higher at Lubbock and Childress:
|
Consecutive 100+ Degree Days |
|||||
| Lubbock | Childress | ||||
| Rank | Number of Days | Year | Rank | Number of Days | Year |
| 1 | 12 | 1980 | 1 | 50* | 2011 |
| 2T | 11 | 2020 | 2 | 32 | 1943 |
| 2T | 11 | 1994 | 3 | 28 | 1980 |
| 4 | 10 | 1924 | 4 | 26 | 1939 |
| 5 | 9 | 2011 | 5 | 24 | 1937 |
| T6 | 8 | 2017 | 6 | 22 | 1954 |
| T6 | 8 | 1990 | 7 | 21 | 1934 |
| T6 | 8 | 1986 | 8 | 20** | 2011 |
| T6 | 8 | 1928 | T8 | 20 | 1978 |
| T10 | 7 | 2011 | T8 | 20 | 1936 |
| T10 | 7 | 2003 | T11 | 19 | 1940 |
| T10 | 7 | 1940 | T11 | 19 | 1934 |
|
* ending 8/10 ** ending 9/3 |
|||||


 Follow us on YouTube