
Severe thunderstorms capable of producing damaging wind gusts, large hail, and a few tornadoes, are likely to develop this afternoon from parts of the lower Ohio Valley into the southern Plains. An Enhanced Risk (Level 3 of 5) outlook has been issued. Further north, widespread rain showers are expected across portions of the Great Lakes and Northeast U.S. Read More >
THE PECOS COUNTY, TEXAS HAIL STORMS OF 10 MAY 2002: A NULL TORNADO EVENT FROM A WARNING DECISION PERSPECTIVE
Todd Lindley
NOAA/NWSFO - Midland/Odessa, Texas
Gregory Morgan
KOSA-TV - Odessa, Texas
ABSTRACT
Recent training provided to forecasters in the National Weather Service emphasizes the importance of maintaining high levels of situational awareness and the resulting benefits to the warning decision making process. With the aid of radar animations and corresponding video clips captured by storm spotters, this paper will examine how several scientific and human factors combined to increase situational awareness, and allowed forecasters to make critical warning decisions regarding severe weather threats during a significant hail event in West Texas.
Published in the Electronic Journal of Operational Meteorology 02 February 2004
1. Introduction
During the afternoon and evening of 10 May 2002 three supercell thunderstorms produced destructive hail across Pecos County, Texas (fig 1). Through the event’s duration (6 hours) frequent observations of potential tornadic activity were inferred from local warning radar imagery, however, only one brief F0 tornado was observed.
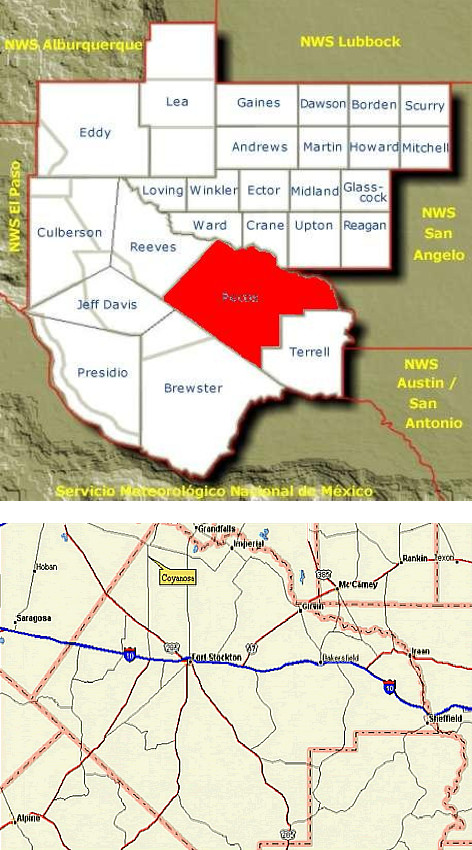
Figure #1...This map depicting NWSFO Midland’s CWA highlights Pecos County. Pecos County is the second largest county in Texas, and comprises approximately ten percent of NWSFO Midland’s CWA. A close-up view of Pecos County is also provided. Highlighted in the north is the rural community of Coyanosa. The county seat, Fort Stockton, is located in the central part of the county on Interstate 20.
The advantages gained through maintaining situational awareness (SA), defined as "the ability to perceive data, comprehend its meaning, and project relevant outcomes" (Endsley 1995), during severe weather warning operations have recently been emphasized in National Weather Service (NWS) training (WDTB 2000-2003). High levels of SA enable forecasters to make enhanced warning decisions.
This paper examines the Pecos County hail storms from a warning decision perspective. Radar animations and corresponding video from storm spotters will be utilized to present four critical warning decisions which were enhanced through factors contributing to high levels of SA.
2. Event Overview and Public Impact
The 10 May 2002 hail storms had a significant economic impact. Despite the sparsely populated nature of the region, monetary losses exceeded three million dollars (NOAA 2002). Most of the damage was agricultural. Coyanosa, a small community in northern Pecos County, received 7.0 cm (baseball) hail during a 40 minute period. Melon, onion, and pecan crops were destroyed.
Property damage also occurred in the city of Fort Stockton. The most significant damage was across the city’s north side, where 11.0 cm (softball) hail was reported. Damage consisted of broken windows, damaged roofs and vinyl siding, and damaged vehicles (fig 2). Similar losses occurred east of the city along Interstate 10.
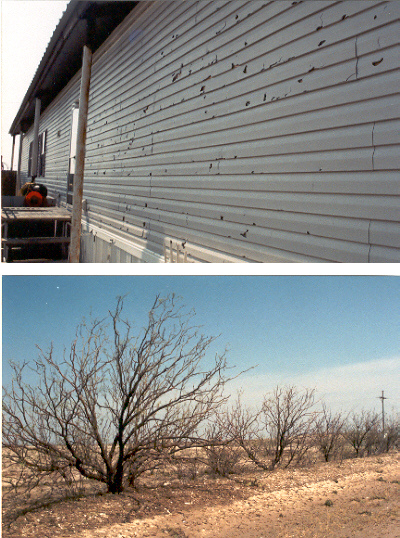
Figure #2...Hail damage was widespread across northern and central Pecos County. The area hardest hit was the north side of Fort Stockton. Numerous structures sustained damage to roofs, windows, and vinyl siding. Vegetation was also stripped with scars on the underlying soil.
3. Pre-Storm Environment
Bunting and Vescio (2002) suggest warning decisions are enhanced through knowledge of the large scale environment. On 10 May 2002, the meso and synoptic scale environments were dominated by a moist and unstable boundary layer over the Southern Plains, and moderate southwest flow aloft. A dryline was situated along the lee of the mountains in eastern New Mexico and West Texas. Surface conditions were uniform across most of West Texas with temperatures ranging from 29°C to 32°C, and dewpoints were generally near 18°C. Southeast surface winds of 10 to 20 kt with higher gusts aided to provide ample deep layer shear for storm organization (fig 3).
The integration of near storm environment (NSE) data is also an important aspect of effective warning decision making (WDM) (Wolf and Grant 2001). The recognition of patterns known to produce specific types of severe weather can heighten forecasters’ awareness, helping them evaluate potential threats thereby making the best possible warning decisions. Analysis of surface observations and LAPS data revealed the complexity of the NSE across Pecos County. Channeled low level flow advected higher theta-e air northwest through the Pecos River Valley. A narrow axis of higher instability resulted across the eastern parts of the county (fig 4). In addition, these locally backed winds combined with veered flow over the higher terrain to the west to produce an area of persistent convergence near the Reeves/Pecos County border, where the three supercells discussed in this paper initiated. Given the proximity of the localized theta-e maximum to the zone of low level convergence, the Pecos County area appeared to be the most favored area across the NWSFO Midland County Warning Area (CWA) for significant severe weather.
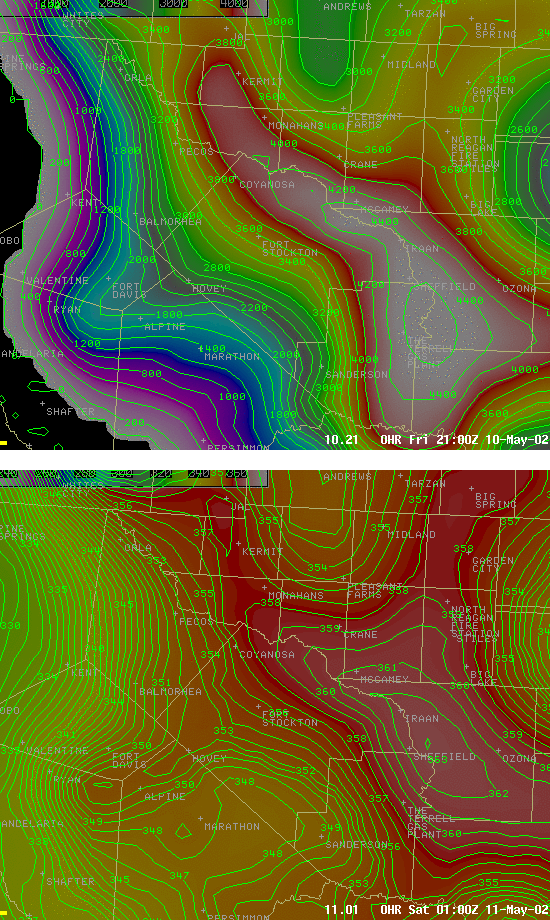
Figure #4...2100 UTC MSAS data from 10 May 2002 depicting the theta-e ridge and associated instability axis along the Pecos River Valley. This data was useful in aiding warning forecasters in diagnosing the severe weather threats across Pecos County.
Recent studies identify multiple low level thermodynamic parameters as important discriminators between tornadic and nontornadic supercell environments (Rasmussen and Blanchard 1998, Edwards and Thompson 2000, Craven et al. 2002, Davies 2002). Lower lifting condensation level heights (LCL’s) and surface dewpoint depressions correspond to increased low level relative humidity and buoyancy, increasing tornado potential (Markowski et al. 2002). In addition, level of free convection height (LFC), convective inhibition (CIN), and 0-3 km CAPE also have significant relevance.
Although forecast soundings were used during the event, the observed 0000 11 May (all times UTC) sounding from Midland is utilized as a proximity sounding in this study (fig 5). Due to the similarity of surface conditions at Fort Stockton and Midland, no modifications to the sounding were performed.
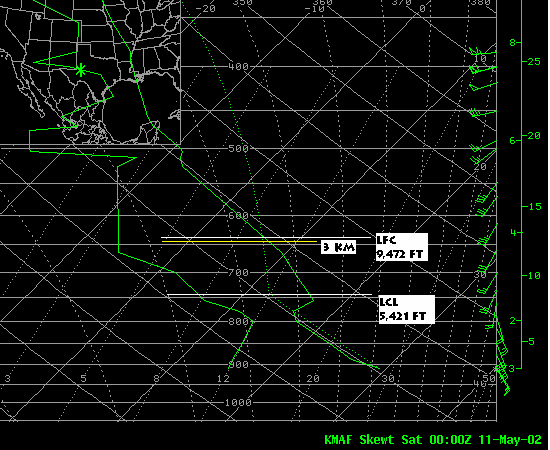
Figure #5...The 11 May 2002 0000 UTC sounding from Midland, Texas. This sounding is a good proximity sounding for the Pecos County NSE. A deep inverted-v type boundary layer is noted with an LCL of 5,421 feet AGL. No positive area is noted in the portion of the sounding below 3 km AGL. Recent studies have shown LCL’s and 0-3 km CAPE to be good discriminators of non-tornadic versus tornadic supercell environments.
Recognizing adequate shear and instability for supercells, forecasters assessed the tornado threat using techniques referenced above. The sounding depicted surface dewpoint depressions of 16°C, along with a LCL height of 1,652 m and a LFC height of 2,887 m. The values of these low level thermodynamic parameters fell in ranges characteristic of non-tornadic supercell environments. Specifically, the LCL height (1,652 m) was in excess of the third quartile for non-tornadic supercells as determined by Edwards and Thompson (2000). Despite the uniformity of surface conditions, no assumptions were made concerning thermodynamic properties above the LCL. The examination of these parameters helped forecasters build a conceptual model of anticipated storm type and threats based on these sounding characteristics. This included high based and nontornadic supercells with large hail and damaging winds the anticipated threats.
Of equal importance to the WDM process is the knowledge of storm scale environmental changes which may alter storm type and threats (Cunningham and Wolf 1998). On this day, forecasters were able to anticipate modifications to the NSE through analysis of MesoEta forecast soundings and LCL heights. The model suggested a trend of decreased LCL’s (-640 m) between 2100 and 0000 (fig 6). This trend signaled a potentially increased risk of isolated weak tornadoes if supercellular convection could be sustained.
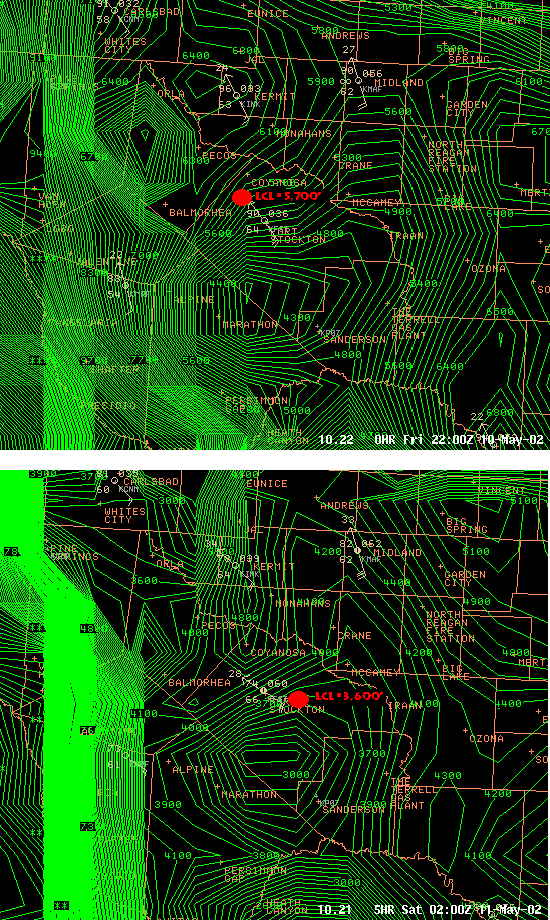
Figure #6...Plots showing the MesoEta forecasted LCL heights over Pecos County at 2100 and 0000 UTC. The red cursor indicates the approximate location of supercellular convection at each time. The model trends depict a significant decrease in LCL heights over the three hour period. This was used an indicator of how the severe weather threat may evolve through the afternoon hours.
4. Sectorization and Summary of Warnings
The consideration of both meteorological and non-meteorological factors comprise WDM methodology (Quoetone and Huckabee 1995). Although staffing is generally a human factors issue (Quoetone and LaDue 2003), decisions regarding the necessary staffing levels are highly dependent on the given meteorological situation. Staffing and sectorization of warning responsibilities are critical aspects of successful warning operations which improve efficiency and warning strategies (Andra et al. 2002).
Based on radar trends and knowledge of the NSE, sectorization of warning operations by both geographical area and threat type was delegated as depicted in figure 7. This strategy was found to be effective, and distributed workloads in a manner which helped optimize SA.
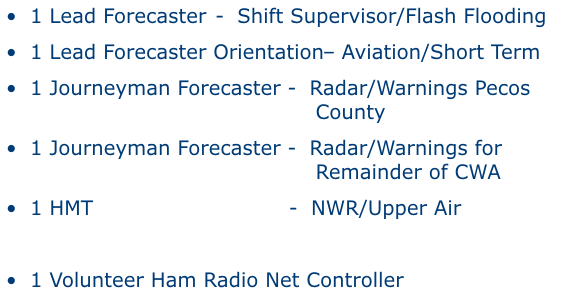
Figure #7...Diagram showing the warning operations staff at NWSFO Midland during the severe weather event on 10 May 2002. Each staff member’s delegated duties are included. Warning operations were sectorized by both geographical area and threat type. Through radar trends and knowledge of the NSE, a single warning forecaster was given responsibility for storms occurring in Pecos County.
A total of nine severe local storm warnings were issued for Pecos County spanning 5 hours and 58 minutes. Warnings and statements also were issued by NWSFO Midland for severe storms elsewhere in the CWA (fig 8). Due to the societal impacts and the remarkably high quality of real-time spotter reports, the emphasis of this paper is restricted to warning decisions regarding the storms in Pecos County. Pecos County warning and statement distribution, along with verifying reports are shown in figure 9.
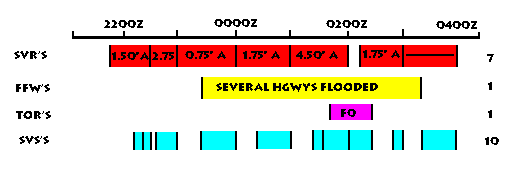
Figure #9...A time line of severe weather warnings and statements issued by NWSFO Midland for Pecos County during the 10 May 2002 event. Verifying reports are included. Concurrent warnings were issued by NWSFO Midland for storms elsewhere in the CWA, and are not included in the time line.
5. Warning Operations
The first of the three supercells (supercell #1) developed near the Reeves/Pecos County border around 2100, and propagated northeast toward Coyanosa (fig 10). Large hail measuring 3.8 cm (ping-pong ball) was first observed at 2150, 6.4 km south of Coyanosa. As the storm approached Coyanosa, an increase in storm intensity was noted in base reflectivity along the southwest flank, thus forward propagation decreased. As a result, observed hail size increased to 7.0 cm (baseball) near Coyanosa, and persisted from 2155 to 2230. With large hail producing the most immediate threat to life and property, observations of supercell #1 supported the forecasters’ conceptual model.
Supercell #2 developed near the same area as supercell #1 around 2210 (fig 11). The storm propagated northeast and eventually merged with supercell #1 near Coyanosa. Supercell #2 presented forecasters with two instances which challenged their conceptual model, leading to critical warning decisions. Golfball size hail (4.4 cm) also was reported with this storm, but despite reflectivity and storm relative motion (SRM) data to the contrary, no tornadoes were observed by storm spotters.
Supercell #3 developed in western Pecos County around 0000 11 May. This storm moved east along and just north of Interstate 10 across central Pecos County through 0400 (fig 12), and challenged warning forecasters with two additional critical warning decisions. Modifications to the NSE throughout the storm’s life span resulted in low level thermodynamics which were becoming increasingly favorable for potential weak tornado development. Despite near continuous radar indications of tornado potential, only one very brief F0 tornado was observed.
a. Critical Warning Decision #1
At 2300, a store manager reported a funnel cloud south of Coyanosa. The report correlated with strong rotational velocities (rotational velocity is used instead of delta-v due to storm distance from the radar) in 0.5° SRM data (2259 scan) (fig 13). As with each of the four instances examined in this study, the lowest elevation sampled by radar was well above the expected LCL heights. In this case, continuous communication was maintained with the store manager and enabled forecasters to confirm the small and high based nature of the funnel.
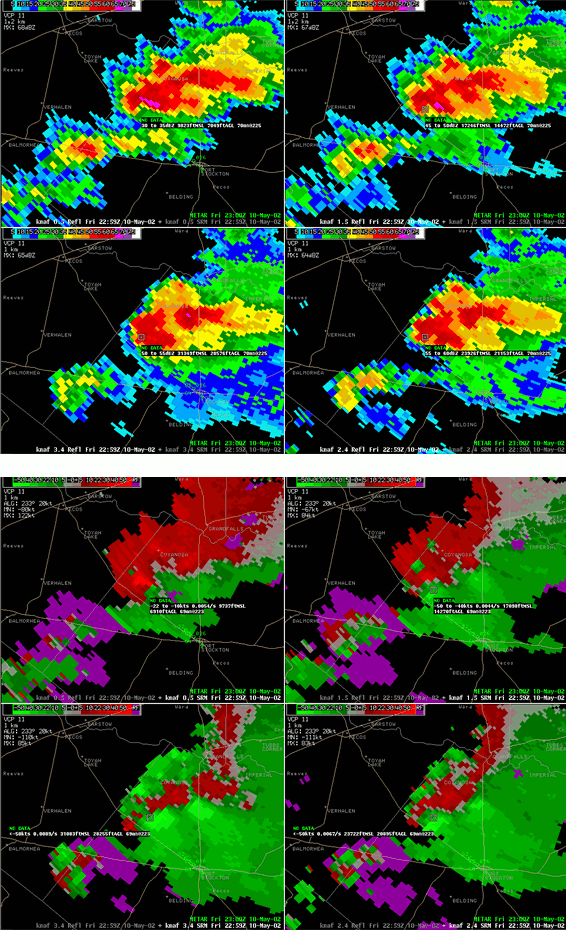
Figure #13...Corresponding radar 4-panels (Z and SRM) of supercell #1 at the time of a funnel cloud report south of Coyanosa. The storm’s reflectivity structure showed a tight gradient in the inflow region, with the SRM data indicating strong cyclonic rotation. Knowledge of the NSE and continuous spotter reports, however, helped warning forecasters to determine the very low likelihood of tornadoes.
| Upper left = 0.5° Z | Upper right = 1.5° Z |
| Lower left = 0.5° SRM | Lower right = 1.5° SRM |
Through knowledge of the pre-storm environment, including the previous discussion on low level thermodynamic parameters, and the manager’s reports that indicated a small and high based funnel cloud, warning forecasters determined the likelihood of tornadoes remained low. As a result the previously issued severe thunderstorm warning (SVR) was not upgraded to a tornado warning (TOR).
b. Critical Warning Decision #2
Between 0000 and 0025 radar imagery of supercell #2 depicted reflectivity geometry which became increasingly suggestive of tornadic activity (fig 14). By 0015 the storm exhibited well defined hook echo and inflow notch structures. The corresponding SRM data depicted moderate but broad rotational velocities.
At that time, a storm spotter (this paper’s second author) was traveling south through the storm’s core on Farm to Market Road 1053 from Imperial to Fort Stockton, and reported 4.4 cm (golfball) hail 30 km north of Fort Stockton at 0018 (fig 15). The spotter soon acquired a view of the updraft region, and relayed to warning forecasters that the storm’s base visually appeared high and somewhat disorganized. If warning decisions were based on radar interpretation only, forecasters would have been inclined and fully justified to issue a TOR. The introduction of reliable spotter reports, and knowledge of the environment, led to no upgrade to the ongoing SVR.
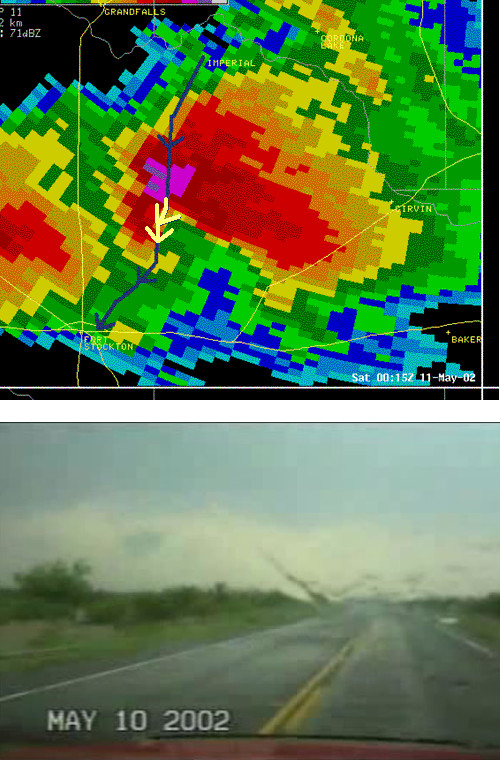
Figure #15...This radar image is overlaid with a map showing the route of a storm spotter (this paper’s second author) who encountered large hail while traveling south on Farm to Market Road 1053. The spotter provided excellent ground-truth information to warning forecasters thoughout the event, and reported that the storm was relatively high based and disorganized. The video (click image to view) shows the spotter punching through the hail core at 0018 UTC, and the view south of the storm’s main updraft base a few minutes later. The highlighted portion of the spotter’s route depicts the location and view of the video.
c. Critical Warning Decision #3
Radar interpretation continued to indicate the potential of tornadoes as supercell #3 approached Fort Stockton between 0050 and 0120 (fig 16). Supercell #3 also displayed multiple three body scatter spikes (TBSS) (Lemon 1994) as it approached the city. The well defined and pronounced nature of the TBSS prompted the issuance of warnings and statements which highlighted the enhanced hail threat. It is likely, based on spotter observations of large hail, that TBSS was present with the previous storms, but was masked by intervening reflectivity echoes. This was not confirmed with the examination of spectrum width data.
Warning forecasters suspected modifications to the NSE were occurring as supercell #3 moved east, close to the theta-e ridge. In addition, the effects of previous storms likely contributed to these modifications on scales not detectable through the use of radar or the area's sparse surface observation network. Forecasters became concerned that the previously developed conceptual model of storm type and threats was becoming compromised as the low level thermodynamics modified. It was believed this modification could slightly increase the threat of weak tornadoes.
The aforementioned spotter obtained a vantage point on the northwest side of Fort Stockton by 0100, and provided continuous ground truth information as the storm approached the city (fig 17). These reports indicated a well defined wall cloud, with slow rotation. The spotter also indicated lower cloud bases relative to the previous storm, but as the storm approached Fort Stockton, a broadening cloud base circulation was observed. Based on the spotter reports, and the relatively broad nature of the rotation detected in SRM data, a TOR was not issued as the mesocyclone passed over the city.
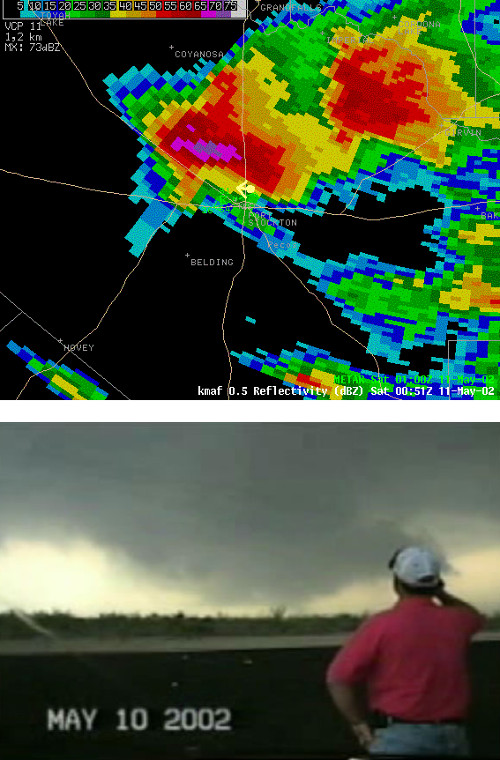
Figure #17...This storm spotter video shows a well developed wall cloud which becomes less organized and broadens as it approaches the northwest side of Fort Stockton around 0100 UTC. Nearly continuous communications with the spotter provided warning meteorologists with critical insight regarding the storm’s behavior as it approached the city. The point and arrow on the provided radar reflectivity image shows the spotter’s location and view along Highway 18 on the north side of the city (click image to see spotter video
d. Critical Warning Decision #4
The spotter provided near continuous information as the storm progressed east of Fort Stockton. At 0141, a funnel cloud was observed just south of Interstate 10. The 0142 SRM data showed the low level circulation had rapidly increased and tightened, with 45 kt of gate-to-gate convergent maximum rotational velocities (fig 18). Based on the spotter report, increasingly favorable signatures in SRM data, and modifications to the NSE, a TOR was issued at 0145.
The 0147 0.5° SRM depicted greater than 45 kt maximum gate-to-gate pure rotational velocities. Inbound velocities greater than 50 kt were observed. The spotter observed a dust whirl beneath a well developed funnel cloud at 0149. The tornado persisted 10 seconds before it dissipated 18 km southeast of Fort Stockton. The following scan depicted a divergent rotation associated with the circulations occlusion, and the immediate tornado threat was decreasing.
6. Conclusion
It is interesting to note that no reports of damaging thunderstorm winds were received during the event or inferred from post storms surveys. With a deep inverted-v boundary layer structure in observed and forecasted soundings, the threat of damaging winds was included in the forecasters’ conceptual model. Lemon (1994) noted that observations of TBSS often correlate with damaging winds and large hail. The authors offer no explanation for the lack of observed severe winds associated with this case. In addition, TBSS-induced contamination may have influenced the apparent mesocyclone strength in a few of the images shown. These contributions, however, were likely weak or slightly negative and the data is considered representative.
Continuous ground truth from storm spotters, knowledge of the pre-storm environment, and sectorized warning operations enabled forecasters to maintain high levels of SA and enhanced the WDM process during the 10 May 2002 hail event in Pecos County, Texas. This SA enabled forecasters to recognize modifications to the NSE prior to the occurrence of a brief tornado, and alter their conceptual model which initially diagnosed the limited tornado potential.
The timeliness, accuracy, and credibility of spotter reports which generally agreed with forecasters’ pre-event conceptual models and knowledge of the NSE allowed greater emphasis to be placed on ground truth information over other data inputs in the integrated WDM process. Continuous communication with reliable storm spotters complimented radar imagery and was essential to the WDM process. In the absence of such high quality spotter reports and observations, radar representation of the storms would have likely superceded the forecasters' confidence in conceptual models of anticipated storm structure and threats. This would have lead to the issuance of multiple TOR's despite a less than conducive NSE for tornado development.
It is believed that population density did not contribute to the lack of observed tornadoes. This conclusion is supported by the lack of tornado reports, despite excellent spotter coverage, and by the confirmation of no resulting damage through post storm surveys conducted by NWS staff and local authorities in both rural areas and the city of Fort Stockton proper.
Acknowledgments:The authors thank Steve Cobb of the NWSFO Lubbock, Jeffrey Cupo, Eric Platt, Greg Jackson, and Pat Vesper all of the NWSFO Midland for providing technical and editorial assistance. The authors also thank Elizabeth Quoetone of the NWS WDTB for her input. Sharon Tarbet also assisted in the editing process.
References:
Andra, D.L., E. M. Quoetone, W. G. Bunting, 2002: Warning decision making: the relative roles of
conceptual models, technology, strategy, and forecaster expertise on May 3rd, 1999.
Wea. Forecasting: Vol. 17, No. 3, pp. 559-566.
Bunting, B., Vescio, M., 2002: Early experience with weather event simulator at WFO Fort Worth.
Technical Attachment SR/SSD 2002-05, 3/2002.
Cunningham, M., Wolf, P., 1998: Storm development in an unfavorable environment. Technical
Attachment SR/SSD 98-12, 4/1998.
Craven, J. P., H. E. Brooks, and J. A. Hart, 2002: Baseline climatology of sounding derived parameters
associated with deep, moist convection. Preprints, 21st Conf. on Severe Local Storms, San Antonio,
TX, Amer. Meteor. Soc., 643-646.
Davies, J., M., 2002: On low-level thermodynamic parameters associated with tornadic and nontornadic
supercells. Preprints, 21st Conf. on Severe Local Storms, San Antonio, TX, Amer. Meteor. Soc., P12.5.
Edwards, R., and R. L. Thompson, 2000: RUC-2 supercell proximity soundings, Part II: An Independent
assessment of supercell forecast parameters. Preprints, 20th Conf. on Severe Local Storms,
Orlando, Amer. Meteor. Soc., 435-438.
Endsley, M.R., 1995: Toward a theory of situational awareness in dynamic systems. Human Factors,
37(1), 32-64.
Lemon, L. R.., 1994: Recognition of the “three-body scatter spike” as a large hail signature. Postprints,
The First WSR-88D Users Conf., Norman, OK, WSR-88D Operational Support Facility, 373-388.
Markowski, P. N., J. M. Straka, E. N. Rasmussen, 2000: Surface thermodynamic characteristics of RFDs
as measured by a mobile mesonet. Preprints, 20th Conf. on Severe Local Storms, Orlando, FL, Amer.
Meteor. Soc., 251-254.
NOAA, 2002: Storm Data. May, Vol. 44, No. 5, National Climatic Data Center, Asheville, NC.
Quoetone, E. M., K. Huckabee, 1995: Anatomy of an effective warning: Event anticipation, data
integration, feature recognition. Preprints, 14th Conf. On Weather Analysis and Forecasting,
Amer. Meteor. Soc., Dallas, TX, 420-425.
Quoetone, E. M., LaDue, J. G., 2003: Learning from history: Warning decision making implications from
significant events. WDTB, Norman, OK, VISITView Presentation.
Rasmussen, E. N., and D. O. Blanchard, 1998: A baseline climatology of sounding-derived supercell
and tornado forecast parameters. Wea. Forecasting, 13, 1148-1164.
WDTB, 2000-2003: Warning Decision Making Workshops I-IV. Boulder, CO.
Wolf, P., Grant, B., N., 2001: Using near-storm environment in the warning decision making process.
Presentation and training notes, DLOC Workshop, NWS/WDTB, Boulder, CO.

