
Severe thunderstorms, excessive rainfall, critical fire weather are all in the outlook today and into this last weekend of April. Very large hail, severe wind gusts, and a couple strong tornadoes will all be possible across the central and southern Plains today. Flash flooding also possible for portions of the Plains and Mississippi Valley. Critical fire weather conditions for Southern High Plains Read More >
SOUTH FLORIDA 1998 GROUNDHOG DAY TORNADO OUTBREAK
Kim O. Brabander
National Weather Service NWFO, Miami, Florida
1. INTRODUCTION
Across south Florida, November through April marks the dry season with average rainfall during this time frame of less than 25 percent of the annual total. Severe weather and even thunderstorms in general are a rarity. On 2 February 1998 an area of severe weather moved through the region including the Florida Keys. It was in the form of severe thunderstorm winds and tornadoes.
A total of four tornadoes was confirmed, two in the Florida Keys and two over the mainland. Within the Miami NWFO county warning area, there were also more than 15 reports of severe wind gusts that were either measured or estimated. Three of these were in excess of 100 mph. Extensive damage to the aviation community occurred when winds were measured at 104 mph at Miami International Airport and one of the tornadoes hit two other airports in Broward County.
2. SYNOPTIC SITUATION
At 1200 UTC 1 February, a 500 mb low began moving out of the southern Rockies with the surface reflection analyzed as a 1006 mb low near Brownsville, Texas (Fig. 1 and 2). The following morning at 1200 UTC, the deepening upper level feature had moved into the extreme western Gulf of Mexico with a frontal wave developing over the southeast Gulf. The surface low along this wave was centered about 200 miles west of Key West and had deepened to approximately 998 mb (Fig. 3 and 4).
During the course of the day, the 500 mb trough continued to deepen and began moving northeast toward the northeast Gulf. As a result, the surface low also continued to strengthen and eventually deepened to a minimum central pressure of 989 mb as it moved into the northeast Gulf the next morning (Fig. 5 and 6). In response to the deepening low, winds increased to gale force during mid-morning of 2 February over south Florida including the Keys. The warm front associated with the aforementioned wave moved northward from the Straits of Florida which advected a warm, extremely unstable tropical airmass into the Keys and the southern peninsula by midday. An area of severe thunderstorms developed in this tropical environment over the southeast Gulf of Mexico and moved into the lower Keys beginning around mid-afternoon continuing to move northeastward into the southeast Florida coast by early evening.
As the 500 mb trough moved to the northeast, the area of severe weather had minimum push to the east with the individual cells propogating rapidly to the northeast. This led to very heavy rainfall amounts in addition to the severe weather with totals of four to in excess of six inches over the metropolitan areas of the southeast mainland peninsula.
3. CHRONOLOGY OF EVENTS
As mentioned above, gale force winds had developed prior to the severe weather as a result of the deepening low pressure. A Lake Wind Advisory was issued in the early morning hours of 2 February which was followed by a Wind Advisory by mid-morning and an hour later was upgraded to a Gale Warning. About 30 minutes later, gale force winds were obtained. One person was killed in the lower Keys when they were crushed between two boats tied to the dock. Several boaters had to be rescued in the lower Keys and at least three large boats ran aground off the southeast Florida coast. Minor beach erosion and tidal flooding also occurred along portions of the Atlantic and Gulf of Mexico coasts of south Florida and in the Keys. Several other weather advisories were also issued during the day including a Coastal Flood Watch, Flood Watch and a Tornado Watch. The first Special Marine Warning was issued as the initial severe thunderstorms began to affect the lower Keys. As these thunderstorms raced to the northeast, the system was still in its deepening stage and thunderstorm intensity and coverage was on the increase. About three and one-half hours later, a thunderstorm that had supercell characteristics formed over the Florida Straits. As illustrated in Figure 7, a very well defined hook echo was evident from the Key West WSR-88D (KBYX). Even though the cell was still over water and was within a Special Marine Warning, a tornado warning was issued for the lower and middle Keys. As the storm moved to the north-northeast, it weakened considerably and the hook echo signature had disappeared. However, KBYX was still alarming with a TVS and an F1 tornado crossed Grassy Key at 2352 UTC causing moderate damage.
The severe weather began moving into the southeast Florida coastal region after 2300 UTC and the first Severe Thunderstorm Warning was issued for Broward County at that time.
As the area of severe weather continued to move east and northeast, several more Severe Thunderstorm Warnings were issued for most of extreme south Florida. At the same time, the severe storms were still affecting the Keys and warnings were continuing there as well.
At 0104 UTC, Miami WSR-88D (KAMX) indicated that the area of severe thunderstorm cells was beginning to form a bow echo. By 0124 UTC, a well defined bow echo was moving through the northern Miami-Dade and southern Broward County metropolitan areas with destructive winds and tornadoes (Fig 8). The first tornado touchdown was on the north edge of Miami International Airport and the ASOS there measured a wind gust of 104 mph. The tornado intensified to an F2 as it tracked to the north-northeast and moved across Opa Locka Airport. The tornado then moved into Broward County and moved across North Perry Airport in Pembroke Pines. At these three airports, 235 aircraft were either destroyed or damaged with severe damage also occurring in the residential areas and business districts.
4. DISCUSSION
The MRF model run from 0000 UTC 29 January 1998 began showing a strong shortwave deepening as it moved into the Gulf of Mexico. The Miami WFO indicated the chance of thunderstorms in the extended forecast at 6 p.m. local time 29 January and the following afternoon briefly mentioned again the threat for thunderstorms in the State Forecast Discussion. The short term models (ETA, NGM, and AVN) all began to forecast a monster low to develop west of south Florida and then move northeast ushering in abundant moisture and extremely unstable air. The tornadoes and severe thunderstorm wind gusts across southeast Florida and the Florida Keys were among the most severe ever recorded outside of a tropical system. Of the three wind gusts in excess of 100 mph, Long Key C-MAN instrument measured a gust to 119 mph. Other wind gusts in the lower to middle Keys ranged from 70 to 97 mph. Between these destructive wind gusts and the F1 tornado that crossed through Grassy Key, the lower to middle Keys were without power until late the following day. In Miami-Dade County, the tornadoes were the most intense since December 1973 and the costliest ever recorded in a tornadic event. There were four confirmed tornado paths in south Florida. However, the tornado that occurred in Miami-Dade County and then moved north into Broward County caused such an erratic damage path, that it was likely being produced by four individual tornadoes occurring simultaneously along a portion of the path making a total of seven tornado touchdowns.
In lieu of the fact that south Florida does not experience very much rainfall or thunderstorms during the winter months, the models handled the situation very well and watches were issued well in advance of the severe weather. Also, the winter of 1997-98 was in the middle of a very strong El Niño and it is customary during these events that Florida experiences wetter than normal winters. However, the magnitude of this situation will no doubt go unmatched for quite some time. In total, 24 warnings were issued with 20 of them verifying and the average lead time was 28 minutes.
5. REFERENCES - Available upon request.
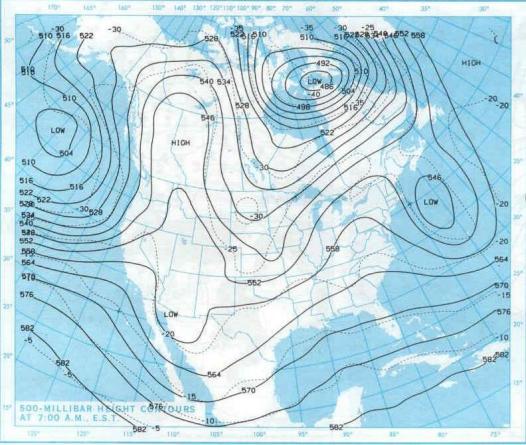
Fig. 1. ABOVE Analyzed 500 mb pattern at 1200 UTC 1 February 1998.

Fig. 2. ABOVE Analyzed surface chart at 1200 UTC 1 February 1998.

Fig. 3. ABOBE Analyzed 500 mb pattern at 1200 UTC 2 February 1998.
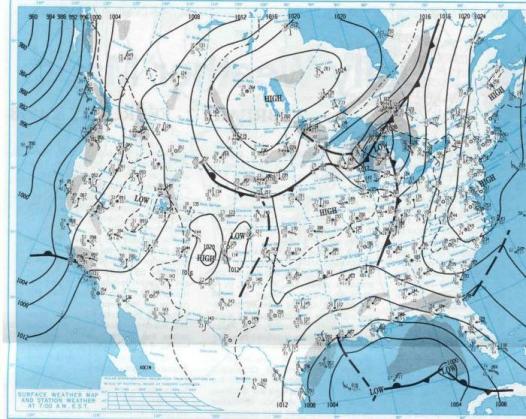
Fig. 4. ABOVE Analyzed surface chart at 1200 UTC 2 February 1998.
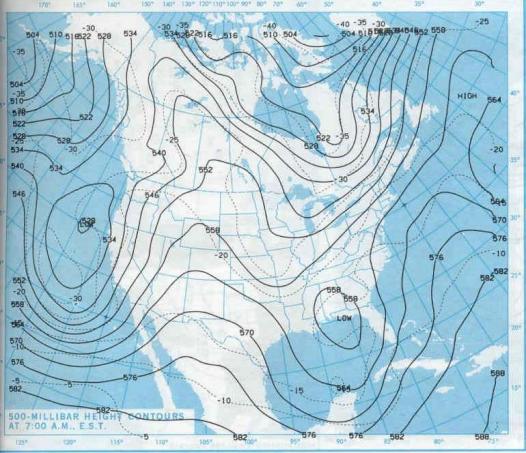
Fig. 5. ABOVE Analyzed 500 mb pattern at 1200 UTC 3 February 1998.
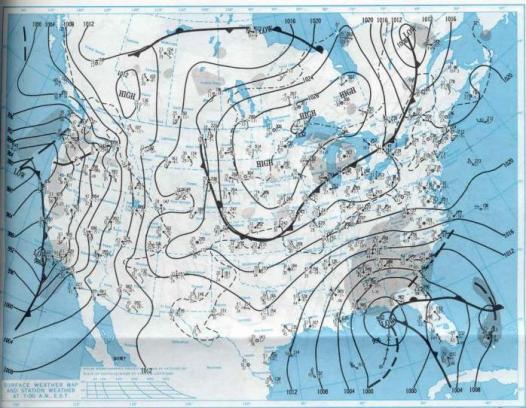
Fig. 6. ABOVE Analyzed surface chart at 1200 UTC 3 February 1998.

Fig. 7. KBYX WSR-88D reflectivity image at 2301 UTC February 2.
Fig. 8. KAMX WSR-88D reflectivity image at 0124 UTC February 2.


 Follow us on YouTube