La Niña: Risk of Weather Extremes 
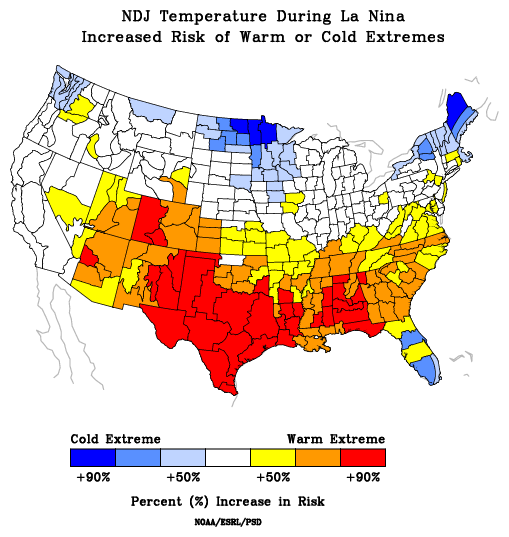
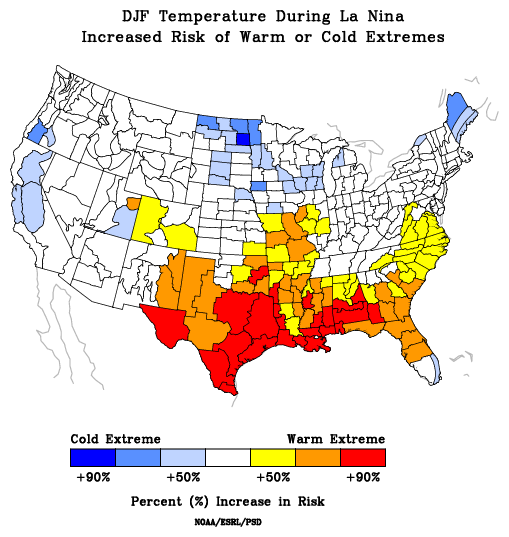
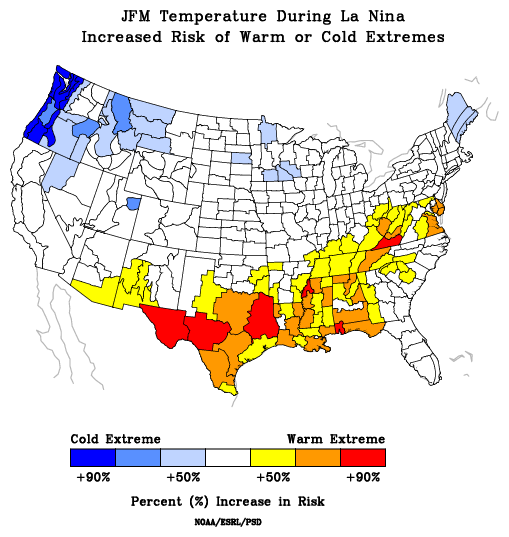
The images below depict the odds of extreme wet/dry or warm/cold fall-spring months associated with historical La Niña episodes since 1950. Extreme weather is defined as being in the highest or lowest 20% of the 100 year record. The climatological average risk of extreme weather any given season is 20%. These composites are not intended to be a forecast of expected conditions. Rather, they use historical data to highlight locations where ENSO can potentially impact temperature and precipitation.
La Niña: Risk of Temperature Extremes
 |
 |
 |
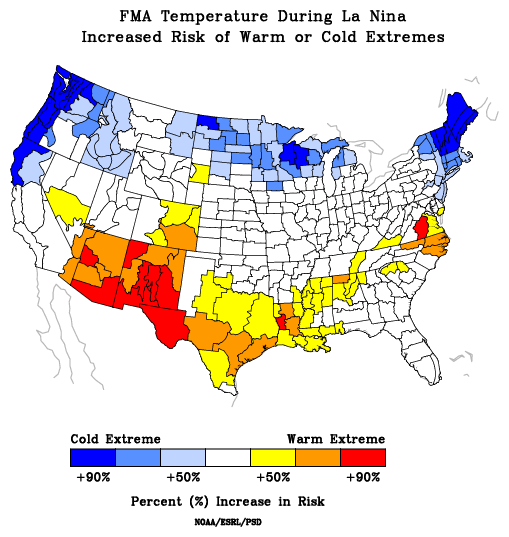 |
| November - January | December - February | January - March | February - April |
The above images depict the odds of extreme warm or cold fall-spring months associated with past La Niña's since 1950. Warm colors indicate an increased risk of warm temperature extremes, while cool colors indicate an increased risk of cold temperature extremes. Click images to enlarge.
Images courtesy of NOAA's Earth System Research Laboratory.
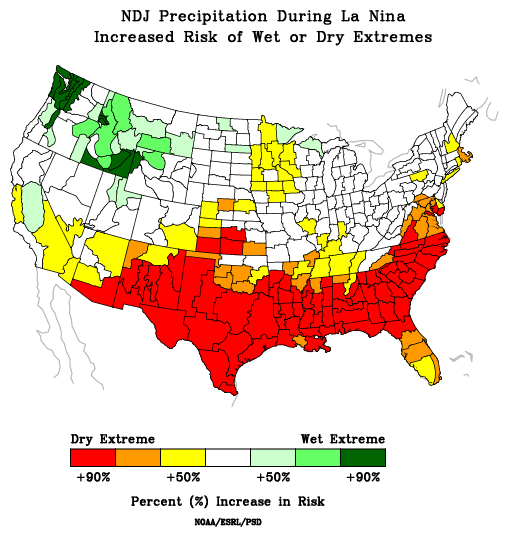
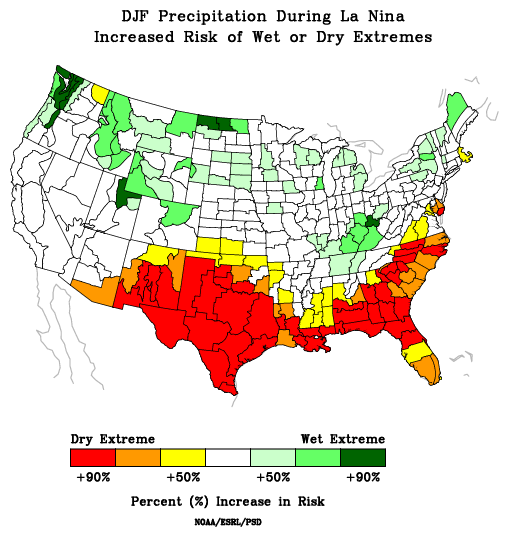
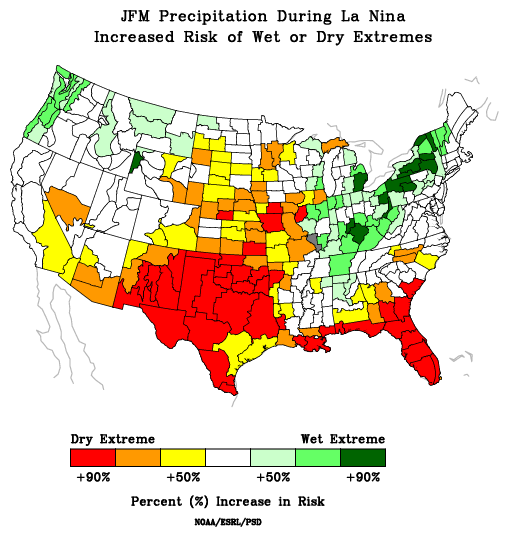
La Niña: Risk of Precipitation Extremes
 |
 |
 |
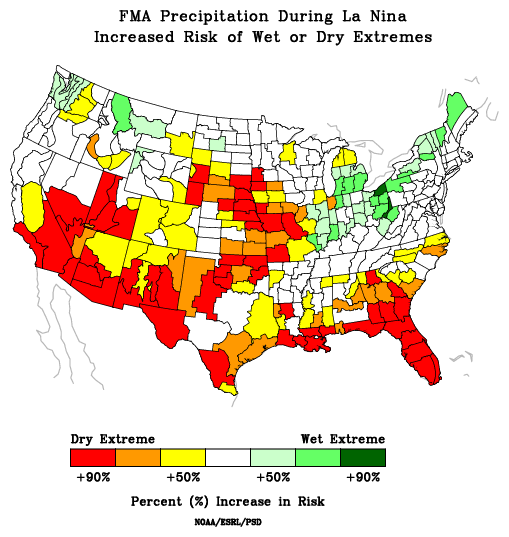 |
| November - January | December - February | January - March | February - April |
The above images depict the odds of extreme wet or dry fall-spring months associated with past La Niña's since 1950. Warm colors indicate an increased risk of dry precipitation extremes, while green colors indicate an increased risk of wet precipitation extremes. Click images to enlarge.


.png) Surf Forecast/Rip Currents
Surf Forecast/Rip Currents Map View
 Weather Hazard Briefing (when applicable)
 Forecaster Discussion
 Marine
 Text Products
.png) Skywarn
Skywarn Submit Storm Reports
 Coastal Flood
 Follow us on YouTube