November 2018 Graphical Climate Summaries
Mobile Alabama and Pensacola Florida Area
Joe Maniscalco - Meteorologist/Forecaster/Climate Program Lead
National Weather Service Mobile Alabama
December 4, 2018
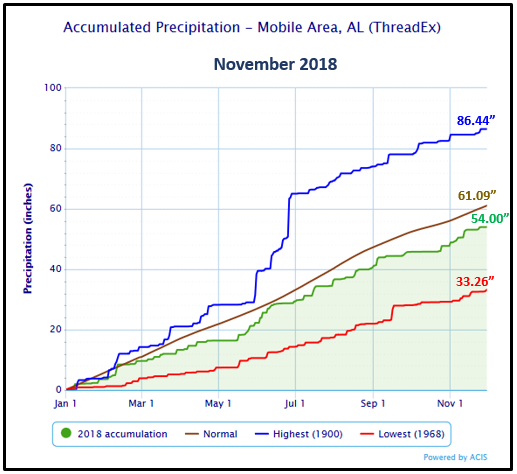
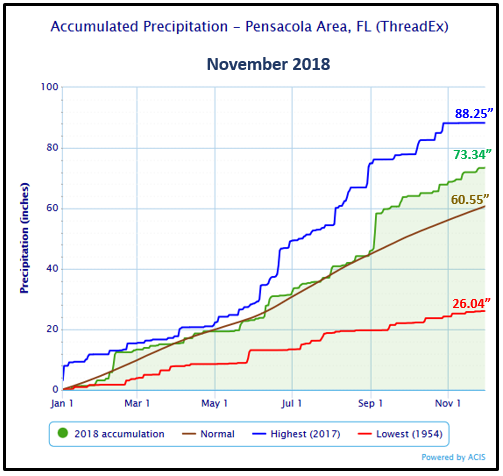
November 2018 in Review - A series of strong cold frontal passages throughout the month resulted in temperature curves resembling a roller coaster about the climatic means at both Mobile and Pensacola. Unlike October, November trended cooler than average by a few degrees. Only one record temperature was reached at both Mobile and Pensacola. Significant annual rainfall deficits continued at Mobile, lagging well behind the Pensacola area which has topped over 73 inches of rain thus far for the year, through November.
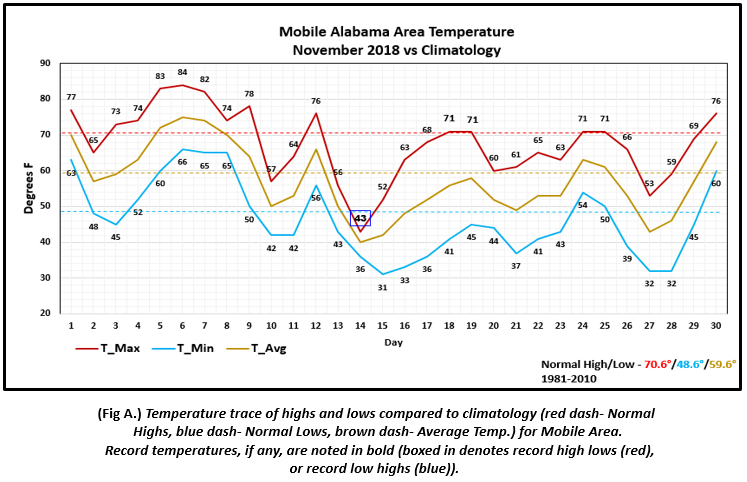
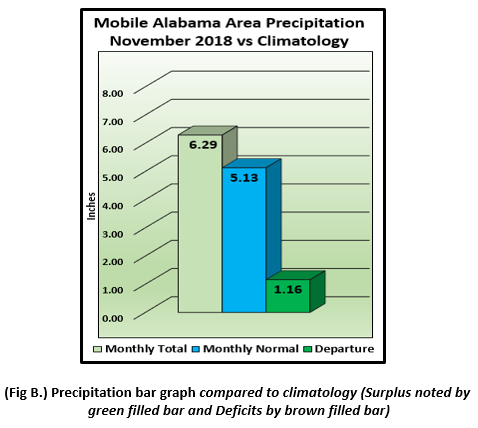
Mobile Alabama Area - The average monthly high was 67.5° or 3.1° below normal. The average monthly low was 46.5° or 2.1° below normal. The average monthly temperature was 57.0° or 2.6° below normal. A record low high temperature of 43° occurred on the 14th. This broke the old record of 47° occurring back in 1976. (Fig. A) shows how temperatures compared to the seasonal normal monthly highs and lows, which are shown by the colored dashed lines. November rainfall measured 6.29" or 1.16" above normal (Fig. B). Annual rainfall stands at 54.00" or 7.09" below normal.
Click on the Mobile Alabama area climate graphics below to expand:
|
|
Against Climatology |
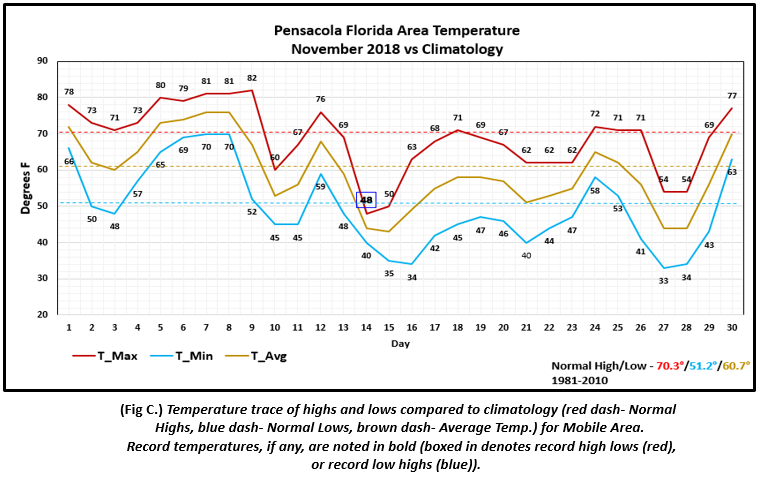
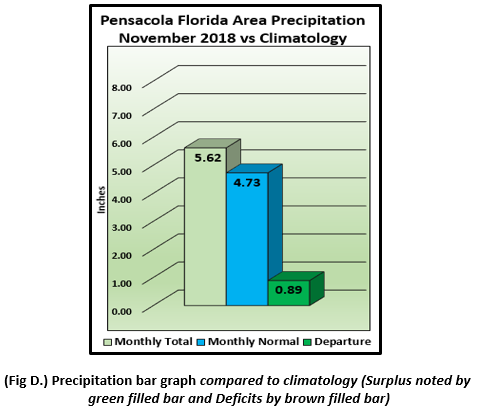
Pensacola Florida Area - The average monthly high was 68.7° or 1.6° below normal. The average monthly low was 49.6° or 1.6° below normal. The average monthly temperature was 59.2° or 1.5° below normal. A record low high temperature of 48° occurred on the 14th. This broke the old record of 51° occurring back in 1940.(Fig. C) shows how temperatures compared to the seasonal normal monthly highs and lows, which are shown by the colored dashed lines. November rainfall measured 5.62" or 0.89" above normal (Fig. B). Annual rainfall now stands at 73.34" or 12.79" above normal.
Click on the Pensacola Florida area climate graphics below to expand:
|
|
Against Climatology |
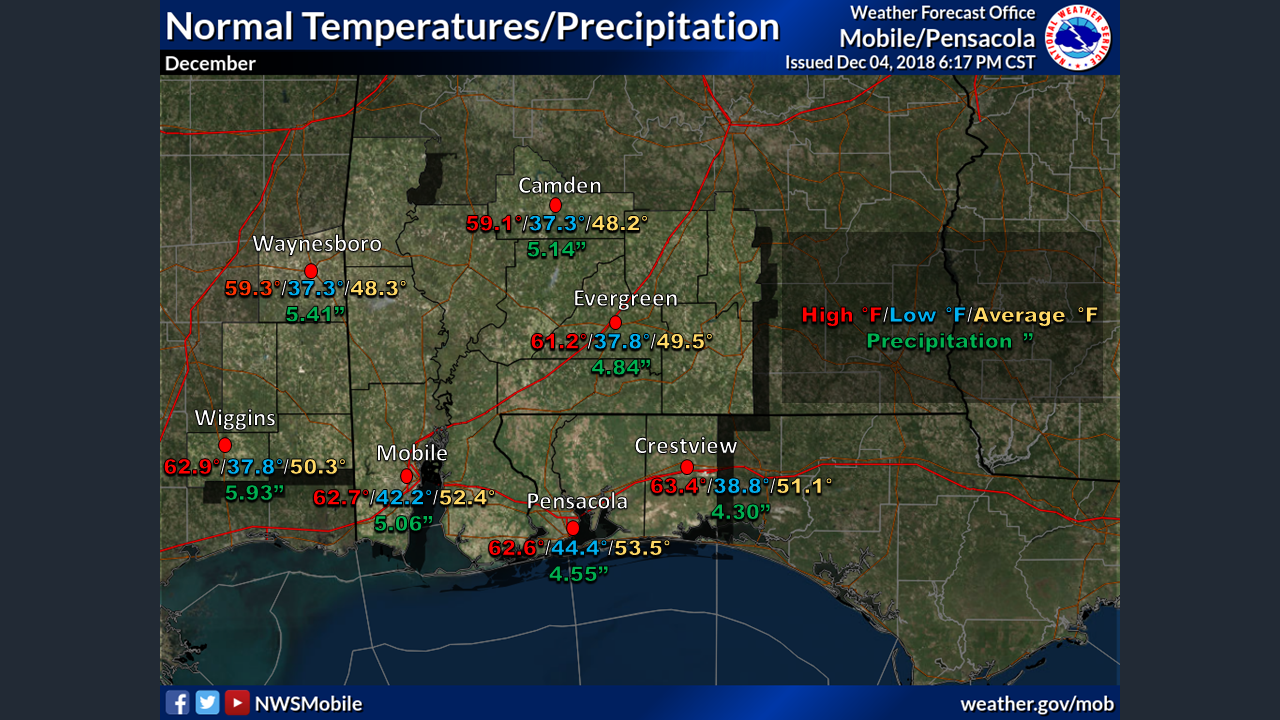
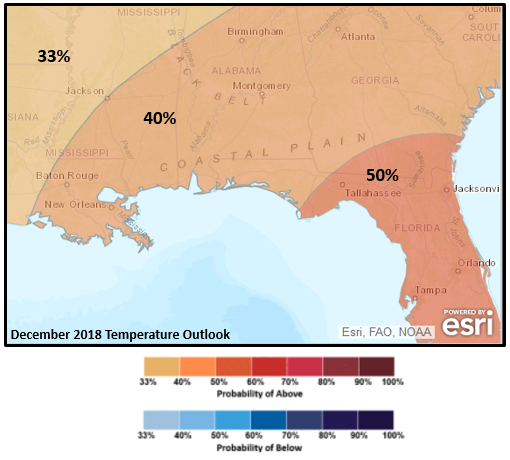
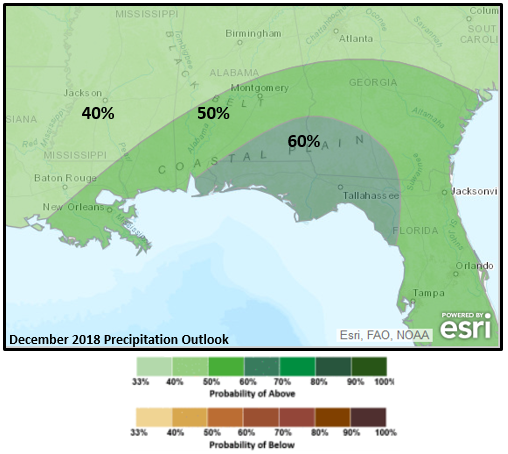
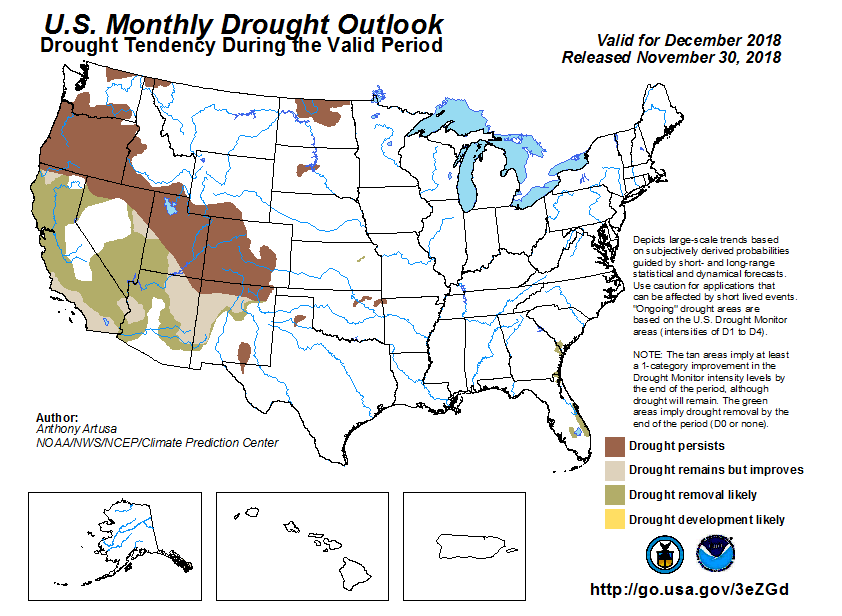
December Climatology and Outlooks:
Click on the snap shots below to expand:
|
Outlook |
Outlook |
Outlook |
Information |
Climate Prediction Center's Interactive Long Range Outlooks
Additional Climate Links:
The links below are intended to provide additional climate information, education and outlooks. The National Weather Service Mobile Alabama's Climate and Past Weather page provides climate data at your fingertips for many observation points in the local forecast area by accessing the NOWData tab as well as many other climate resources. The Climate Prediction Center Link provides short and longer range climatic outlooks and education about the larger scale global circulations that impact temperatures and weather. With the large agriculture and farming presence along the central Gulf coast, the Drought Monitor link provides updates on drought trends and impacts. Another very helpful resource is the Community Collaborative Rain Hail and Snow (CoCoRaHS) network, which is a large group of volunteers working together to measure and map precipitation (rain, hail and snow). The aim of CoCoRaHS is to provide the highest quality data for natural resource, education and research applications. You can be a part of the CoCoRaHS team by becoming a volunteer rainfall observer. To learn more click on the CoCoRaHS link below.
National Weather Service Mobile AL Climate and Past Weather
Climate Prediction Center (CPC)
CoCoRaHS Network Water Year Summaries
Questions or Comments:
Contact: Joe Maniscalco, WFO Mobile, AL at joe.maniscalco@noaa.gov


 Follow us on YouTube