Overview
Two rounds of severe weather impacted Southern Minnesota and the Twin Cities the afternoon of August 18 and then again early morning on the 19th. The first began as a supercell thunderstorm in SW Minnesota which tracked along the US 14 corridor and eventually formed into a linear storm complex in SE Minnesota before continuing NW Iowa and SW Wisconsin. The second round formed as a cluster of thunderstorms in eastern SD late Tuesday night and raced northeast across Minnesota, impacting the Twin Cities in the early morning hours Wednesday. Widespread wind damage was reported with both events, with numerous reports of trees down and measured wind gusts of 69 mph 5 miles SSE of Searles in Brown County & 59 mph 2 miles WSW of Waseca in Waseca County. Additionally, a brief tornado occurred and uprooted trees in Hollandale in Freeborn County.Radar:
Radar images from Thursday afternoon, August 18th
Radar reflectivity and velocity are paired together to show both the storm structure, and also the radar-relative winds within the storm. It is very important to look at the velocity products in radar when diagnosing the potential for strong winds.
| The loop above shows 90 minutes or radar reflectivity (left) and radar velocity (right) starting at 3:30 PM and ending at 5:00 PM CDT. Over that time the storm moves from Mankato to northeast of Albert Lea. Notice in the reflectivity how the storm "bows out" into a backwards "C-shape" which is a sign of strong winds. These strong winds can be seen in the velocity by the tan/white colors which indicate speeds of 75 to 85 mph at around 6000 ft above the ground. | This 10 minute loop shows radar reflectivity (left) and radar velocity (right) as the storm moved over Hollandale MN. Notice the slight appendage on reflectivity that coincided with a weak circulation on the velocity. A weak EF0 tornado was confirmed just west of Hollandale. |
Radar images from Friday morning, August 19th
| The loop above shows 80 minutes or radar reflectivity (left) and radar velocity (right) starting at 1:20 AM and ending at 2:40 AM CDT. Notice the enhanced area of wind indicated by the blue colors that develops near Glencoe. This is the area that had the worst damage from the second round of storms. | This 10 minute loop shows radar reflectivity (left) and radar velocity (right) as the storm moved over Glencoe MN. Wind speeds in excess of 90 mph were measured at 1350 ft above the ground, but the strongest winds measured at the airport were only 47 mph. |
Reports & Photos:
 |
 |
 |
 |
| Storm reports from August 18 and 19, 2016. Additional information can be found below at the: Storm Prediction Center |
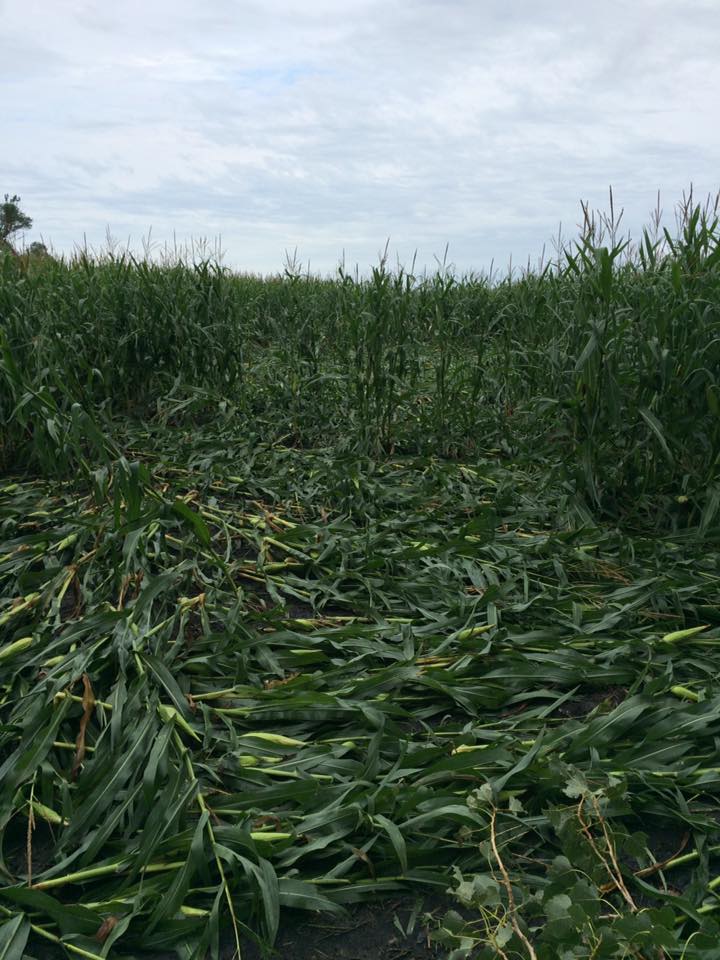
Corn blown down showing convergent wind patterns typical of a tornado in Hollandale, MN. Photo credit: Chris Kuball |
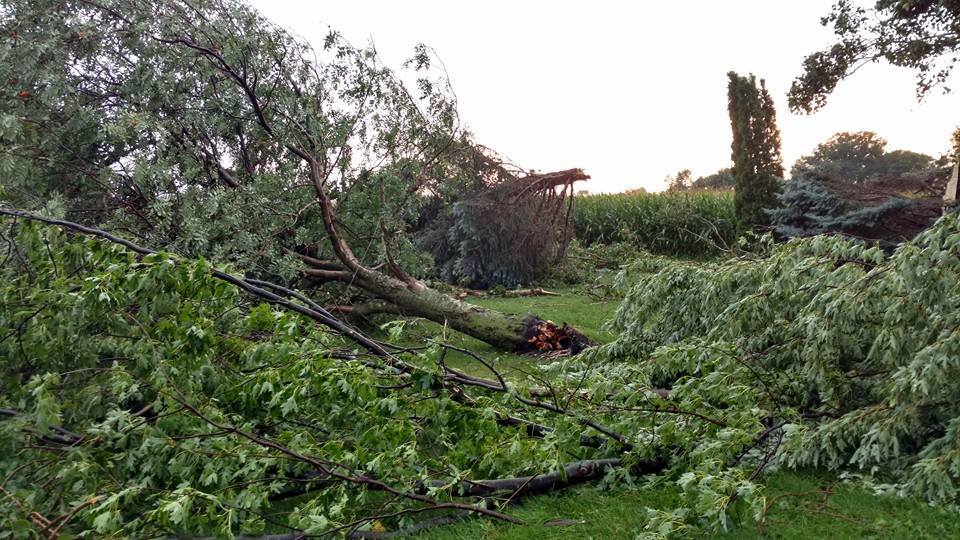
Trees uprooted from a brief tornado in Hollandale, MN. Photo credit: Angela O'Connell |
Storm damage near St Michael MN with the second round of storms that moved through early Friday morning. Photo credit: Todd Nelson |
Environment
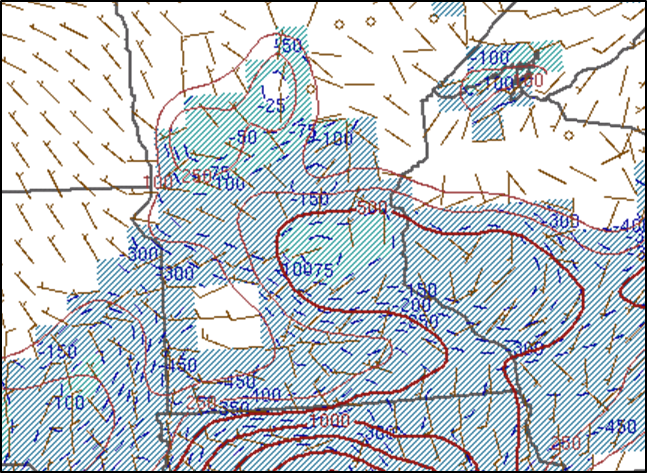
A warm front draped across southern Minnesota provided the forcing mechanism for storms to initiate and track southeast along it during Thursday afternoon and evening. This warm front lifted northward again Thursday night and was the focus for the second round of storms early Friday morning. An extremely unstable atmosphere was present south of the front with Most Unstable CAPE values of 3000-4000 J/kg across southern Minnesota during the afternoon and over 5000 J/kg Thursday night where the second round of storms initiated. Deep layer wind shear was on the order of 30-40 knots, more than sufficient for severe storms to remain organized and long-lasting.
.png) |
 |
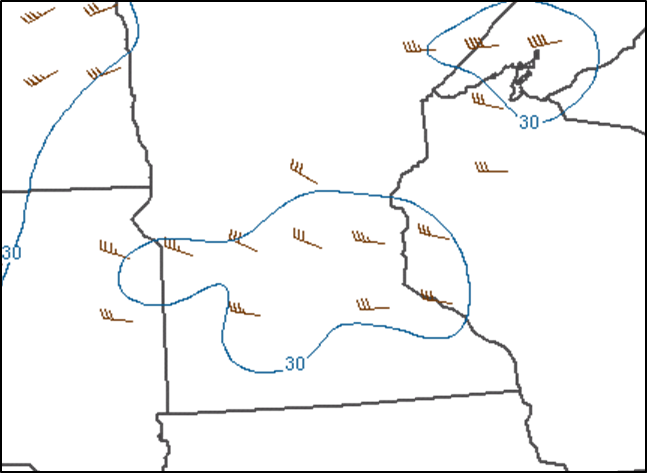 |
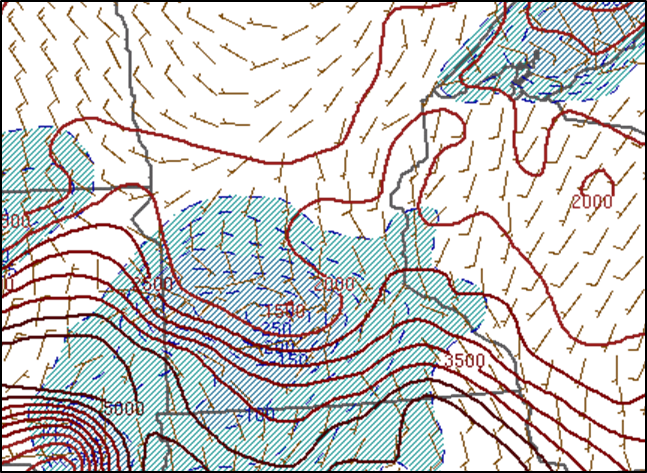
| Figure 1: Surface map at 3:00 PM CDT August 18. Notice the warm front lifting north across southern Minnesota. | Figure 2: Plot of Surface-Based CAPE showing plenty of instability across the region at 3:00 PM CDT August 18. | Figure 3: Plot of 0-6 km Shear showing around 30 kts of deep layer shear at 3:00 PM CDT which is sufficient for organized convection. |
.png) |
 |
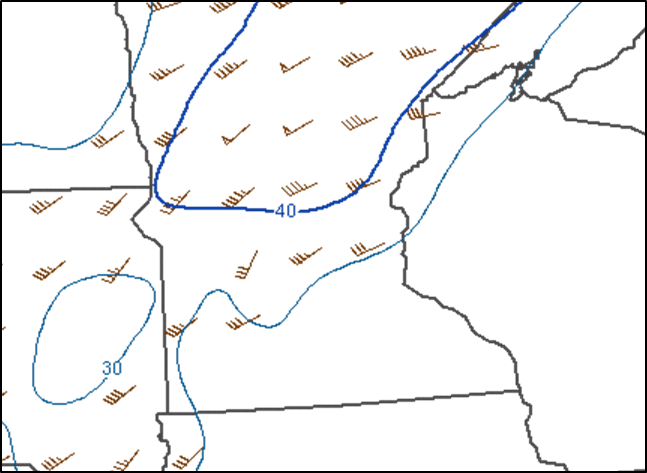 |
| Figure 4: Surface map at 2:00 AM CDT August 19. Notice the warm front lifting lingering across southern Minnesota. | Figure 5: Plot of Surface-Based CAPE showing limited instability across the region at 2:00 AM CDT August 19. | Figure 6: Plot of 0-6 km Shear showing around 30 to 40 kts of deep layer shear at 2:00 AM CDT August 19 which is sufficient for organized convection. |
 |
Media use of NWS Web News Stories is encouraged! Please acknowledge the NWS as the source of any news information accessed from this site. |
|


 Follow us on YouTube