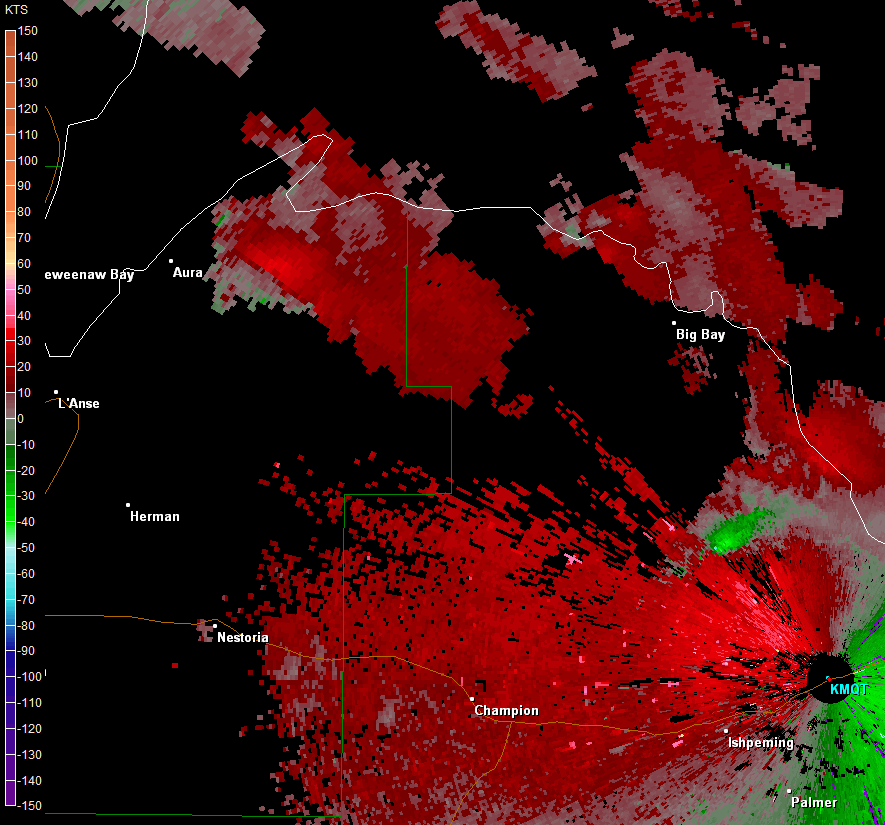
The image loop below shows the radar reflectivity of the Supercell that travelled across northern Baraga and northern Marquette counties on June 8th, 2012. This storm produced 1” hail over Skanee just before the loop started. The storm developed along a surface trough located across northern Upper Michigan and tracked to the east-southeast. The main item to note on the loop is the hook like shape to the storm as it moved into Marquette County. Note: Click on the images for a larger version.

The next loop shows the storm relative velocity. The colors on the radar shows where the winds are coming towards the radar (green) and going away from the radar (red). There are two distinct periods where there was a strong rotational couplet seen on radar. A rotational couplet is where there are bright green colors right next to bright red/pink colors.
A good example of this can be seen in the image below, taken at 8:29pm on June 8th. Looking at the upper right image, you can see bright green colors indicating storm relative winds coming towards the radar at 42 knots (48 mph). The brighter red/pink colors indicate the storm relative winds going away from the radar at 44 knots (51 mph). This rotational couplet is an indication of strong rotation within the storm and was indicated on several radar scans above this one, which was about 1200 feet above the radar.
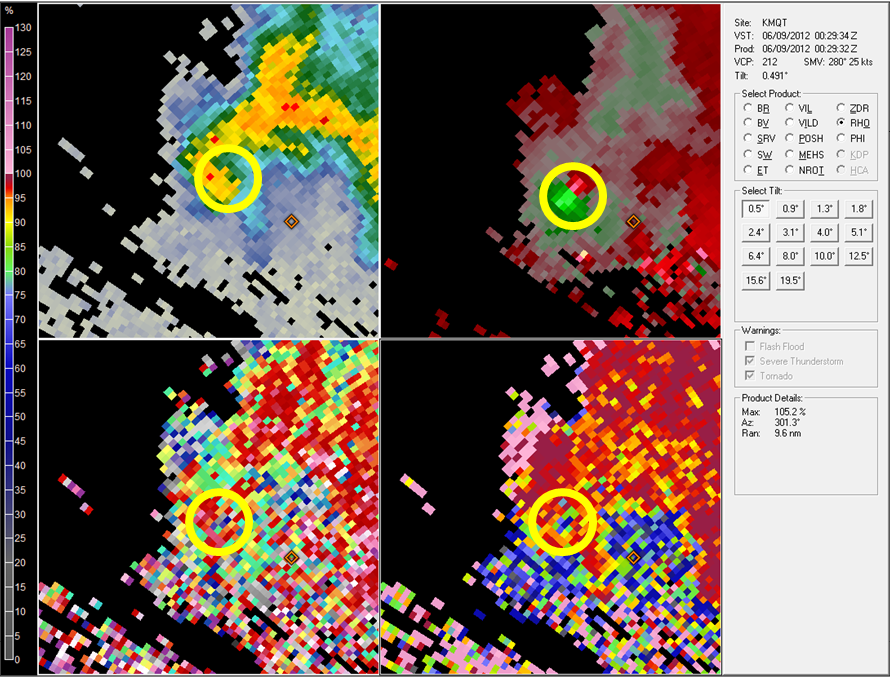
Another indication of a tornado with this storm can be seen with our new upgrade to dual polarization data. In the image above, two of our new data products can be seen: Differential Reflectivity or ZDR (lower left) and Correlation Coefficient or CC (lower right). Correlation Coefficient helps us determine if the radar echoes are all of the same type or a mixture of precipitation. It also can indicate if there are non-precipitation types within the radar echoes, which is what occurred in this case. The area circled in the lower right shows a location where there is a lot lower CC values (blue) than the surrounding area (orange/red/purple). When accompanied by a rotational couplet and higher reflectivity values, this can be a strong indicator of tornadic debris.
After our Storm Survey Team surveyed the damage area, it was determined that the damage that occurred over northwestern Marquette County was the result of a tornado. The tornado was rated as an EF-1 tornado on the Enhanced Fujita Scale as the maximum wind speed was estimated to be around 95 mph. The storm track was estimated to be 7.8 miles long and a maximum path width around 200 yards. The path can be seen in the Google Earth images below. The first image shows the track in relation to much of Marquette county. The second pictures is zoomed in on the track and indicates some locations where damage was evident. The rightmost yellow marker corresponds to tree damage seen in the first four pictures below.
|
|

Depiction of the estimated torndado track using imagery from Google Earth.
Fortunately, the tornado remained mainly over rural areas, which limited the damage to mostly trees as opposed to structural damage. Numerous trees were snapped or uprooted, as shown in the pictures, causing some of the backroads in the area to become impassible. Also shown in the pictures below is an aged structure that was damaged due to a tree falling onto it. Feel free to click on the images to enlarge them.
 |
 |
 |


 Follow us on YouTube