NWSO Morristown, Tennessee Severe Weather Climatology
by
David Hotz and Joanne Labounty
1. Introduction
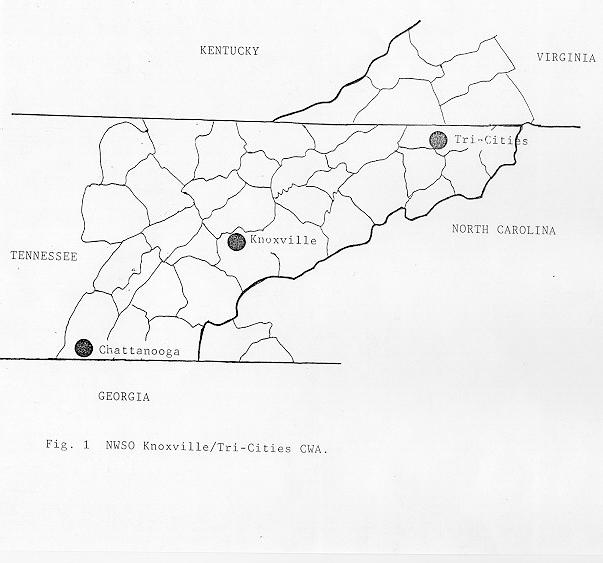
- As a result of the modernization of the National Weather Service (NWS), most of the County Warning Areas (CWA) of Weather Service Offices (WSOs) Chattanooga, Knoxville, and Tri-Cities were transferred to the new Nexrad Weather Service Office (NWSO) Knoxville/Tri-Cities, located at Morristown, Tennessee. The new CWA covers 39 counties from Southwest Virginia to Southeast Tennessee (Fig. 1). Since the NWSO at Morristown may receive additional CWA responsibilities across northwest Georgia by late 1997 or 1998, we have included these counties within our study. Further references will simply be to "the CWA."
- Since the sensitivity of the NWS to severe weather is correlated well to the radar system available to NWS personnel, a brief summary of the Weather Service Radars (WSR) in use prior to the WSR-88D will be discussed. The WSO at Tri-Cities used the WSR-57, which was a network radar, and the WSO at Chattanooga used the WSR-74C, which was a local warning radar. The WSO at Knoxville did not have a NWS radar locally, but utilized the RADID system to dial into the surrounding radars.
- According to NWS policy, a severe thunderstorm is defined as the occurrence of one or more of the following weather phenomena: Tornado, hail greater than or equal to 3/4 inch in diameter, and convective wind gusts equal to or greater than 50 knots or convective wind damage. This paper will look at the occurrences of each severe weather event both spatially and temporally. The purpose of this paper is to acquaint new forecasters with the severe weather climatology of the CWA, and to provide a basis for additional severe weather studies at the NWSO Knoxville/Tri-Cities, Tennessee.
2. Data
- Most of the data were obtained from the Storm Prediction Center's (SPC) tornado, hail, and wind damage database, which can be found under SPC's homepage (http://www.spc.noaa.gov/). The tornado database dates back to 1950 while the hail and wind database dates back to 1955. A local program was developed to quickly screen the database to determine the severe weather climatology. Since the 1996 data were not included in SPC's database, the Storm Data publication from the National Climatic Data Center (NCDC) was used to fill in this year (NOAA 1996).
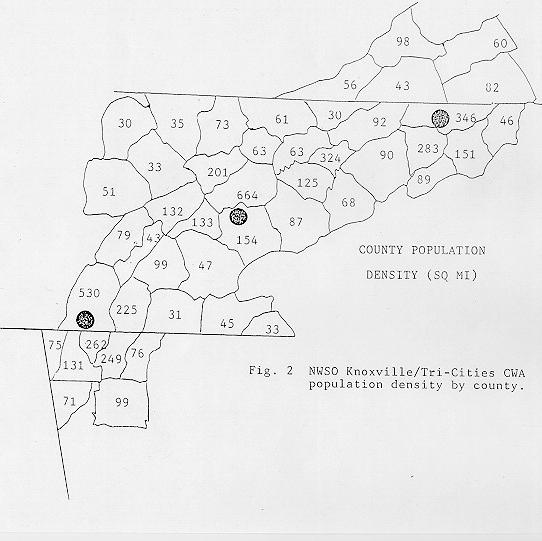
- A number of tornado climatology studies have pointed out that one of the major limitations in producing a severe weather climatology is a bias from population density. To provide the reader with a better sense of the population across the CWA, a map of it's population density has been provided (Fig. 2). Other biases come from weather sensitivity of the media and the general public, as well as increased efforts from the NWS, local emergency management officials, and spotter groups to seek out severe weather reports. Studies by Ostby (1993) have suggested that a more reliable climatology study may be found by focusing on the most severe events, such as those with F2 tornado intensities or higher.
3. Topography
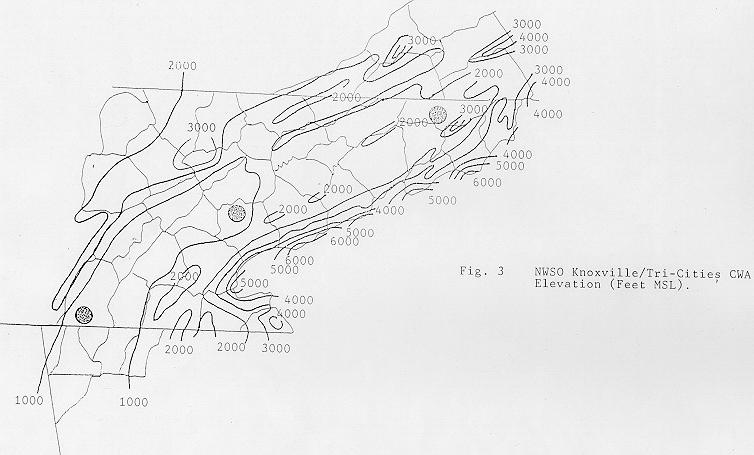
- The topography of the CWA varies greatly and has a major impact on thunderstorm development and corresponding severe weather climatology. Mountainous terrain exists across the eastern most counties of the CWA, with several mountain peaks in excess of 6,000 feet MSL (Fig. 3). Just west of the mountains lies the Great Tennessee Valley, which runs from northwest Georgia northeast to northeast Tennessee. The elevation of this valley ranges from 800 - 1000 feet across southeast Tennessee and northwest Georgia to 1500 - 2000 feet across northeast Tennessee. Numerous ridges can be found in the valley with elevations up to 2500 feet. The main population centers of the CWA, including Chattanooga, Knoxville, and Tri-Cities, are located in the Great Tennessee Valley.
- Over the northwest section of the CWA lies the northern Cumberland Plateau, where the elevation rises from the valley floor to 3,500 feet. The terrain across Southwest Virginia is quite mountainous and has peaks over 4000 feet and valleys around 2000 feet.
4. Tornado Climatology
- a) yearly frequency
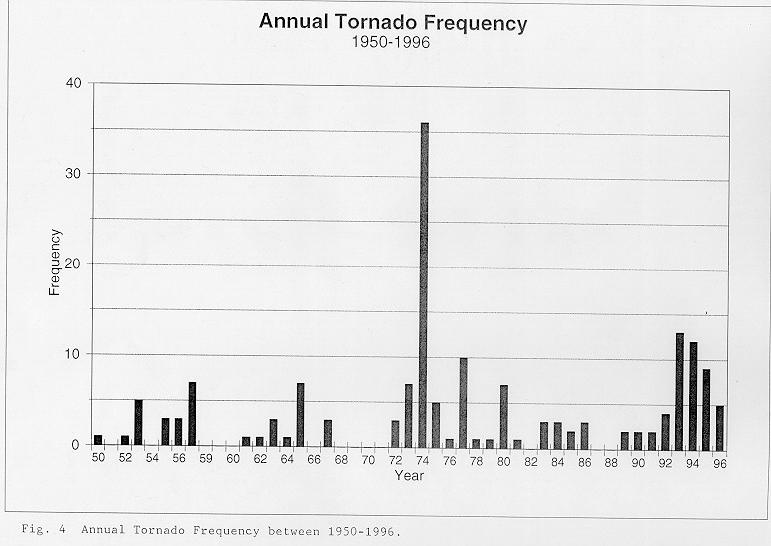
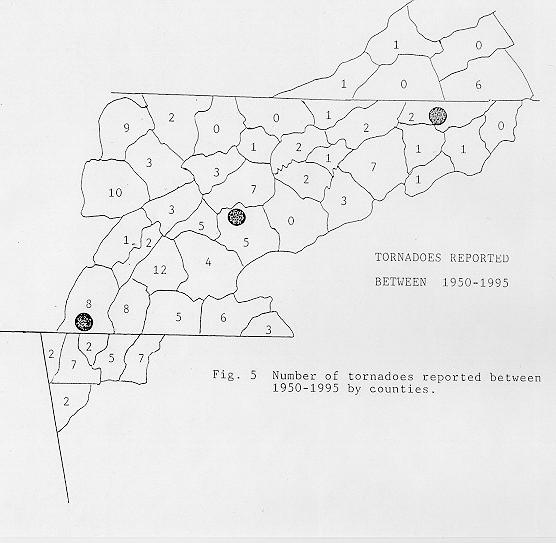
- During the period of record (1950-1996), there were a total of 163 tornadoes, 75 of which were category F2 or greater (Fig. 4). A list of these events can be found in the Appendix. These tornadoes have caused 38 deaths and 782 injuries throughout east Tennessee, extreme southwest Virginia, southwest North Carolina and northwest Georgia since 1950. Tornadoes have not been reported in every county in the CWA. Northeast portions of the CWA have seen the fewest number of tornadoes, while the central and southern parts have seen the most (Fig. 5). Although such factors as population bias and increased emphasis on warning verification have influenced the tornado database (Ostby, 1993), some points can still be made from the yearly tornado climatology of the Morristown CWA. The lack of warning verification may very well explain the lack of tornado reports in the CWA throughout the 1950s and 60s. However, it does not explain the lack of reports during the 1980s, since the NWS began its warning verification program in 1980. Meteorological factors must have had an effect on the lack of tornadoes during those years. Support for this comes from Grazulis (1993), who noted a national decrease in tornadoes for that period.
- b) monthly frequency
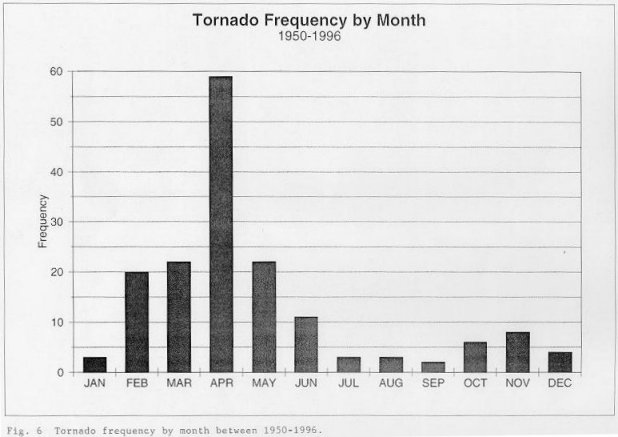
- Tornadoes have occurred in every month of the year in the CWA (Fig. 6). The greatest number have occurred in April, with the least in September. Although the April figures are highly skewed by the 1974 super-outbreak on April 3, this month still sees the highest occurrence even with the data from the super-outbreak removed. This is a bit earlier than the May peak that national statistics show (Grazulis 1993). This may be because warm, unstable air enters Tennessee earlier due to its southerly latitude. Such studies show, however, that the monthly distribution can be quite different from state to state. A secondary maximum in tornadoes is experienced in November. This is not surprising since studies by Ostby (1993) and Grazulis (1993) have shown that a "second season" of tornadoes occurs in November for most locations in the southern United States. This secondary maximum is slight for the Morristown CWA, probably because the area is on the northern fringe of the Southern United States, where warm unstable air is not uncommon in late fall.
- c) hourly occurrence
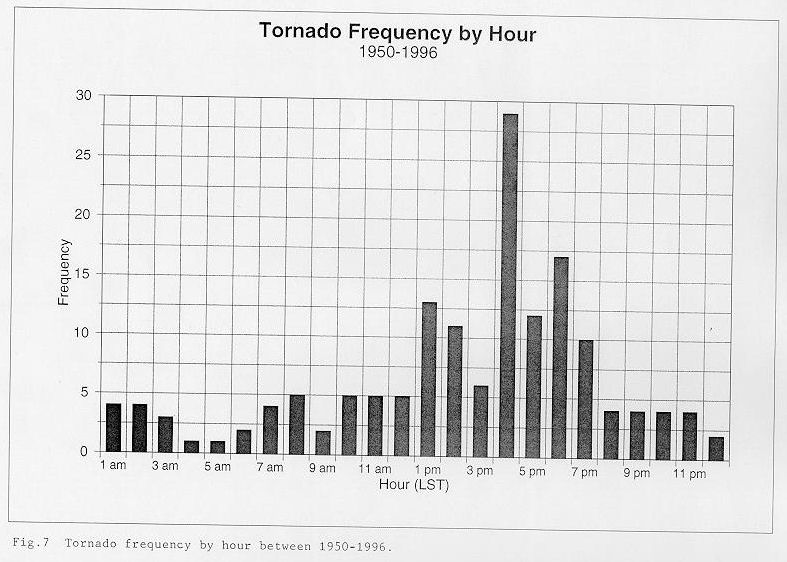
- Tornadoes were also categorized by their times of occurrence (Fig. 7). A pronounced peak in tornado occurrence is during the afternoon, with a maximum at 4 o'clock. The mid to late afternoon hours have been widely recognized as the peak time of most tornadoes in the United States (Grazulis 1993). Grazulis (1993) has shown that the peak time nationally for all known tornadoes is between 5 and 6 pm. However, each state has its own unique diurnal distribution. For Tennessee, peaks have been shown to occur generally between 4 and 7 pm (with the greatest peak at 5 pm). The least likely time for tornadoes is in pre-dawn hours from four to five in the morning.
- d) tornado magnitude
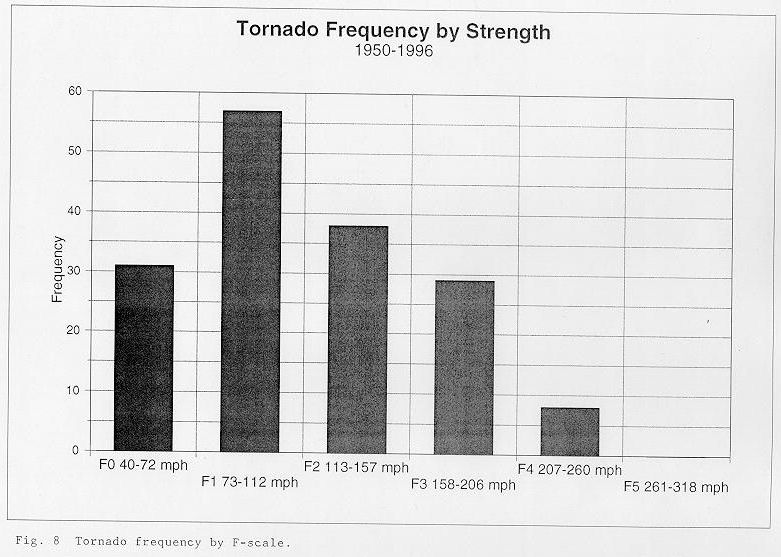
- The Fujita scale of tornado intensity (Table 1) is derived from the examination of tornado damage. Of all tornadoes in the Morristown CWA, 54% have been categorized as weak (F0-F1), 41% were strong (F2-F3), and about 5% were violent (F4-F5). Nationally, those figures are 68% weak, 30% strong and 2% violent. There has never been a category F5 tornado (261-318 mph) in the CWA during the period of record (Fig. 8). The deadliest tornado reported was a category F4 which occurred in Fentress County during the April 1974 super outbreak. There were seven fatalities and 150 injuries with this tornado. However, it has been shown that because of a number of factors (subjective nature of estimating process, surveying techniques), there is about a 50% chance that there is a one category miscalculation in the F scale rating for any F0 through F4 tornado (Ostby, 1993).
| Fujita Tornado Scale |
Wind Speed |
Damage description |
| F0 |
40-72 mph |
light |
| F1 |
73-112 mph |
moderate |
| F2 |
113-157 mph |
significant |
| F3 |
158-206 mph |
severe |
| F4 |
207-260 mph |
devastating |
| F5 |
261-318 mph |
incredible |
Table 1. Source: Fujita (1981)
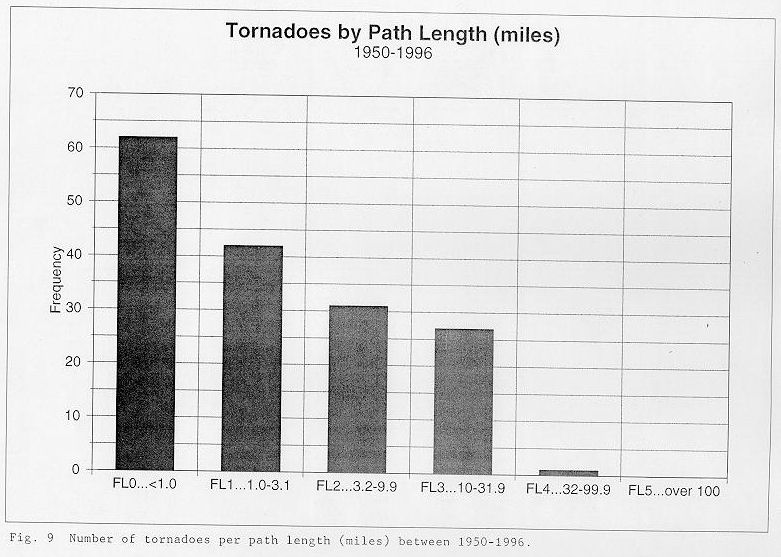
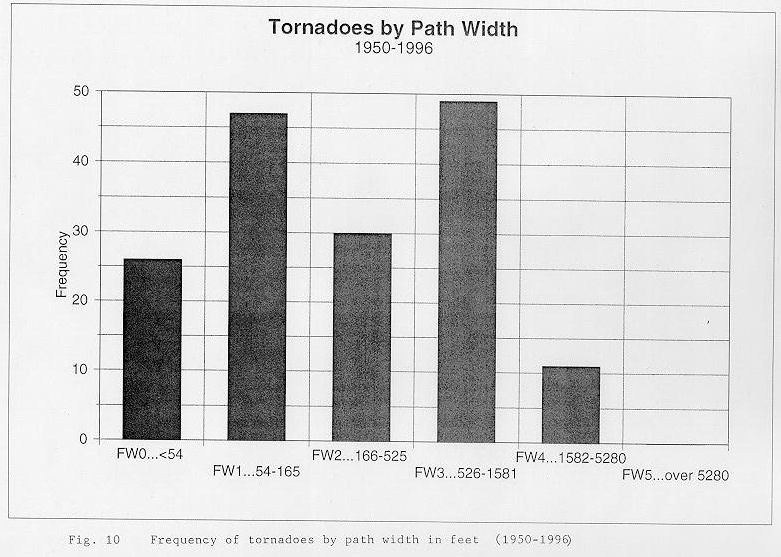
- Figure 9 shows the path lengths of the tornadoes in the CWA. The majority of tornadoes (38%) were on the ground for less than one mile. There has never been a tornado on the ground for over 100 miles during the period of record. Furthermore, the majority of tornadoes have consisted of a small path width (45% have been 165 feet or less) and there has never been a tornado reported to have exceeded one mile in width (Fig. 10). There was one tornado reported to be one mile wide. This occurred in Jefferson County on March 25, 1955 and was categorized as an F2.
- f) deaths and injuries
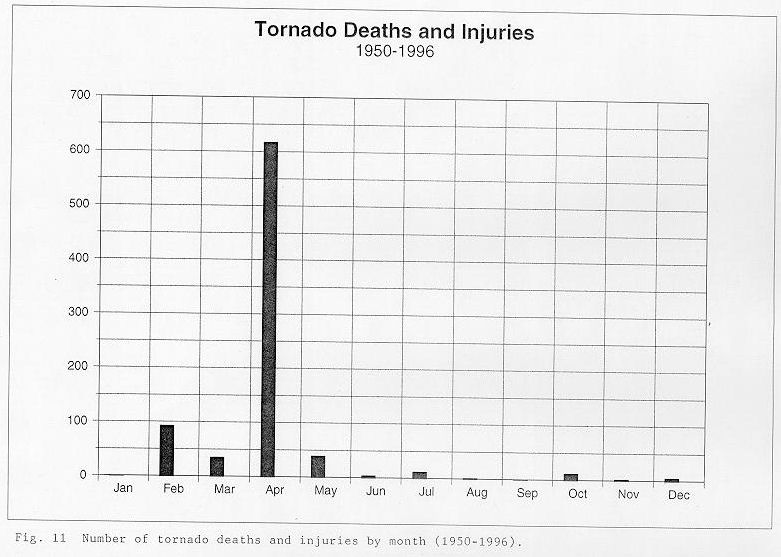
- The largest number of tornado deaths and injuries have occurred in the month of April, due largely to the events of April 3, 1974 (Fig.11). In that one event, there were 31 deaths and 586 injuries in the CWA. Therefore, about three-quarters of the deaths and injuries have occurred in April (Table 2). The next greatest number occurred in February (also due largely to one event...in this case, one tornado). The majority of the deaths and injuries occurred in the afternoon hours, corresponding well to the higher frequency of tornadoes during those hours. Nationally, Tennessee ranks first in the greatest number of tornadoes with injuries as a percentage of all tornadoes (38%). This agrees well with the percentage of tornadoes with injuries in the Morristown CWA (41%).
Monthly Percentage of Tornado Deaths and Injuries
| JAN |
FEB |
MAR |
APR |
MAY |
JUN |
JUL |
AUG |
SEP |
OCT |
NOV |
DEC |
| 0.0 |
11.3 |
4.3 |
75.2 |
4.8 |
0.5 |
1.5 |
0.1 |
0.0 |
1.5 |
0.2 |
0.6 |
Table 2.
5. Hail
- a) yearly distribution
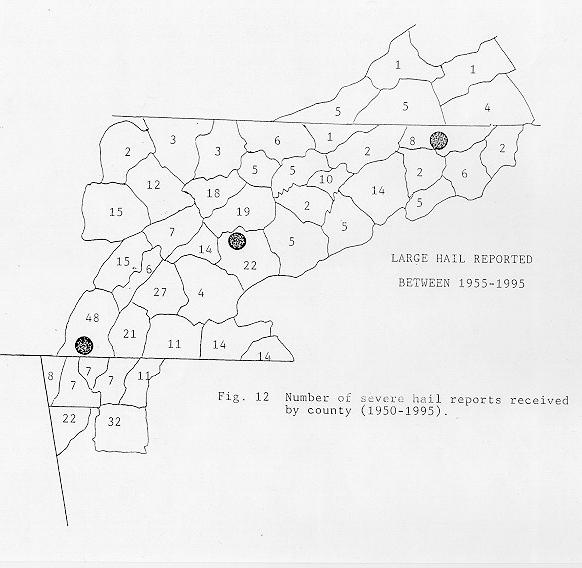
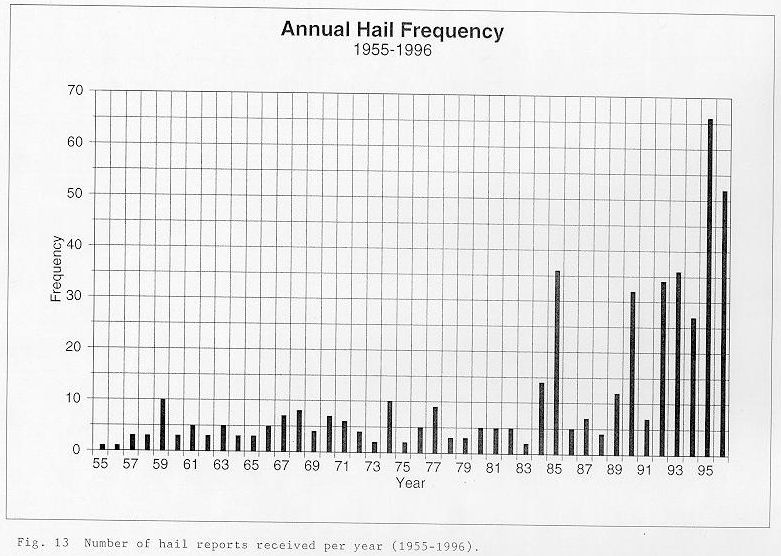
- Large hail (>3/4" diameter) is a fairly common occurrence throughout the CWA, with reports observed every year since 1955 and in every county (Fig. 12 & 13). The number of reports has been increasing significantly since the opening of the Morristown office in 1995, likely because of its more aggressive verification techniques. Nationally, a study by Sammler (1993) has shown that the number of hail reports more than doubled in the decade 1981-1990 from the previous decade, due in large part to implementation of the NWS warning verification program in 1980. The data for large hail reports like those for tornadoes, seems skewed toward higher population density areas throughout the CWA.
- b) monthly frequency
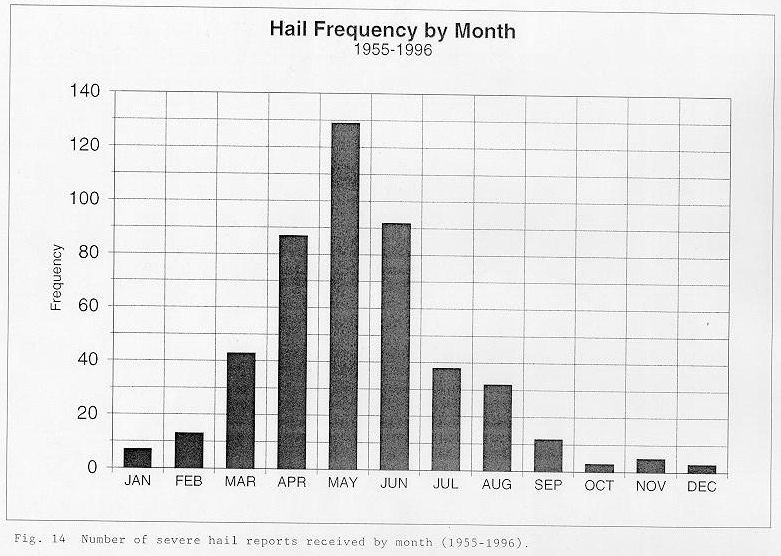
- The climatology of large hail shows a peak frequency in May, a bit later than the April tornado maximum. Although large hail is possible in every month of the year, the number of events curves up to its May maximum and descends to a minimum in October (Fig. 14). This is consistent with the national average, which also shows a hail maximum in May (Sammler 1993). There is also a slight maximum of hail events in November, as is the case with tornadoes.
- c) hourly occurrence
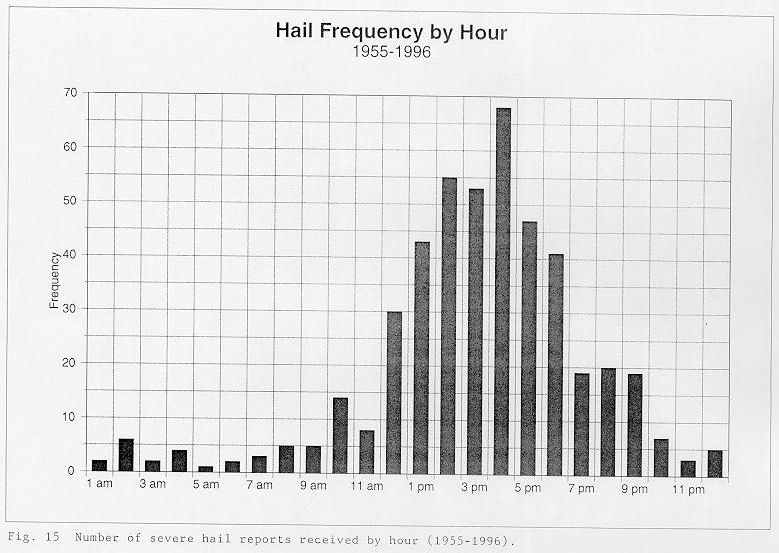
- Like tornadoes, the greatest number of hail events occurs during the afternoon hours, with a peak at 4 o'clock. The least likely time of large hail occurrence is once again during the early morning hours (Fig. 15).
- d) size distribution
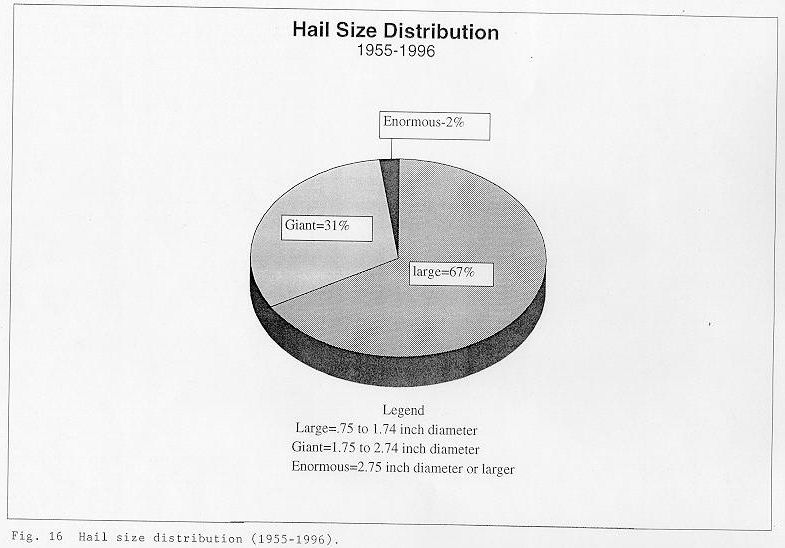
- Table 3 depicts the size estimation guide that the National Weather Service uses to obtain hail sizes from spotters, law enforcement, and the public. The NWS uses a hail size of 3/4 inches or greater to verify a severe thunderstorm. Figure 16 shows that the majority of our CWA's hail events have been made up of large hail reports (3/4-1.74 inch diameter). This doubling of hail reports in the last decade, as discussed above, has been due to a dramatic rise in the smaller hail category (1 inch or less) since 1980. However, the amount of hail reports greater than 1.74 inches has remained nearly constant since 1970. While prior to 1983 the highest percentage of hail reports were in the 1 inch to 1.74 inch category, since 1983 hail sizes of 1 inch or less have ballooned to where they now account for over 50 percent of all hail reported (Sammler 1993). Note in figure 16 that only 2% of hail in the Morristown CWA has been categorized as "enormous". This is consistent with studies that have shown the rarity of such large hail in the Southeast (Doswell, Kelly and Schaefer 1983).
| Hail Size |
Size Estimate |
| 3/4 inch |
Dime |
| 1 inch |
Quarter |
| 1.75 inch |
Golf Ball |
| 2.75 inches |
Baseball |
Table 3.
6. Damaging Winds
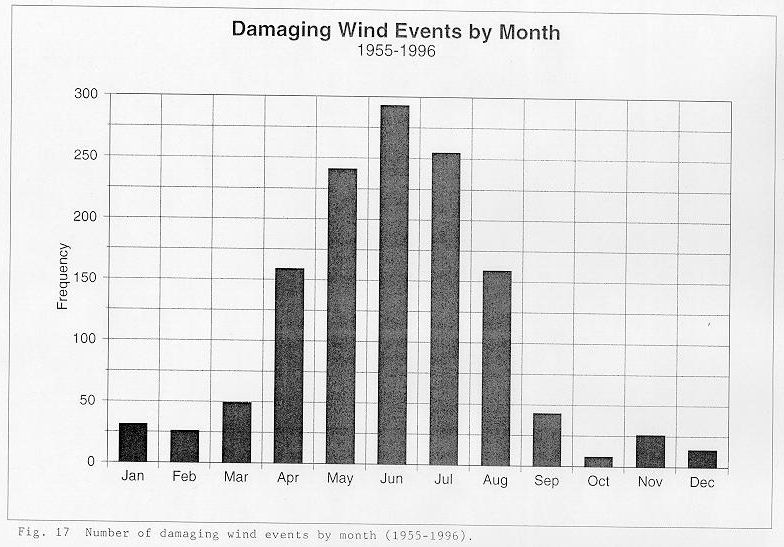
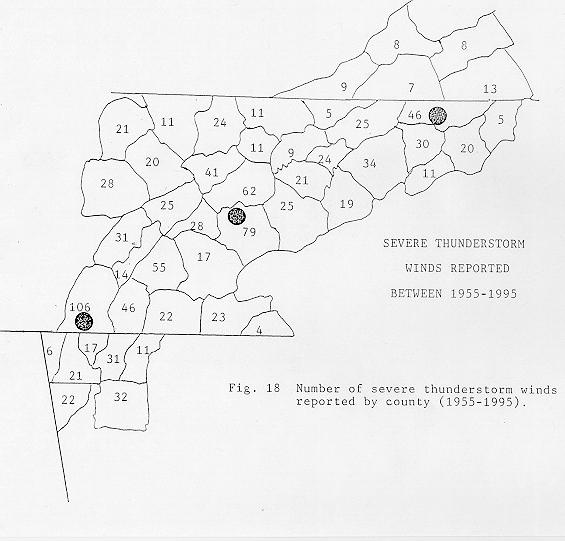
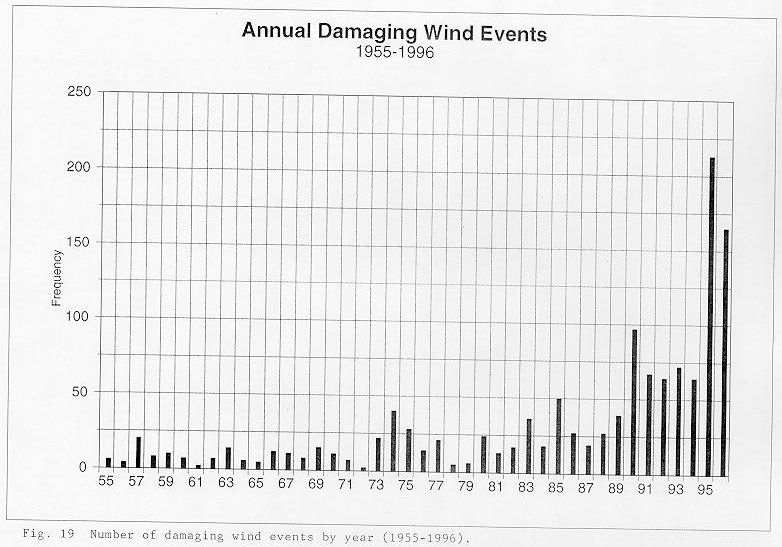
- During the month of June, the dominant severe weather type in the CWA shifts to wind damage (Fig. 17). Nationally, the number of severe wind reports peaks in June and July (Doswell, Kelly and Schaefer 1983). The NWS defines severe thunderstorm winds as those of 50 knots (58 mph) or greater. As is the case with hail, severe thunderstorm winds are common throughout our area. These wind events have also been reported every year since 1955 and in every county (Fig. 18 & 19). There are the same biases with this data as with those for hail. The greater number of reports occurs in higher population density areas, and the number of reports has increased significantly since the assumption of CWA responsibility by NWSO Morristown.
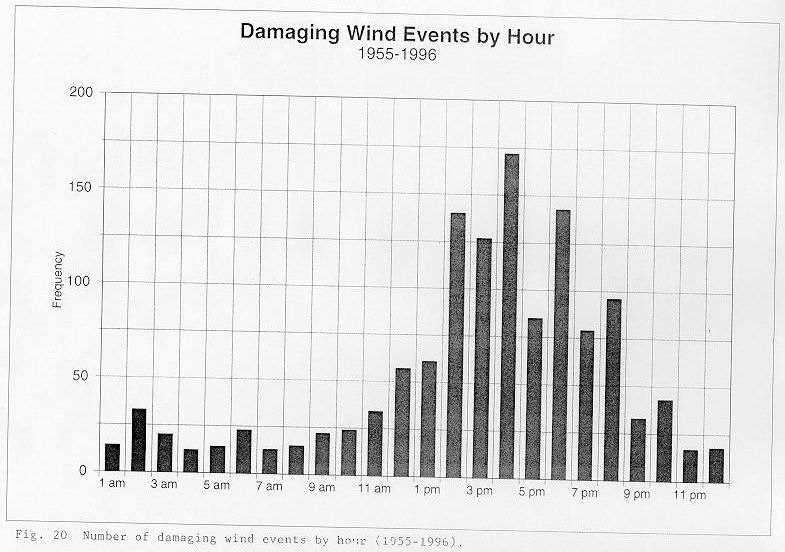
- The same time pattern holds true for wind damage as with all the other types of severe weather. The greatest number of severe thunderstorm wind events occurs in afternoon hours (4 PM), while the least number occurs during the morning hours (Fig. 20).
7. Conclusion
- The purpose of this study was to determine the severe weather climatology across the CWA. A number of temporal and spatial patterns were evident. During the past 30 years, a distinct increase in the number of severe weather events have been reported to the NWS. The increase has been most dramatic since NWSO Morristown, with its WSR-88D, began to serve the area. The increase has been most pronounced in the number of severe wind and hail events. This fact is likely attributable to the increased sensitivity of the new radar to these phenomena, and to the increased awareness of the NWS, local emergency managers, spotters, and the general public of these events.
- It was shown that the occurrence of tornadoes and hail are most frequent during the spring, especially April, while the peak time for damaging winds tends to occur a bit later, in June. The decrease in tornadoes and hail occurrences during the summer can be attributed to the shift of the main westerlies well to the north of the CWA, decreasing the vertical shear. Also, the corresponding height rises increase the level of the freezing level making the air-mass less favorable for hail development.
- Most of the severe weather during the summer is due to wind damage, which is usually associated with pulse severe thunderstorms producing locally strong microbursts. As would be expected, the peak time for all types of severe weather occurs from mid-afternoon to early evening.
- The maps showing the number of events per county were useful in determining areas which are more susceptible to severe weather. A majority of the CWA's tornadoes occur across southeast Tennessee and the northern Cumberland Plateau. The maximum across southeast Tennessee may be attributed to it's closer proximity to the moisture originating from the Gulf of Mexico. The maximum from over the Cumberland plateau may be the result of weak to moderate upslope flow during southerly winds. Also, both areas are typically less affected by stable cold air damming in the Great Tennessee Valley.
- A distinct minimum in severe events was noted over the mountains of northeast Tennessee, southwest Virginia, and the northern counties of the Great Tennessee Valley. This minimum is likely due to mountainous terrain disrupting inflow into thunderstorms. The northeast to southwest orientation of far eastern Tennessee tends to block deep low level moisture penetration into the northern sections of the CWA. Cold air damming in the Great Tennessee Valley during the spring also tends to inhibit moisture and instability in these northern sections.
- It is hoped that this study will aid the staff at the NWSO Knoxville/Tri-Cities in understanding the severe weather climatology of the CWA. We hope that this study will provide a foundation for further studies, which are needed to improve our forecast and warning program.
Acknowledgments
- The authors wish to express their appreciation to Steve Hunter (SOO, NWSO Knoxville/Tri-Cities) for reviewing this paper and providing very helpful comments and suggestions. Also, thanks goes to Robin Malone (Administrative Assistant, NWSO Knoxville/Tri-Cities) for helping us produce the severe weather maps.
References
- Doswell III, C.A., D.L. Kelly and J.T. Schaefer: A Preliminary Climatology of Non-Tornadic Severe Thunderstorm Events. Preprints, 13th Conference on Severe Local Storms, St. Louis, Amer. Meteor. Soc., 25-28.
- Fujita, T. T., 1981: Tornadoes and downbursts in the context of generalized planetary scales. J. Atmos. Sci., 38, 1511-1534.
- Grazulis, Thomas P., 1993: Significant Tornadoes 1680-1991. Environmental Films, 1326 pp.
- National Oceanic and Atmospheric Administration, 1972: Storm Data. 38, No's 1-7, National Climatic Data Center, Asheville, N.C.
- Ostby, Frederick P., 1993: The changing nature of tornado climatology. Preprints, 17th Conference on Severe Local Storms, St. Louis, MO, Amer. Meteor. Soc., 1-5.
- Sammler, William R., 1993: An updated climatology of large hail based on 1970-1990 data. Preprints, 17th Conf. On Severe Local Storms, St. Louis, Amer. Meteor. Soc., 32-35.
Appendix: Tornado specific information from the NWSO Knoxville/Tri-Cities county warning area.
| County |
Date |
Time |
# Deaths |
# Injuries |
Damage (code *) |
F-Scale |
Length (miles) |
Width (feet) |
| Whitfield, GA |
5/30/50 |
1400 |
0 |
0 |
3 |
1 |
0.5 |
20 |
| McMinn, TN |
2/29/52 |
1730 |
0 |
0 |
5 |
2 |
15.3 |
1,760 |
| Washington, VA |
4/30/53 |
1745 |
0 |
0 |
3 |
0 |
1 |
660 |
| Washington, VA |
6/10/53 |
1400 |
0 |
0 |
3 |
1 |
N/A |
N/A |
| Anderson, TN |
5/2/53 |
0215 |
0 |
0 |
3 |
2 |
1 |
300 |
| Meigs, TN |
5/2/53 |
0300 |
4 |
8 |
5 |
4 |
2.3 |
100 |
| McMinn, TN |
5/2/53 |
0310 |
0 |
0 |
3 |
4 |
2 |
100 |
| Hawkins, TN |
3/5/55 |
1900 |
0 |
0 |
5 |
2 |
4.3 |
900 |
| Greene, TN |
3/25/55 |
1630 |
0 |
0 |
4 |
1 |
2.0 |
900 |
| Jefferson, TN |
3/25/55 |
1730 |
0 |
0 |
3 |
2 |
16.3 |
5,280 |
| Fentress, TN |
2/17/56 |
2200 |
0 |
2 |
4 |
1 |
0.1 |
20 |
| Walker, GA |
2/18/56 |
0030 |
0 |
0 |
6 |
2 |
22.9 |
300 |
| Fentress, TN |
2/27/56 |
1730 |
0 |
0 |
3 |
1 |
0.1 |
20 |
| Wise, VA |
4/5/57 |
1240 |
0 |
3 |
4 |
1 |
N/A |
N/A |
| Cumberland, TN |
4/8/57 |
0600 |
0 |
0 |
3 |
2 |
2.7 |
30 |
| Washington, TN |
4/8/57 |
1530 |
0 |
0 |
3 |
2 |
3.0 |
1,320 |
| Fentress, TN |
11/18/57 |
1630 |
0 |
2 |
4 |
2 |
13.9 |
660 |
| Catoosa, GA |
3/8/61 |
0145 |
0 |
0 |
5 |
2 |
15.2 |
1,800 |
| Washington, VA |
6/3/62 |
1500 |
0 |
0 |
4 |
2 |
N/A |
N/A |
| Cocke, TN |
3/11/63 |
2100 |
1 |
1 |
5 |
2 |
6.2 |
600 |
| McMinn, TN |
3/19/63 |
1830 |
0 |
1 |
4 |
2 |
3.6 |
600 |
| Bradley, TN |
3/19/63 |
1815 |
0 |
3 |
5 |
2 |
3.3 |
450 |
| Clay, NC |
1/10/65 |
0815 |
0 |
0 |
3 |
1 |
N/A |
N/A |
| Loudon, TN |
3/17/65 |
1147 |
0 |
0 |
3 |
1 |
0.1 |
20 |
| Morgan, TN |
3/17/65 |
1100 |
0 |
0 |
3 |
1 |
0.1 |
20 |
| Fentress, TN |
4/15/65 |
1350 |
0 |
0 |
4 |
2 |
5.9 |
980 |
| Cumberland, TN |
4/15/65 |
1613 |
1 |
0 |
5 |
3 |
6.5 |
600 |
| Bradley, TN |
4/15/65 |
1625 |
0 |
50 |
6 |
3 |
10.4 |
1,800 |
| Knox, TN |
4/15/65 |
1730 |
0 |
6 |
6 |
2 |
7.4 |
600 |
| Greene, TN |
3/12/67 |
0530 |
1 |
5 |
5 |
2 |
16 |
900 |
| Greene, TN |
4/22/67 |
0705 |
0 |
0 |
5 |
2 |
0.2 |
750 |
| Walker, GA |
5/12/67 |
0815 |
0 |
0 |
2 |
1 |
0.5 |
100 |
| Fentress, TN |
5/14/72 |
2030 |
0 |
3 |
4 |
2 |
1 |
150 |
| Cumberland, TN |
6/28/72 |
1300 |
0 |
0 |
4 |
2 |
0.1 |
120 |
| Blount, TN |
6/28/72 |
1740 |
0 |
3 |
5 |
1 |
0.5 |
80 |
| Grainger, TN |
5/10/73 |
2130 |
0 |
0 |
3 |
1 |
N/A |
N/A |
| Walker, GA |
5/27/73 |
1800 |
0 |
0 |
3 |
1 |
N/A |
150 |
| Cumberland, TN |
5/23/73 |
1600 |
0 |
0 |
4 |
1 |
1 |
300 |
| Polk, TN |
12/13/73 |
0750 |
0 |
3 |
5 |
2 |
0.8 |
2,640 |
| Greene, TN |
12/13/73 |
1000 |
0 |
1 |
4 |
1 |
0.5 |
1,320 |
| Whitfield, GA |
1/11/74 |
0445 |
0 |
0 |
4 |
1 |
N/A |
N/A |
| Cherokee, NC |
4/2/74 |
0001 |
0 |
0 |
4 |
1 |
16.8 |
N/A |
| Polk, TN |
3/21/74 |
0040 |
0 |
7 |
5 |
2 |
0.8 |
900 |
| Lee, VA |
4/4/74 |
0121 |
0 |
0 |
2 |
0 |
8.6 |
50 |
| Cherokee, NC |
4/3/74 |
1600 |
0 |
0 |
N/A |
1 |
N/A |
N/A |
| Washington, VA |
4/4/74 |
0300 |
1 |
1 |
5 |
3 |
5.4 |
530 |
| Polk, TN |
4/3/74 |
1315 |
0 |
0 |
3 |
3 |
2.7 |
1,050 |
| Blount, TN |
4/3/74 |
1400 |
0 |
2 |
5 |
2 |
0.5 |
150 |
| Cherokee, NC |
4/3/74 |
1925 |
4 |
26 |
7 |
4 |
18.9 |
1,050 |
| McMinn, TN |
4/3/74 |
1430 |
1 |
32 |
3 |
1 |
3.6 |
80 |
| Cherokee, NC |
4/4/74 |
0700 |
0 |
0 |
4 |
0 |
9.7 |
N/A |
| Hamilton, TN |
4/3/74 |
1450 |
0 |
2 |
4 |
1 |
5.9 |
80 |
| Loudon, TN |
4/3/74 |
1600 |
0 |
2 |
5 |
2 |
N/A |
300 |
| Monroe, TN |
4/3/74 |
1600 |
0 |
0 |
5 |
2 |
1.0 |
600 |
| Bradley, TN |
4/3/74 |
1615 |
2 |
0 |
5 |
3 |
9.7 |
1,500 |
| Polk, TN |
4/3/74 |
1625 |
1 |
0 |
5 |
3 |
5.4 |
1,500 |
| McMinn, TN |
4/3/74 |
1630 |
0 |
50 |
5 |
3 |
6.1 |
1,500 |
| Whitfield, GA |
4/3/74 |
1650 |
2 |
25 |
6 |
4 |
3.3 |
450 |
| Fentress, TN |
4/3/74 |
1815 |
0 |
0 |
4 |
2 |
7.9 |
1,200 |
| Clay, NC |
12/5/74 |
0355 |
0 |
0 |
4 |
1 |
7.7 |
50 |
| Fentress, TN |
4/3/74 |
1950 |
7 |
150 |
6 |
4 |
18.8 |
600 |
| Cocke, TN |
4/3/74 |
2100 |
0 |
0 |
3 |
0 |
0.5 |
80 |
| Morgan, TN |
4/3/74 |
2250 |
0 |
6 |
4 |
3 |
3.6 |
1,050 |
| Scott, TN |
4/3/74 |
2255 |
0 |
5 |
N/A |
3 |
8.6 |
1,050 |
| Scott, TN |
4/3/74 |
2250 |
0 |
21 |
5 |
3 |
13.0 |
1,200 |
| Cumberland, TN |
4/3/74 |
2335 |
0 |
20 |
5 |
2 |
12.9 |
900 |
| Knox, TN |
4/3/74 |
2330 |
2 |
21 |
4 |
1 |
1.0 |
450 |
| Anderson, TN |
4/4/74 |
0030 |
0 |
0 |
3 |
0 |
8.7 |
600 |
| Jefferson, TN |
4/4/74 |
0100 |
0 |
0 |
4 |
0 |
4.5 |
80 |
| Hawkins, TN |
4/4/74 |
0130 |
0 |
0 |
3 |
0 |
0.5 |
80 |
| Sullivan, TN |
4/4/74 |
0200 |
0 |
2 |
5 |
0 |
13.8 |
750 |
| McMinn, TN |
4/8/74 |
1115 |
0 |
1 |
5 |
3 |
2.0 |
1,320 |
| Washington, VA |
1/25/75 |
2230 |
0 |
0 |
4 |
2 |
1.3 |
90 |
| Monroe, TN |
3/7/75 |
1220 |
0 |
3 |
4 |
1 |
9.4 |
960 |
| Blount, TN |
3/7/75 |
1240 |
0 |
0 |
4 |
1 |
0.5 |
600 |
| Greene, TN |
3/24/75 |
0730 |
0 |
0 |
4 |
1 |
0.5 |
300 |
| Cumberland, TN |
4/25/75 |
1530 |
1 |
4 |
5 |
2 |
1.5 |
1,320 |
| Cocke, TN |
2/18/76 |
1307 |
0 |
10 |
6 |
2 |
1.0 |
100 |
| Greene, TN |
6/24/77 |
1630 |
0 |
0 |
4 |
1 |
3.8 |
300 |
| Hamilton, TN |
8/12/77 |
1830 |
0 |
0 |
4 |
0 |
0.1 |
50 |
| Cumberland, TN |
9/25/77 |
1400 |
0 |
0 |
3 |
0 |
5.1 |
300 |
| Sullivan, TN |
10/1/77 |
1435 |
0 |
10 |
6 |
1 |
16.2 |
230 |
| Grainger, TN |
10/1/77 |
1545 |
0 |
2 |
5 |
0 |
2.0 |
100 |
| Union, TN |
10/1/77 |
1915 |
0 |
0 |
5 |
1 |
4.3 |
1,320 |
| Roane, TN |
10/1/77 |
2315 |
0 |
0 |
4 |
0 |
0.2 |
300 |
| McMinn, TN |
12/5/77 |
0840 |
0 |
1 |
5 |
1 |
5.1 |
300 |
| Cherokee, NC |
9/21/79 |
1615 |
0 |
0 |
4 |
0 |
0.1 |
300 |
| Blount, TN |
3/7/80 |
1730 |
0 |
0 |
3 |
1 |
0.1 |
60 |
| Clay, NC |
2/25/80 |
1615 |
0 |
0 |
2 |
0 |
N/A |
N/A |
| Bradley, TN |
4/8/80 |
1631 |
0 |
0 |
4 |
1 |
5.2 |
150 |
| Monroe, TN |
4/28/80 |
1705 |
0 |
1 |
5 |
2 |
3.3 |
150 |
| Hamilton, TN |
6/24/80 |
1520 |
0 |
0 |
4 |
0 |
N/A |
N/A |
| Hancock, TN |
7/6/80 |
1300 |
0 |
0 |
5 |
2 |
11.5 |
900 |
| Unicoi, TN |
7/10/80 |
1230 |
0 |
12 |
5 |
3 |
1.9 |
300 |
| Knox, TN |
5/27/81 |
1840 |
0 |
0 |
4 |
0 |
0.4 |
150 |
| Rhea, TN |
6/4/83 |
0115 |
0 |
0 |
5 |
1 |
20.0 |
150 |
| Walker, GA |
5/19/83 |
1745 |
0 |
1 |
5 |
1 |
2.0 |
150 |
| Whitfield, GA |
5/19/83 |
1800 |
0 |
3 |
5 |
1 |
0.5 |
90 |
| Fentress, TN |
5/7/84 |
1530 |
0 |
0 |
4 |
1 |
0.5 |
90 |
| Loudon, TN |
5/7/84 |
1720 |
0 |
0 |
5 |
2 |
1.0 |
210 |
| Dade, GA |
10/23/84 |
1705 |
0 |
0 |
4 |
1 |
1.0 |
110 |
| Hamblen, TN |
11/27/85 |
1400 |
0 |
0 |
4 |
1 |
2.0 |
120 |
| Bradley, TN |
2/6/86 |
1618 |
0 |
5 |
6 |
3 |
5.0 |
810 |
| Polk, TN |
2/6/86 |
1628 |
0 |
0 |
6 |
3 |
2.0 |
810 |
| McMinn, TN |
2/6/86 |
1638 |
0 |
0 |
6 |
3 |
3.0 |
810 |
| Carter, TN |
6/16/89 |
1400 |
0 |
0 |
4 |
1 |
1.0 |
90 |
| Bradley, TN |
11/15/89 |
1845 |
0 |
0 |
4 |
1 |
3.0 |
90 |
| Washington, VA |
4/30/90 |
1625 |
0 |
0 |
4 |
0 |
0.3 |
60 |
| Hamilton, TN |
10/4/90 |
0715 |
0 |
0 |
5 |
1 |
1.8 |
70 |
| Cherokee, NC |
4/16/91 |
1530 |
0 |
0 |
4 |
0 |
0.5 |
150 |
| Whitfield, GA |
4/24/92 |
1840 |
0 |
0 |
4 |
0 |
0.5 |
600 |
| Dade, GA |
11/22/92 |
0850 |
0 |
0 |
5 |
1 |
3.5 |
1,500 |
| Walker, GA |
11/22/92 |
0930 |
0 |
0 |
3 |
1 |
1.0 |
450 |
| Catoosa, GA |
11/22/92 |
0933 |
0 |
0 |
3 |
1 |
1.0 |
450 |
| Cumberland, TN |
02/21/93 |
1435 |
0 |
0 |
5 |
0 |
5.0 |
70 |
| Anderson, TN |
2/21/93 |
1535 |
0 |
3 |
6 |
3 |
10.0 |
450 |
| Knox, TN |
2/21/93 |
1605 |
0 |
0 |
6 |
3 |
6.0 |
450 |
| Roane, TN |
2/21/93 |
1605 |
0 |
0 |
4 |
3 |
1.5 |
300 |
| Loudon, TN |
2/21/93 |
1610 |
1 |
55 |
6 |
3 |
15.0 |
300 |
| Blount, TN |
2/21/93 |
1620 |
0 |
0 |
5 |
3 |
10.0 |
300 |
| Roane, TN |
2/21/93 |
1620 |
0 |
0 |
5 |
1 |
3.0 |
70 |
| McMinn, TN |
2/21/93 |
1645 |
0 |
7 |
5 |
3 |
4.0 |
220 |
| Monroe, TN |
2/21/93 |
1650 |
0 |
10 |
6 |
3 |
15.0 |
300 |
| Fentress, TN |
5/12/93 |
1230 |
0 |
0 |
3 |
0 |
0.8 |
70 |
| Knox, TN |
6/30/93 |
0630 |
0 |
1 |
3 |
0 |
2.0 |
30 |
| Knox, TN |
6/30/93 |
1842 |
0 |
0 |
2 |
0 |
1.0 |
20 |
| Hamilton, TN |
4/15/94 |
1030 |
1 |
2 |
6 |
3 |
2.0 |
2,640 |
| Meigs, TN |
4/15/94 |
1034 |
0 |
3 |
6 |
3 |
2.0 |
2,640 |
| Bradley, TN |
4/15/94 |
1036 |
0 |
2 |
6 |
3 |
1.0 |
2,640 |
| McMinn, TN |
4/15/94 |
1040 |
0 |
2 |
6 |
3 |
10.0 |
2,640 |
| McMinn, TN |
4/27/94 |
1215 |
0 |
0 |
2 |
0 |
0.1 |
30 |
| Walker, GA |
3/27/94 |
1255 |
0 |
1 |
4 |
0 |
1.5 |
150 |
| Walker, GA |
3/27/94 |
1315 |
0 |
0 |
5 |
1 |
1.0 |
120 |
| Greene, TN |
8/21/94 |
0700 |
0 |
0 |
1 |
1 |
1.0 |
70 |
| Walker, GA |
8/27/94 |
1255 |
0 |
1 |
4 |
0 |
1.5 |
150 |
| Hamilton, TN |
4/21/95 |
0020 |
0 |
0 |
5 |
0 |
0.1 |
90 |
| Hamilton, TN |
4/21/95 |
0025 |
0 |
0 |
5 |
2 |
5.0 |
990 |
| Hamilton, TN |
4/21/95 |
0030 |
0 |
0 |
5 |
1 |
1.0 |
900 |
| McMinn, TN |
5/10/95 |
2125 |
0 |
0 |
0 |
1 |
3.0 |
600 |
| Cumberland, TN |
5/18/95 |
1721 |
0 |
20 |
6 |
3 |
9.0 |
300 |
| Morgan, TN |
5/18/95 |
1750 |
0 |
0 |
0 |
0 |
0.5 |
70 |
| Cumberland, TN |
5/18/95 |
1930 |
0 |
0 |
4 |
1 |
2.0 |
70 |
| Knox, TN |
5/18/95 |
2000 |
0 |
0 |
4 |
1 |
2.0 |
70 |
| Loudon, TN |
5/18/95 |
2100 |
0 |
0 |
4 |
0 |
1.0 |
60 |
| Fentress, TN |
3/16/96 |
1630 |
0 |
0 |
4 |
0 |
1.0 |
90 |
| Scott, VA |
4/13/96 |
1611 |
0 |
0 |
4 |
0 |
0.5 |
70 |
| Bradley, TN |
5/27/96 |
1828 |
0 |
0 |
5 |
0 |
3.5 |
30 |
| Russell, VA |
7/19/96 |
1700 |
0 |
0 |
5 |
1 |
3.6 |
50 |
* Damage Code:
- 1 - Less than $50
- 2 - $50 to $500
- 3 - $500 to $5,000
- 4 - $5000 to $50,000
- 5 - $50,000 to $500,000
- 6 - $500,000 to $5 million
- 7 - $5 million to $50 million
- 8 - $50 million to $500 million
- 9 - $500 million to $5 billion


 Local Radar
 Huntsville Radar
 Regional Satellite
 Graphical Forecast
 Weather Map
 Daily Graphics
 Follow us on YouTube