A Climatology of Synoptic Conditions associated with Significant Tornadoes across the Southern Appalachian Region
by
David M. Gaffin and Stephen S. Parker
ABSTRACT
- A 54-year climatology (1950-2003) of synoptic conditions associated with significant (F2 or greater) tornado events in the southern Appalachian region was compiled to 1) investigate the observed relative minimum of tornadoes in the Great Tennessee Valley, 2) test a hypothesis concerning northwest versus southwest 500-hPa flow events across the Great Tennessee Valley and Cumberland Plateau, 3) examine common operational forecasting techniques often used with synoptic-scale data to determine potentially tornadic environments, and 4) compare the patterns associated with significant, outbreak, and weak tornado events. Individual surface and upper-air charts along with composite charts closest to the time of significant tornado occurrences were used in this investigation. It was found that significant tornado events that occurred with prefrontal troughs (the most numerous surface boundary in the study) produced significant tornadoes almost exclusively over the Cumberland Plateau and southern Appalachian Mountains, with very few prefrontal trough events producing significant tornadoes in the Great Tennessee Valley of eastern Tennessee. Only four northwest 500-hPa flow events (which produced significant tornadoes almost exclusively in the southern Appalachian Mountains and during the summer) were found in this study, which refuted the initial hypothesis that northwest 500-hPa flow may produce tornadoes mainly in the Great Tennessee Valley with southwest 500-hPa flow producing tornadoes mainly across the Cumberland Plateau. Most significant tornado events in this study were associated with southwest 500-hPa flow ahead of a neutral-tilted trough, which revealed that the particular tilt of a 500-hPa trough does not necessarily enhance the formation of significant tornadoes in the southern Appalachian region. However, outbreak events (with five or more significant tornadoes) in the southern Appalachian region were typically associated with positive-tilted troughs. At 300 or 250 hPa, the southern Appalachian region was frequently located on the right side of a jet streak, with an even split between the entrance and exit regions. This finding indicated that significant tornado events in the southern Appalachian region did not necessarily favor the right-entrance or left-exit regions of a jet streak, where rising motion is expected to most intense (with straight jet streaks). A comparison of the composites of weak, significant, and outbreak tornado events revealed that wind dynamics were more important than instability in the distinction between weak and significant tornado events across the southern Appalachian region.
1. INTRODUCTION
- The frequency of significant tornadoes (F2 or greater) decreases markedly from west-to-east across the Tennessee River Valley and southern Appalachian region (Fig. 1). It is commonly thought that this decrease is mainly due to the increasingly complex terrain of the southern Appalachian region. The terrain features of the southern Appalachian region are generally oriented from southwest to northeast and have three distinct areas (Fig. 2): the Cumberland Plateau (around 450 to 900 m (1,500 to 3,000 ft) MSL), Great Tennessee Valley (around 150 to 450 m (500 to 1,500 ft) MSL), and southern Appalachian Mountains (around 150 to 1,980 m (1,500 to 6,500 ft) MSL). The terrain across the Cumberland Plateau (hereafter referred to as the Plateau) and Great Tennessee Valley (hereafter referred to as the Valley) is generally flat with an abrupt rise from the Valley to the Plateau and southern Appalachian Mountains (hereafter referred to as the Mountains). The highest mountain ridges of the Mountains rise to around the 850-hPa level. The higher frequency of significant tornadoes near the southern Appalachian region compared to other major mountainous regions of the western and northeast United States provides a good natural laboratory to investigate the spatial distribution of tornadoes in comparison with the large-scale terrain. Because significant tornadoes are responsible for most tornado deaths and are more likely to have been documented in the climatological record than weaker tornadoes (Concannon et al. 2000), it is thought that a large climatological study should mainly focus on those events that produced a significant tornado.
- The climatological record across the southern Appalachian region reveals that most significant tornadoes occur on the southern and western sides of the Mountains (across middle and eastern Tennessee, northeastern Alabama, and northern Georgina), with far fewer occurrences on the eastern side (across western North Carolina and upstate South Carolina). Thus, a comparison study regarding possible differences between the synoptic environments of these three subregions (western, southern, and eastern sides of the Mountains) would not be possible, because of the insufficient number of events on the eastern side to form statistically significant conclusions.
- An examination of the tornado tracks from the outbreaks on 10-11 November 2002 and 3-4 April 1974 (Fig. 3) reveals an interesting marked decrease in the number of tornadoes across the Valley compared with the Plateau and the Mountains. The size of the Valley is large enough to have situations where the wind shear and thermal profile environment in the Valley could be significantly different than that observed over the Plateau or Mountains. It has been hypothesized that northwest (290 to 3300) 500-hPa flow may produce tornadoes mainly in the Valley, while southwest (210 to 2500) 500-hPa flow may produce tornadoes mainly over the Plateau or Mountains because of wind shear variations over these terrain features. For example, prevailing low-level southwest wind flow up the Valley during many tornado events may produce larger wind shear during northwest 500-hPa flow compared to southwest 500-hPa flow.
- Overall, a need exists for a study to help determine whether the synoptic environment across the southern Appalachian region varies enough over the different large-scale terrain features to distinguish between tornadic and nontornadic environments, and also whether different synoptic patterns produce tornadoes that favor one of these large-scale terrain features. As an initial step in this investigation, the synoptic conditions associated with significant tornado events across the southern Appalachian region will be examined to investigate the observed relative minimum of tornadoes in the Valley and test the hypothesis concerning northwest versus southwest 500-hPa flow events in the Valley. In addition, operational forecasting techniques often used with synoptic-scale data to identify potentially tornadic environments (Johns and Doswell 1992; Rose et al. 2004) that involve examination of such fields as surface and 850-hPa dewpoints, the tilt of the 500-hPa troughs, and the quadrant of the 250-hPa jet streaks (in relation to the southern Appalachian region) will be investigated. Finally, composite maps of significant tornado events will be compared with those of weak tornado events to determine the synoptic-scale characteristics associated with significant tornado events.
2. METHODOLOGY AND DATA
- A significant tornado event was defined for this study as an occurrence (documented in Storm Data) of one or more significant tornado(es) between 1950 and 2003 within a hundred-county area of middle and eastern Tennessee, northeastern Alabama, northern Georgia, upstate South Carolina and western North Carolina (Fig. 4). This area of study was chosen to have a one-county-deep enclosure of the three main terrain features of the southern Appalachian region (Fig. 2) in order to examine only significant tornado events that possibly were directly affected by the complex terrain. Significant tornado events were considered as two separate events if there were more than 12 hours of separation between the tornado occurrences. Outbreak events were examined as a separate classification, and were defined as having five or more significant tornadoes per event (which composed 10% of all events in this study). The eight outbreak events of significant tornadoes in the southern Appalachian region included 15 April 1965 (6 significant tornadoes), 27 May 1973 (5), 3-4 April 1974 (28), 4 April 1989 (10), 22 November 1992 (5), 21 February 1993 (5), 27 March 1994 (9), and 10 November 2002 (9). When evaluating temporal patterns, a single time was assigned to an event, with the median time assigned to events with multiple significant tornadoes. The "superoutbreak" event of 3-4 April 1974 was excluded from temporal pattern evaluation, because this event continued over 12 hours. A day event was defined as having occurred between 1500 and 0259 UTC, while a night event occurred between 0300 and 1459 UTC. While these times do not necessarily coincide with sunset and sunrise throughout the year, they were chosen to include the lag time observed with the diurnal thermal effects.
- The 3-hourly surface charts and the 12-hourly upper-air (850, 500, and 250 hPa) charts from the National Climatic Data Center (NCDC) closest to the time of tornado occurrence were examined for each of the 94 individual events. Many of the surface charts contained illegible or missing surface observations. Thus, the hourly surface observations at Nashville, Tennessee (BNA); Crossville, Tennessee (CSV); Huntsville, Alabama (HSV); Atlanta, Georgia (ATL); Chattanooga, Tennessee (CHA); Knoxville, Tennessee (TYS); Tri-Cities airport, Tennessee (TRI); Asheville, North Carolina (AVL); Hickory, North Carolina (HKY); and Greenville-Spartanburg, South Carolina (GSP) (Fig. 4), from the web search store retrieve display (WSSRD) website (https://noaa.imcwv.com/), were used to supplement and enhance the information on many of the surface charts. If the observation at the time of the surface chart was considered unrepresentative of the tornado-producing air mass (primarily because of outflow from thunderstorms), then the previous hourly observation was used instead. The upper-air charts were used to determine the isoheight patterns, winds, temperatures and dewpoints at the 850-hPa level; the winds and tilt of the troughs at the 500-hPa level; and the quadrant of any jet streak in relation to the southern Appalachians at the 300- or 250-hPa level. The southern Appalachians were considered near a 300- or 250-hPa jet streak if the region was generally within 500 km (300 miles) of the core of strongest winds. On the 500-hPa charts, a trough was considered negatively tilted if its axis was tilted along a northwest-southeast orientation (rotated counterclockwise about 150 or greater from a north-south orientation) and positively tilted if its axis was tilted along a northeast-southwest orientation (rotated clockwise about 150 or greater from a north-south orientation). Missing upper-air charts since June 1957 were supplemented using the North American raob upper-air products on the Plymouth State University Weather Center?s Web site (https://vortex.plymouth.edu/u-make.html). The missing upper-air charts on 18 February 1956 were unable to be supplemented, along with five other missing 850-hPa charts (the 1 March 1952, 10 May 1952, 21 January 1953, 7 March 1956, and 23 January 1957 events) and three other missing 300-hPa charts (the 1 March 1952, 10 May 1952, and 21 January 1953 events).
- Composite maps of the 6-hourly data closest to the time of significant tornado occurrence were also constructed using the National Centers for Environmental Prediction-National Center for Atmospheric Research reanalysis dataset (Kalnay et al. 1996) on the National Oceanic and Atmospheric Administration-Cooperative Institute for Research in Environmental Sciences Climate Diagnostics Center?s Web site (https://www.cdc.noaa.gov/Composites/Hour/). The parameters available for composite maps included sea level pressure, geopotential height, temperature, relative humidity, specific humidity, and vector wind speeds. To further determine the significance of the composites of significant tornado events, these composites were compared with the composites of events in which only weak tornadoes (with no significant tornadoes) were observed across the southern Appalachian region. There were a total of 156 weak tornado events found in the study area from 1950 through 2003.
- Forecasting parameters found primarily from sounding data (such as CAPE and helicity) were not examined in this study because there were no sounding sites located within the southern Appalachian region. The closest sounding sites surrounding the area of study were generally more than 100 km (60 miles) away. Thus, it was decided that these soundings would not be representative enough to develop accurate and meaningful conclusions. To substitute for this lack of important tornado-forecasting tools, proxy measures of instability (the lifted and Showalter indices) and shear (surface, 850-, 700-, and 500-hPa wind speeds) were constructed from the different parameters available with the composite maps.
3. RESULTS
- a) Climatological statistics
- An examination of the 94 significant tornado events across the southern Appalachian region (an average of 1.7 events per year) revealed that nearly two-thirds of the events occurred during the spring months of March, April, and May (Table 1), with April being the most active month. Also, around a fourth of the events occurred from late autumn through winter (November through February), which was similar to the Garinger and Knupp (1993) "interior Southeast" subregion climatology. Temporal patterns revealed that around two-thirds of all significant tornado events and three-quarters of the outbreak events occurred during the afternoon and evening (1900 through 0359 UTC). Also, all eight outbreak events occurred during the day, except the 10-11 November 2002 event, whose median time was 0335 UTC.
- b. Synoptic patterns of significant tornado events compared with the terrain features
- The surface charts for each individual event were examined to determine whether the large-scale terrain features of the southern Appalachian region altered the surface synoptic environment enough to hinder or encourage significant tornado formation in the Plateau, Valley, and Mountains. These surface charts revealed only subtle differences between the three regions with the wind direction and dewpoints. In fact, the outbreak events of 3-4 April 1974 and 10-11 November 2002 (where a lack of tornadoes was noticeable in the Valley) observed southwest winds across the entire region with only subtle differences in the surface dewpoints. It was seen in this study that the most significant areal differences in surface wind direction and dewpoints were not related to the large-scale terrain features, but to the presence of surface boundaries. Thus, the surface charts were also examined to determine whether the significant tornadoes occurred near boundaries such as a cold front, warm front, stationary front, prefrontal trough, or trough north of an area of low pressure. Rogash (1995) found that an overwhelming majority of F2 or greater tornadoes developed within 100 km of a surface thermal or moisture boundary. In this study, a significant tornado was considered near a boundary if it occurred within 100 km (60 miles) of the boundary. Overall, 29 events occurred near a prefrontal trough, 25 near a cold front, 22 near a warm front, 4 near a stationary front, and 3 near a trough north of a low pressure area (7 events occurred near multiple boundaries, which accounts for the total of 101). In addition, there were 18 events where the significant tornado was not observed near a discernable boundary. Considering only the 8 outbreak events, 6 events occurred near a prefrontal trough, 3 near a cold front, and 2 near a warm front (three events occurred near multiple boundaries, which accounts for the total of 11). The temporal patterns with each boundary revealed that all stationary front events occurred at night, while events associated with the other boundaries occurred primarily during the day.
- When the surface boundaries were compared with the location of the significant tornadoes for each event, an interesting pattern emerged in regards to the prefrontal trough events and their relationship to the large-scale terrain. The events that occurred with prefrontal troughs displayed an absence of significant tornadoes in the Valley, especially across eastern Tennessee where the elevation difference between the Valley and the Plateau was the greatest. Of the 29 events that occurred with a prefrontal trough in this study, only four events had a significant tornado in the Valley of eastern Tennessee (one of these events was the 3-4 April 1974 outbreak where, even in that case, a relative minimum of tornadoes was observed in the Valley). It is possible that higher lifted condensation level (LCL) heights over the Valley compared with the Plateau and Mountains may help to limit the development of significant tornadoes with prefrontal trough events in the Valley. Previous research (Rasmussen and Blanchard 1998; Rasmussen 2003) has determined that LCL heights are an important parameter for forecasting significant tornadoes. However, further research with mesoscale data would be needed to determine any significant conclusions regarding the exact cause of the decrease in the occurrence of significant tornadoes in the Valley with prefrontal trough events.
- An examination of the 500-hPa charts revealed that most events (63%) were associated with southwest flow (210 to 2500). Around a fourth (26%) of the events had 500-hPa flow from the west (260 to 2800), but only a few events had 500-hPa flow from the south (160 to 2000; 6%) and northwest (290 to 3300; 4%). The four northwest flow events mainly occurred during the summer months (three of the four events). Previous research (Giordano and Fritsch 1991; Johns 1982) has also shown that northwest flow events are primarily a summer phenomenon with a major axis stretching from the upper Mississippi River valley to the Mid-Atlantic region (just north of the southern Appalachian region). It is worth noting, however, that these studies covered severe weather in general and were not confined to tornadoes. In this study, northwest flow events produced a significant tornado mainly in the Mountains (three of the four events), with the one exception producing a significant tornado in the Valley. The Valley northwest flow event also had surface winds from the northwest, while the three Mountain events had southwest winds at the surface. None of the outbreak events in this study occurred with northwest flow. Considering the eight outbreak events, the typical 500-hPa flow was from the southwest (five events), while two events had flow from the south and only one event had flow from the west. The lack of northwest 500-hPa flow events in this study prevented any statistically significant conclusions regarding the wind shear hypothesis (posed in the introduction) regarding Plateau versus Valley significant tornadoes. However, it was interesting to find that four of the six significant tornado events that occurred in the Mountains were associated with west or northwest 500-hPa flow. The orientation of the Mountains along a southwest-northeast axis may be a contributing factor in this observation, but additional research with mesoscale data would be needed before making any significant conclusions.
- c. Synoptic-scale analyses often used in forecasting significant tornadoes
- The dewpoints from the most representative observation sites were examined from the individual surface charts to determine their range. Around 85% of the dewpoints were found to be between 14.5 and 21.1 0C (58 and 70 0F), while around 55% were between 15.5 and 18.9 0C (60 and 66 0F). The lowest dewpoint observed was 9.5 0C (49 0F; on 26 March 1955) and the highest was 24 0C (75 0F; on 12 August 1964). An examination of the eight outbreak events revealed that dewpoints were comparatively warmer (between 15.5 and 20.5 0C (60 and 69 0F)), with the exception of the 21 February 1993 outbreak event where dewpoints were between 12.2 and 15.0 0C (54 and 59 0F). An examination of 850-hPa charts revealed that most events had 850-hPa dewpoints between 8 and 13 0C (75%), with the lowest observed around -1 0C on both 8 and 13 March 1961 (although these are suspect since they are 7 0C outliers). The 850-hPa charts from only the outbreak events revealed that 850-hPa dewpoints were typically between 10 and 15 0C (six of the eight events). The outbreak events on 21 February 1993 and 4 April 1989 were the only two events with observed 850-hPa dewpoints (around 8 0C each) outside of the typical range for outbreak events.
- Of the 93 events for which 500-hPa charts were available, the pattern was cyclonic in 68 (73%) of the cases. The troughs were mainly neutral tilted (41; 44%), while 14 were positive tilted (15%), and 13 were negative tilted (14%). In addition, there were 19 events (20%) where the 500-hPa trough was intense enough to include a closed low. This closed low was typically located over the central plains or mid Mississippi River valley. Of the 500-hPa troughs with the eight outbreak events, three were positive tilted, one negative tilted, and one neutral tilted. In three cases (including the superoutbreak), the 500-hPa troughs were intense enough to include a closed 500-hPa low over the southern or central plains. It can be seen that a tilted 500-hPa trough (either positive or negative) or one intense enough to include a closed low was not necessarily a reliable predictor of a significant tornado event in the southern Appalachian region. However, the eight outbreak events occurred mainly with either a positive-tilted 500-hPa trough or a closed 500-hPa low.
- Of the 90 total events with available 300- or 250-hPa charts, 83 (92%) were located near a jet streak. Of the 80 events where it was determined that the southern Appalachian region was located near a particular quadrant, 63 (79%) were found on the right side of the jet streaks with 30 near the entrance region and 33 near the exit region. Only 17 events (21%) were found on the left side of the jet streaks, with 16 near the exit region and only one near the entrance region. Around 54% of the significant tornado events in the southern Appalachian region (or 61% of those near jet streaks) occurred near the exit region of an upper-level jet streak. All eight outbreak events in this study were located near a 300- or 250-hPa jet streak, with seven events found on the right side of the jet streaks and only one on the left side. Four outbreak events occurred near the right-exit region, three events near the right-entrance region, one event near the left-exit region, while none occurred near the left-entrance region. These findings were similar to those of Rose et al. (2004) who found that tornadoes occurred primarily under the exit regions of upper-level jet streaks. In contrast to their findings, however, it is worth noting that significant tornadoes in the southern Appalachian region seem to favor the right side of the jet streak. Overall, the 300- and 250-hPa charts revealed that severe weather in the southern Appalachian region does not necessarily occur under the right-entrance and left-exit regions of a jet streak, where rising motion is expected to be most intense with straight jet streaks (Namias and Clapp 1949).
- d. Composite maps of significant tornado events versus weak tornado events
- Composite maps of all significant tornado events (Fig. 5) revealed that an area of low pressure (~1006 hPa) was normally centered over the Midwest with an associated cold front extending south across west Tennessee and the lower Mississippi River valley. At the surface across the southern Appalachian region, winds were typically from the southwest averaging 5.5 to 6.5 m s-1 (11 to 13 kt) and temperatures averaged between 16.5 and 18.5 0C (62 and 65 0F). The 850-hPa composites revealed a trough across the Great Lakes region with southwest winds averaging 14 to 15 m s-1 (27 to 29 kt) and temperatures between 11 and 13 0C across the southern Appalachian region. At 500 hPa, southwest winds averaging between 26 and 28 m s-1 (51 and 54 kt) were normally observed ahead of a neutral-tilted trough over the Mississippi River valley. At 250 hPa, the southern Appalachian region was normally located to the right of a jet streak (averaging 37.5 to 39 m s-1 or 73 to 76 kt), with southwest winds stretching from the southern plains to the northeast United States.
- Composite maps of the eight outbreak events (Fig. 6) revealed a deeper area of low pressure (~1000 hPa) over the Midwest compared with the composites for all significant tornado events. This deeper low was associated with stronger southwest winds at the surface and slightly warmer temperatures across the southern Appalachian region (Table 2). A deeper and positive-tilted 850-hPa trough was normally observed with the outbreak events across the western Great Lakes region, also resulting in stronger southwest 850-hPa winds and slightly warmer 850-hPa temperatures across the southern Appalachian region. A deeper and slightly positive-tilted 500-hPa trough was normally observed west of the Mississippi River valley, also producing stronger southwest winds across the southern Appalachians. At 250 hPa, the southern Appalachian region was normally located near the right-exit region of a stronger jet streak over the southern plains and lower Mississippi River valley. Overall, outbreak events contained warmer low-level thermal profiles and stronger wind fields when compared with the nonoutbreak significant tornado events (Table 2).
- When the significant tornado composites were compared with the composites of weak tornado events (Fig. 7), the overall patterns between the two composites appeared similar. However, the significant tornado composites revealed a deeper surface low and deeper upper-level troughs. As a result, wind speeds during the weaker tornado events were weaker than during the significant tornado events (Table 2). Also, the 250-hPa jet streak with the weak tornado composite was weaker and located further northeast, away from the southern Appalachian region. The thermal profile comparisons between weak and significant tornado events revealed warmer surface and 850-hPa temperatures and dewpoints with the weak tornado events. These findings suggested that weak tornado events in the southern Appalachian region occurred more frequently during the warmer months (with weaker wind fields), while the significant tornado events occurred more frequently during the cooler months (with stronger wind fields). A histogram of the weak and significant tornado events in the southern Appalachian region (Fig. 8) revealed that significant tornado events outnumbered or nearly equaled weak tornado events between November and April. However, weak tornado events greatly outnumbered significant tornado events from May through October.
- Because sounding forecast parameters were unavailable for this study but are important in diagnosing tornado potential, additional composites were constructed in order to form proxy measures of instability and shear parameters. Temperature and moisture composites from the significant tornado events (Fig. 9) revealed a lifted index around -2 (by examining the surface temperatures, 1000-hPa specific humidity, and 500-hPa temperatures together) and a Showalter index around +1 (by examining the 850-hPa temperatures, 850-hPa dewpoints, and 500-hPa temperatures together) was typically in place across the southern Appalachian region. Temperature and moisture composites from the outbreak events (Fig. 10) revealed very similar instability parameters with a lifted index around -2 and a Showalter index around 0 across the southern Appalachian region. The lower Showalter index suggested that slightly more instability above 850 hPa may have been present with the outbreak events compared with all significant tornado events. The weak tornado event composites (Fig. 11) revealed a slightly more unstable air mass than the significant tornado and outbreak events with a lifted index around -3. However, the Showalter index was around +3, which suggested that more instability may have been present in the lowest layers near the surface with a more stable airmass above 850 hPa. An examination of the wind speed composites from all significant tornado events (Fig. 12), outbreak events (Fig. 13), and weak tornado events (Fig. 14) revealed that the strongest vertical wind profiles observed with the outbreak events and the weakest profiles observed with the weak tornado events accounted for a large part of the distinction between these type of events.
4. CONCLUSIONS
- In this study, individual surface charts for each event revealed that the most significant differences in the wind direction and dewpoints were tied primarily to surface boundaries rather than to large-scale physiographic terrain features. When comparing the occurrence of surface boundaries with the different terrain features, it was seen that events associated with prefrontal troughs (which were the most numerous class of events in this study) produced significant tornadoes almost exclusively over the Plateau and Mountains, with very few prefrontal trough events producing significant tornadoes in the Valley of eastern Tennessee. The lack of significant tornadoes in the Valley may reflect the higher LCL heights presumably present in this region relative to the Plateau and Mountains, but further research using mesoscale data is needed before any significant conclusions may be made regarding this finding. An examination of the 500-hPa flow compared with the location of significant tornadoes within the different terrain features revealed that northwest flow events produced significant tornadoes almost exclusively in the Mountains and during the summer. However, with only four northwest flow events observed in this study, it was impossible to determine whether this was a consistent pattern. Most significant tornado events across both the Plateau and Valley occurred in association with southwest 500-hPa flow. These findings refuted the initial hypothesis that northwest 500-hPa flow may produce tornadoes mainly in the Valley with southwest 500-hPa flow producing tornadoes mainly across the Plateau. Future research with mesoscale data should examine weak tornado events to determine whether this Valley versus Plateau hypothesis could be valid for weak tornado events and whether northwest 500-hPa flow events also produce weak tornadoes mainly in the Mountains.
- When examining the synoptic-scale techniques often used in forecasting potentially tornadic environments, it was found that the 500-hPa flow with most significant tornado events was from the southwest ahead of a neutral-tilted trough. This finding indicated that the particular tilt of a 500-hPa trough does not necessarily enhance the formation of significant tornadoes in the southern Appalachian region. However, most of the outbreak events occurred with southwest 500-hPa flow ahead of a positive-tilted 500-hPa trough. At 300 or 250 hPa, most of the significant tornado events were located on the right side of a jet streak, with an even split between the entrance and exit regions. This finding indicated that significant tornado events in the southern Appalachian region did not necessarily favor the right-entrance or left-exit regions of a jet streak, where rising motion is expected to most intense (with straight jet streaks). A comparison of the composite maps between weak, significant, and outbreak tornado events revealed that wind dynamics were more important than instability in the distinction between weak and significant tornado events across the southern Appalachian region.
- Although this study focused on synoptic-scale data in the examination of significant tornado environments and their relationship to the large-scale terrain features of the southern Appalachian region, it has become clear that mesoscale data would be needed to make any firm conclusions regarding possible terrain enhancement or hindrance on significant tornado development. Additional future research should concentrate on using mesoscale data (such as radar data, hourly surface mesonet data, and model data) to conduct a detailed study on the temporal evolution of several significant tornado events in the southern Appalachian region. Also, those events where numerous supercell storms were observed without tornado occurrences should be investigated to further examine the effects of terrain on tornado development (especially in regards to the Plateau versus Valley difference in tornado occurrences).
5. ACKNOWLEDGMENTS
- The authors thank Scott Stephens at NCDC for providing the numerous surface and upper-air charts used in this study as well as access to the WSSRD Web site. Also, thanks to John Hart at the Storm Prediction Center for his SeverePlot program used to plot the tornado tracks, and to Howard Waldron for his help in retrieving the Storm Data information.
6. REFERENCES
- Concannon, P. R., H. E. Brooks, and C. A. Doswell III, 2000: Climatological risk of strong to violent tornadoes in the United States. Preprints, Second Symposium on Environmental Applications, Long Beach, CA, Amer. Meteor. Soc., 212-219.
- Garinger, L. P., and K. R. Knupp, 1993: Seasonal tornado climatology for the southeastern United States. The Tornado: Its Structure, Dynamics, Prediction, and Hazards. Geophys. Monogr., No. 79, Amer. Geophys. Union, 445-452.
- Giordano, L. A., and J. M. Fritsch, 1991: Strong tornadoes and flash-flood-producing rainstorms during the warm season in the Mid-Atlantic region. Wea. Forecasting, 6, 437-455.
-
- Johns, R. H., 1982: A synoptic climatology of northwest flow severe weather outbreaks. Part 1: Nature and significance. Mon. Wea. Rev., 110, 1653-1663.
- _________, and C. A. Doswell III, 1992: Severe local storms forecasting. Wea. Forecasting, 7, 588-612.
- Kalnay, E., and Coauthors, 1996: The NCEP/NCAR reanalysis 40-year project. Bull. Amer. Meteor. Soc., 77, 437-471.
- Namias, J., and P. F. Clapp, 1949: Confluence theory of the high tropospheric jet stream. J. Meteor., 6, 330-336.
- Rasmussen, E. N., 2003: Refined supercell and tornado forecast parameters. Wea. Forecasting, 18, 530-535.
- ____________, and D. O. Blanchard, 1998: A baseline climatology of sounding-derived supercell and tornado forecast parameters. Wea. Forecasting, 13, 1148-1164.
- Rogash, J. A., 1995: The relationship between longer-lived surface boundaries and low pressure centers with the occurrence of strong to violent tornadoes. Natl. Wea. Dig., 20:2, 30-33.
- Rose, S. F., P. V. Hobbs, J. D. Locatelli, and M. T. Stoelinga, 2004: A 10-yr climatology relating the locations of reported tornadoes to the quadrants of upper-level jet streaks. Wea. Forecasting, 19, 301-309.
Table 1. Significant tornado (F2 or greater) events across the southern Appalachian region from 1950 to 2003 (outbreak events in boldface).
| Date |
Time (UTC) |
F scale (No.) |
Counties Affected |
| 14 Feb 1952 |
0440-0500 |
3 (1), 4 (1) |
Franklin, Grundy, TN |
| 29 Feb - 1 Mar 1952 |
2240-0130 |
2 (3), 3 (1) |
DeKalb, AL; Banks, GA; McMinn, Warren, TN |
| 10 May 1952 |
2000 |
3 (1) |
Greenville, SC |
| 20 Jan 1953 |
2341 |
2 (1) |
Warren, TN |
| 2 May 1953 |
0815-0910 |
2 (1), 4 (1) |
Anderson, McMinn, Meigs, TN |
| 5 Dec 1954 |
2100 |
2 (1) |
Bartow, GA |
| 6 Mar 1955 |
0100 |
2 (1) |
Hawkins, TN |
| 25 Mar 1955 |
2330 |
2 (1) |
Jefferson, TN |
| 18 Feb 1956 |
0630 |
2 (1) |
Walker, GA |
| 7 Mar 1956 |
1430 |
2 (1) |
Overton, TN |
| 23 Jan 1957 |
0230 |
2 (1) |
Coffee, TN |
| 8 Apr 1957 |
1200-2130 |
2 (3) |
Gordon, GA; Cumberland, Washington, TN |
| 18 Nov 1957 |
2230-2245 |
2 (2) |
Chattooga, Floyd, Gordon, GA; Fentress, TN |
| 6 Apr 1958 |
0603 |
3 (1) |
Jackson, AL |
| 27 Mar 1959 |
0010 |
3 (1) |
Coffee, TN |
| 8 Mar 1961 |
0745 |
2 (1) |
Catoosa, GA |
| 13 Mar 1961 |
2240 |
3 (1) |
Warren, TN |
| 21 Mar 1962 |
0820 |
3 (1) |
Cherokee, GA |
| 11 Apr 1962 |
1330 |
2 (1) |
Cherokee, GA |
| 12 Mar 1963 |
0000-0300 |
2 (3) |
Cocke, Marion, Warren, TN |
| 20 Mar 1963 |
0015-0030 |
2 (2) |
Bradley, McMinn, TN |
| 25 Jan 1964 |
0300 |
2 (1) |
DeKalb, AL |
| 7 Apr 1964 |
1510 |
2 (1) |
DeKalb, AL |
| 12 Aug 1964 |
0930 |
2 (1) |
Sequatchie, TN |
| 9 Apr 1965 |
0845 |
2 (1) |
Avery, NC |
| 15-16 Apr 1965 |
1950-0100 |
2 (3), 3 (3) |
DeKalb, Jackson, AL; Pickens, GA; Bradley, Cumberland, Fentress, Knox, TN |
| 26 Apr 1965 |
0630 |
2 (1) |
Cherokee, GA |
| 10 Dec 1966 |
0930 |
2 (1) |
Stephens, GA |
| 12 Mar 1967 |
1130 |
2 (1) |
Greene, TN |
| 22 Apr 1967 |
1305 |
2 (1) |
Greene, TN |
| 3 May 1967 |
0010 |
2 (1) |
Greenville, SC |
| 18 Dec 1967 |
2215 |
2 (1) |
Floyd, GA |
| 30 May 1968 |
0100 |
2 (1) |
Floyd, GA |
| 2 Apr 1970 |
1000 |
3 (1) |
Forsyth, GA |
| 19 Jul 1970 |
1900 |
2 (1) |
Bartow, GA |
| 15 May 1972 |
0230 |
2 (1) |
Fentress, TN |
| 28 Jun 1972 |
1900 |
2 (1) |
Cumberland, TN |
| 15 Mar 1973 |
0800 |
2 (1) |
White, TN |
| 16 Mar 1973 |
1925-1937 |
2 (2) |
Chattooga, Gordon, GA |
| 1 Apr 1973 |
0100 |
2 (1) |
Pickens, SC |
| 8 May 1973 |
1010 |
2 (1) |
DeKalb, AL |
| 19-20 May 1973 |
2215-0045 |
2 (1), 4 (1) |
DeKalb, Jackson, AL |
| 27-28 May 1973 |
2015-0330 |
2 (4), 3 (1) |
Jackson, AL; Greenville, Oconee, Pickens, SC |
| 21 Nov 1973 |
1430 |
2 (1) |
Stephens, GA |
| 13 Dec 1973 |
1350-1720 |
2 (1), 3 (1) |
Hall, GA; Polk, TN |
| 29 Dec 1973 |
2315 |
2 (1) |
DeKalb, AL |
| 21 Mar 1974 |
0640 |
2 (1) |
Polk, TN |
| 3-4 Apr 1974 |
1800-1300 |
2 (11), 3 (9), 4 (7), 5 (1) |
Cherokee, Jackson, AL; Bartow, Cherokee, Dawson, Fannin, Gilmer, Gordon, Lumpkin, Murray, Pickens, Rabun, Whitfield, GA; Caldwell, Cherokee, Graham, Swain, NC; Blount, Bradley, Coffee, Cumberland, DeKalb, Fentress, Franklin, Loudon, McMinn, Monroe, Morgan, Overton, Pickett, Polk, Putnam, Scott, Warren, White, TN |
| 8 Apr 1974 |
1715 |
3 (1) |
McMinn, TN |
| 11 Jan 1975 |
0230 |
2 (1) |
Transylvania, NC |
| 24 Apr 1975 |
2130 |
2 (1) |
Cumberland, TN |
| 18 May 1975 |
0700 |
2 (1) |
Rutherford, NC |
| 18 Feb 1976 |
1907 |
2 (1) |
Cocke, TN |
| 15 May 1976 |
0310-0315 |
2 (2) |
Banks, Habersham, GA |
| 29 Jun 1976 |
0030 |
2 (1) |
Jackson, NC |
| 30 Mar 1977 |
1415-1630 |
2 (3), 3 (1) |
DeKalb, AL; Gilmer, Gordon, GA |
| 4 Apr 1977 |
1820-2115 |
2 (1), 3 (1) |
Jackson, AL; Floyd, GA |
| 23 Mar 1979 |
2130 |
2 (1) |
Greenville, SC |
| 24 May 1979 |
2157 |
2 (1) |
Burke, NC |
| 13 Apr 1980 |
2358 |
2 (1) |
Greenville, SC |
| 28 Apr 1980 |
2305 |
2 (1) |
Monroe, TN |
| 6 Jul 1980 |
1900 |
2 (1) |
Hancock, TN |
| 10 Jul 1980 |
1830 |
3 (1) |
Unicoi, TN |
| 26 Apr 1982 |
2215 |
2 (1) |
Bartow, GA |
| 19 May 1983 |
2215 |
3 (1) |
DeKalb, AL |
| 7 May 1984 |
2320 |
2 (1) |
Loudon, TN |
| 6 Apr 1985 |
0035-0105 |
2 (2) |
Cherokee, Pickens, GA |
| 6 Feb 1986 |
2218-2238 |
3 (1) |
Bradley, McMinn, Polk, TN |
| 10 May 1988 |
0025-0033 |
2 (1) |
DeKalb, Jackson, AL |
| 4 Apr 1989 |
1822-2155 |
2 (10) |
Banks, Bartow, Cherokee, Floyd, Habersham, Hall, GA; Greenville, Oconee, SC |
| 5 May 1989 |
2100-2328 |
2 (2), 4 (1) |
Stephens, GA; Caldwell NC, Rutherford, NC |
| 16 Nov 1989 |
0005-0030 |
2 (1), 3 (1) |
Floyd, Habersham, GA |
| 22 Nov 1992 |
1400-1810 |
2 (3), 3 (1), 4 (1) |
DeKalb, AL; Cherokee, Dade, Lumpkin, White, GA |
| 21 Feb 1993 |
1952-2400 |
3 (5) |
Cherokee, AL; Anderson, Blount, Knox, Loudon, McMinn, Monroe, Putnam, Roane, TN |
| 27-28 Mar 1994 |
1730-0004 |
2 (1), 3 (6), 4 (2) |
Cherokee, DeKalb, AL; Bartow, Cherokee, Dawson, Floyd, Gordon, Habersham, Lumpkin, Pickens, Rabun, White, GA; Oconee, SC |
| 15 Apr 1994 |
1630-1640 |
3 (1) |
Bradley, Hamilton, McMinn, Meigs, TN |
| 27 Jun 1994 |
0030-0430 |
2 (3) |
Oconee, SC; Grundy, Sequatchie, TN |
| 16 Feb 1995 |
1131 |
2 (1) |
DeKalb, AL |
| 21 Apr 1995 |
0625 |
2 (1) |
Hamilton, TN |
| 18 May 1995 |
2223-2321 |
3 (1), 4 (1) |
Jackson, AL; Cumberland, TN |
| 16 Mar 1996 |
2205 |
2 (1) |
Overton, TN |
| 7 Nov 1996 |
2200 |
2 (1) |
Franklin, TN |
| 24 Jan 1997 |
2323-2348 |
2 (2) |
DeKalb, TN |
| 29 Mar 1997 |
0355-0630 |
2 (2), 3 (2) |
Bradley, Hamilton, Overton, Sequatchie, TN |
| 22 Apr 1997 |
2053 |
2 (1) |
DeKalb, AL |
| 2 May 1997 |
2300 |
2 (1) |
Franklin, TN |
| 8 Jan 1998 |
0210 |
2 (1) |
Pickens, SC |
| 20 Mar 1998 |
1125-1135 |
3 (1) |
Hall, White, GA |
| 16 Apr 1998 |
2235 |
3 (1) |
Pickett, TN |
| 7 May 1998 |
2149-2155 |
2 (1), 4 (1) |
Caldwell, McDowell, NC |
| 16 Dec 2000 |
2059 |
3 (1) |
Cherokee, AL |
| 25 Oct 2001 |
0228 |
2 (1) |
Coffee, TN |
| 24 Nov 2001 |
2025-2101 |
2 (2) |
Cherokee, DeKalb, AL |
| 10-11 Nov 2002 |
2350-0720 |
2 (7), 3 (2) |
Cherokee, AL; Bartow, Cherokee, Dawson, Pickens, GA; Anderson, Coffee, Cumberland, Van Buren, TN |
Table 2. Comparison of the composite synoptic conditions between weak (F0 or F1) tornado events, significant (F2 or greater) tornado events, and outbreak (five or more F2 or greater) tornado events across the southern Appalachian region.
| |
Weak |
Significant |
Outbreak |
| |
(156 total events) |
(94 total events) |
(8 total events) |
| Surface temperatures (0C) |
18.5-20.5 |
16.5-18.5 |
18-20 |
| Surface dewpoints (0C) |
17-19 |
15-17 |
16-18 |
| Surface winds (m s-1) |
SW 3.5-4.5 |
SW 5.5-6.5 |
SW 8.5-9.5 |
| 850 hPa temperatures (0C) |
12.5-14 |
11-13 |
12-14 |
| 850 hPa dewpoints (0C) |
9-10 |
8-9 |
10-12 |
| 850 hPa winds (m s-1) |
SW 10-11 |
SW 14-15 |
SW 18-20 |
| 500 hPa trough tilt |
neutral |
neutral |
positive |
| 500 hPa winds (m s-1) |
SW 19-21 |
SW 26-28 |
SW 32.5-37.5 |
| 250 hPa jet quadrant |
none |
right exit |
right exit |
| Lifted index |
-3 |
-2 |
-2 |
| Showalter index |
+3 |
+1 |
0 |
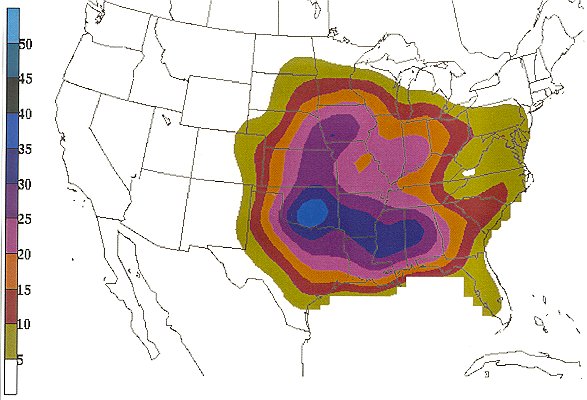
Figure 1. Based on data from 1921 to 1995, mean number of days per century with at least one F2 or greater tornado (from Concannon et al. 2000).
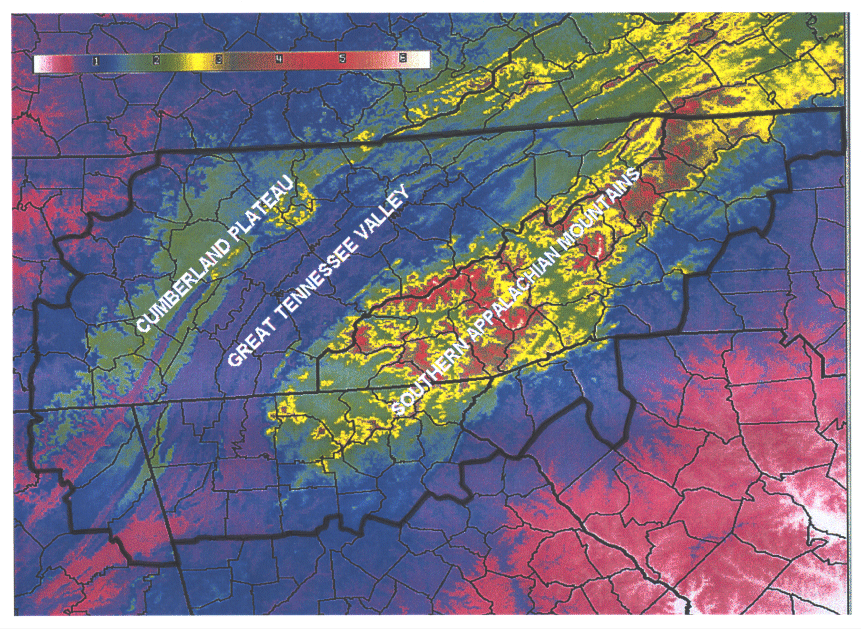
Figure 2. Image of terrain features across the southern Appalachian region (lines denote county boundaries; boldface lines denote state boundaries; boldest line encloses the area of study).
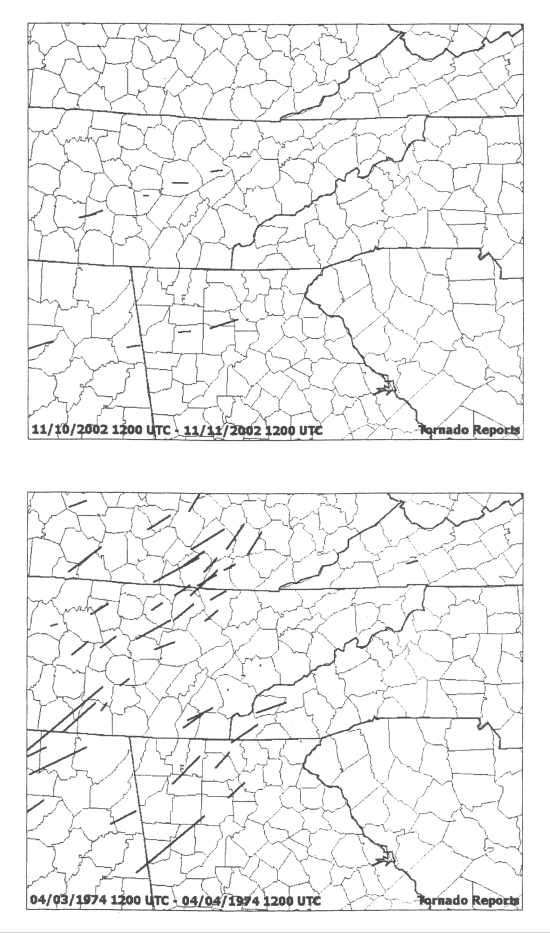
Figure 3. Tracks of significant tornadoes on (top) 10-11 November 2002 and (bottom) 3-4 April 1974.
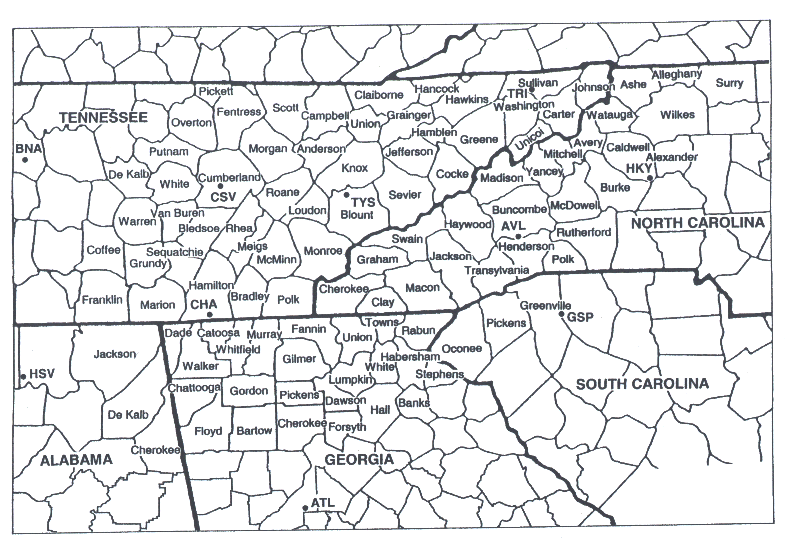
Figure 4. Counties and states used to compose the southern Appalachian region and the locations of the surface observation sites with three-letter identifications (boldface lines denote state boundaries).
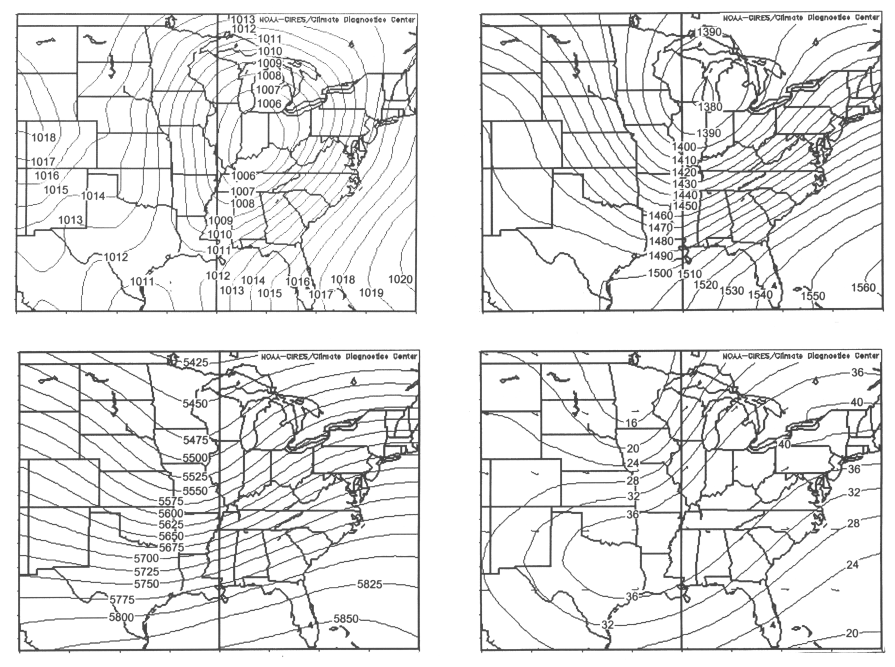
Figure 5. Composite maps from significant tornado events across the southern Appalachian region of (top left) surface isobars (hPa), (top right) 850-hPa isoheights (m), (bottom left) 500-hPa isoheights (m), and (bottom right) 250-hPa isotachs (m s-1).
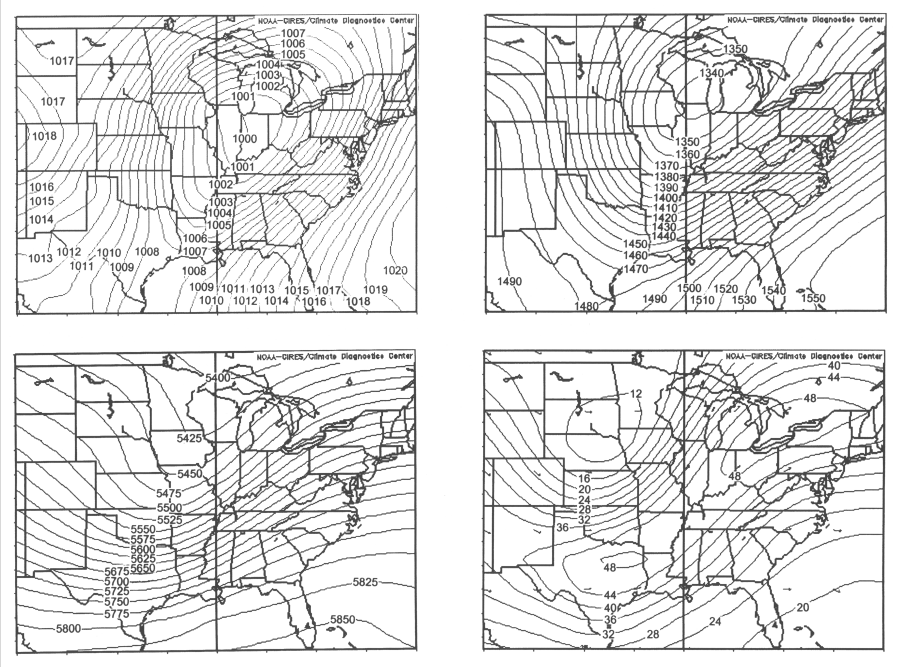
Figure 6. Same as Fig. 5, but from significant tornado outbreak events.
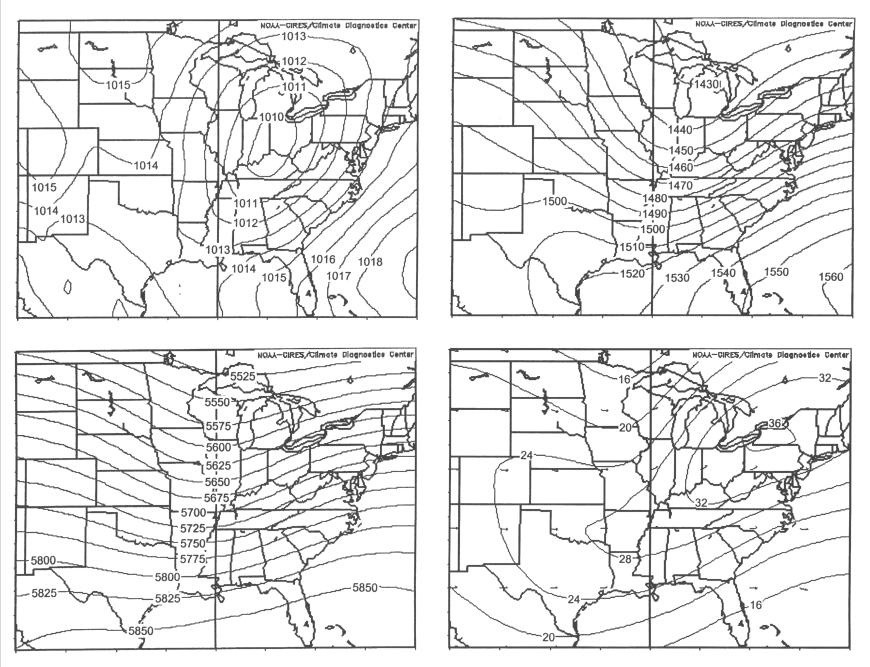
Figure 7. Same as Fig. 5, but from weak tornado events.
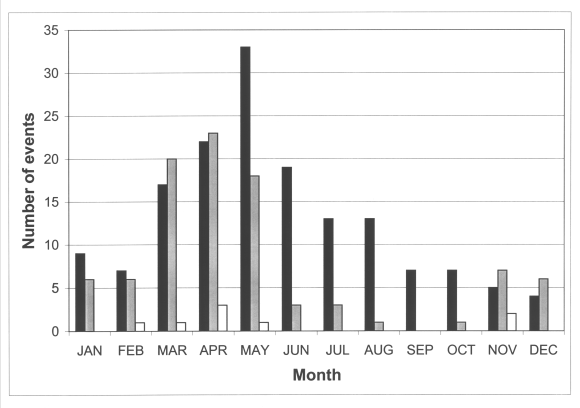
Figure 8. Number of weak (black bars), significant (grey bars), and outbreak (white bars) tornado events across the southern Appalachian region by month.
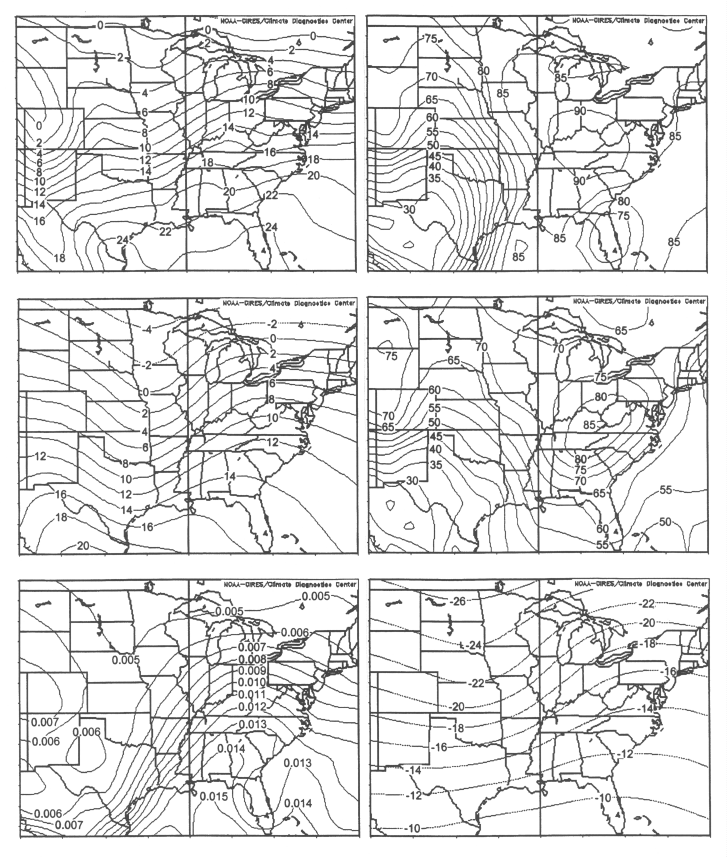
Figure 9. Composite maps from significant tornado events across the southern Appalachian region of (top left) surface temperatures (0C), (top right) surface relative humidity (%), (middle left) 850-hPa temperatures (0C), (middle right) 850-hPa relative humidity (%), (bottom left) 1000-hPa specific humidity (g kg-1), and (bottom right) 500-hPa temperatures (0C).
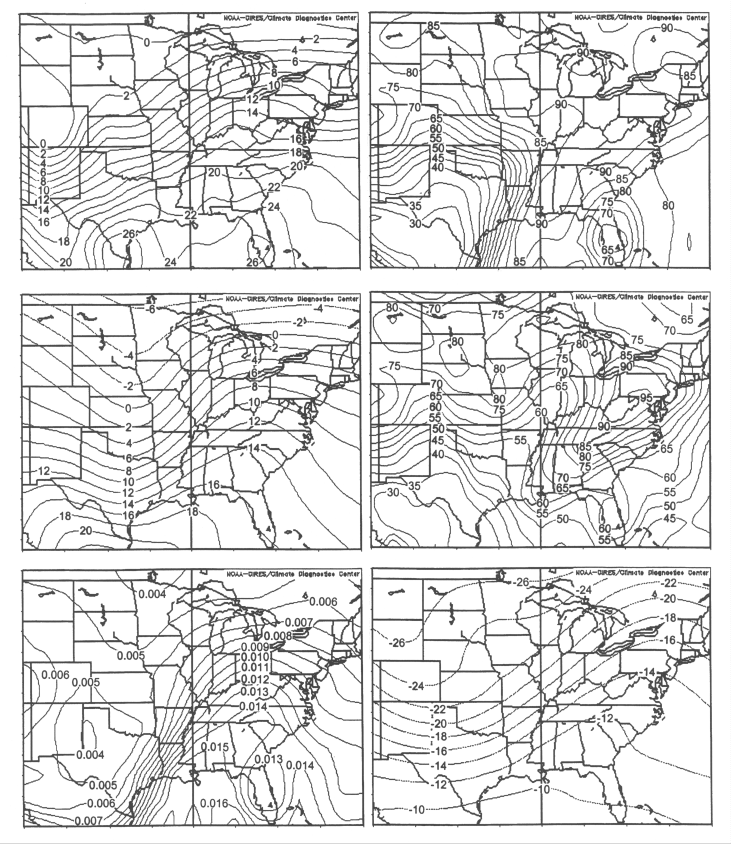
Figure 10. Same as Fig. 9, but from significant tornado outbreak events.
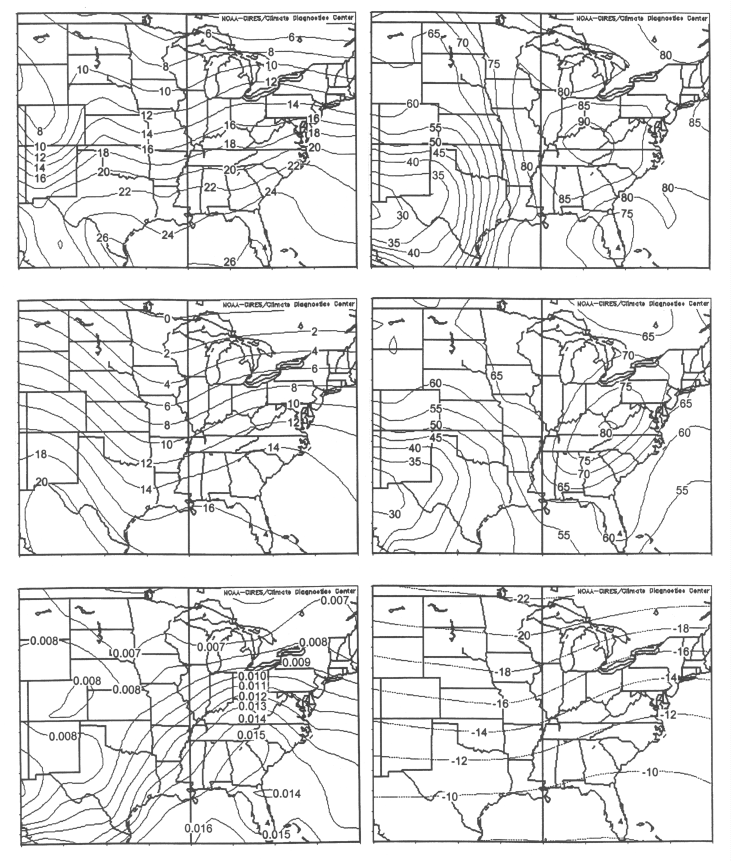
Figure 11. Same as Fig. 9, but from weak tornado events.
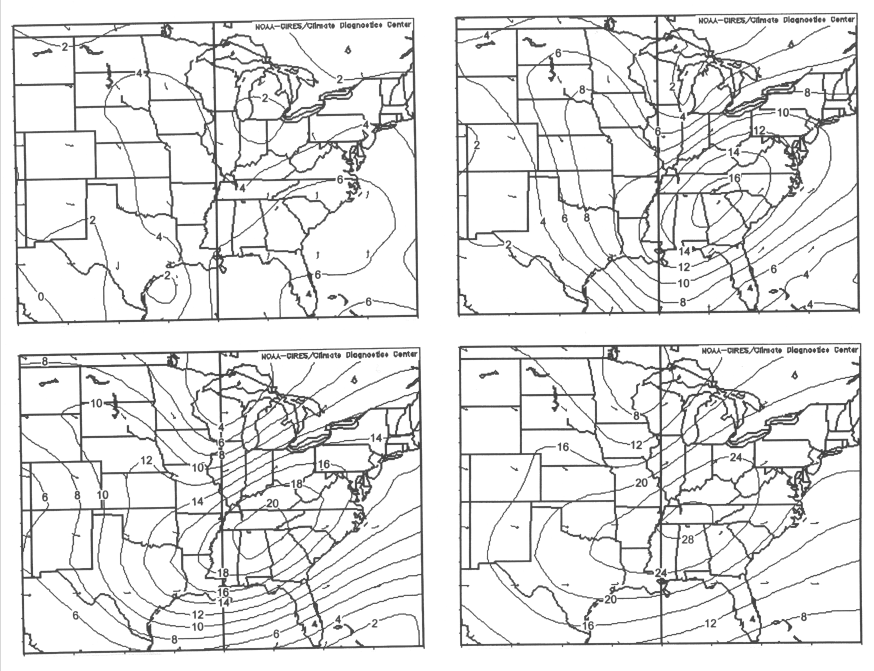
Figure 12. Composite maps from significant tornado events across the southern Appalachian region of (top left) surface wind speeds (m s-1), (top right) 850-hPa wind speeds (m s-1), (bottom left) 700-hPa wind speeds (m s-1), and (bottom right) 500-hPa wind speeds (m s-1).
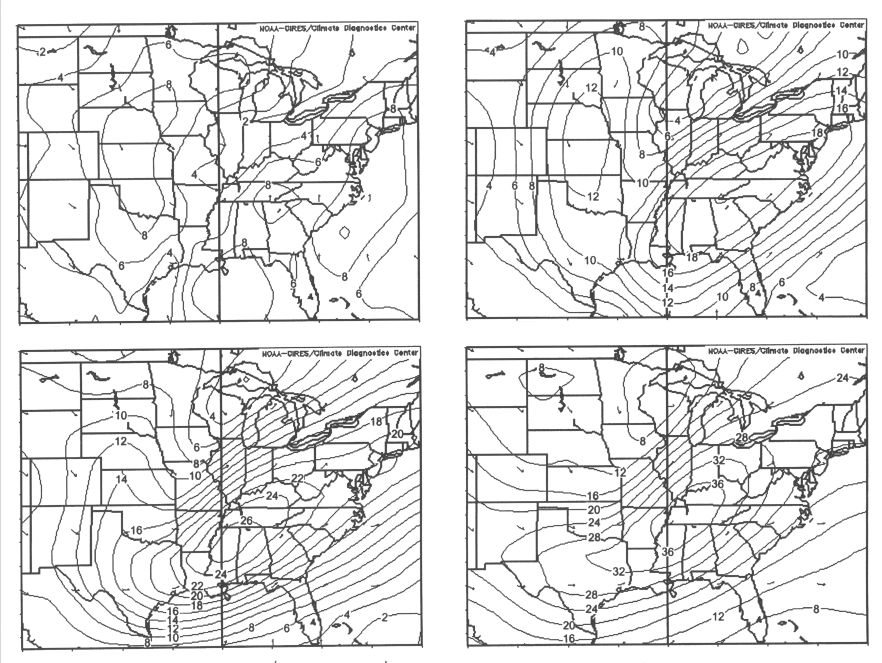
Figure 13. Same as Fig. 12, but from significant tornado outbreak events.
Figure 14. Same as Fig. 12, but from weak tornado events.


 Local Radar
 Huntsville Radar
 Regional Satellite
 Graphical Forecast
 Weather Map
 Daily Graphics
 Follow us on YouTube