
Introduction
During the afternoon and evening of Friday June 29, 2012, an intense, long-lived line of thunderstorms raced eastward at nearly 60 mph from the Midwest to the Mid Atlantic coast. In its wake, these storms left behind a swath of destruction that killed at least 20 people, caused millions in property damage, and caused massive power outages in major urban areas along the storm’s path. Meteorologists use the term “derecho” to describe this special type of violent and long-lived windstorm. Essentially, a “derecho” is a long-lived, rapidly moving line of intense thunderstorms that produces widespread damaging winds in a nearly continuous swath.
Derechos can travel distances well over 250 miles. The derecho on June 29th travelled over 700 miles from its start in Iowa to the East Coast. A derecho on July 4-5, 1999, travelled a distance of 1300 miles stretching from northern Minnesota across southern Canada before weakening as it exited off the coast of Maine. Derechos are best recognized for their propensity to produce damaging winds over a fairly widespread region. They are also commonly prolific lightning producers.
Surface wind gusts of 50 to 75 mph are common with many derechos; some even produce surface wind gusts of over 100 mph. While derechos characteristically produce widespread wind damage in a nearly continuous swath, actual surface winds vary along the track of a derecho. Not all locations within the path of a derecho will experience damage. The highest wind gusts occur with clusters of downbursts from the many thunderstorms that comprise the derecho. Often, narrow corridors, or channels, of higher wind gusts are observed within a derecho. Somewhat analogous to the discontinuous damage observed with tornadoes, where, for example, structures on one side of a residential street might experience damage.
Overview
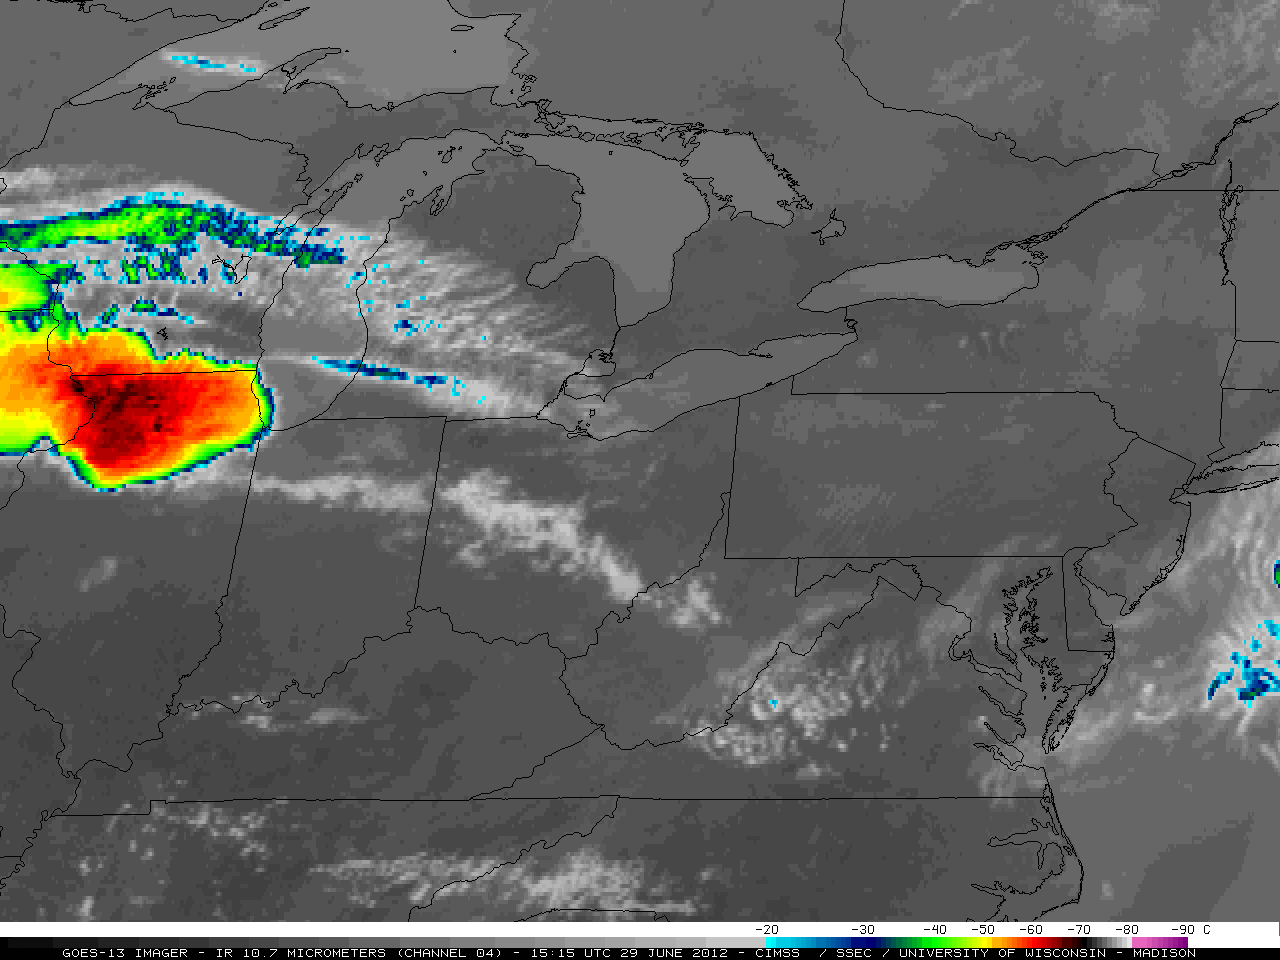


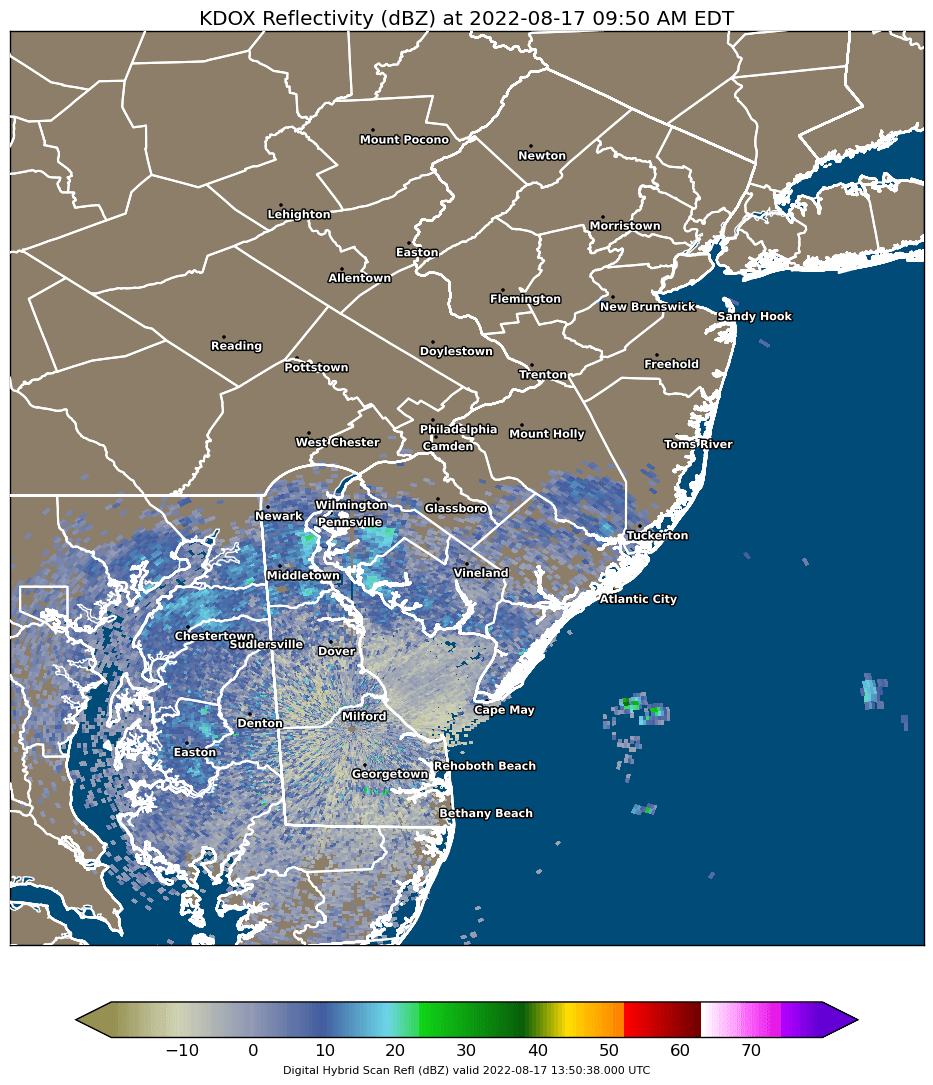
Radar Imagery and Lightning
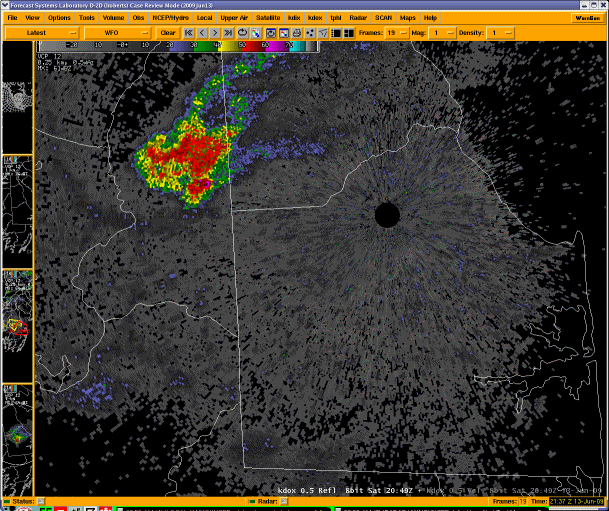


Storm Reports and Other Data


Local Impacts
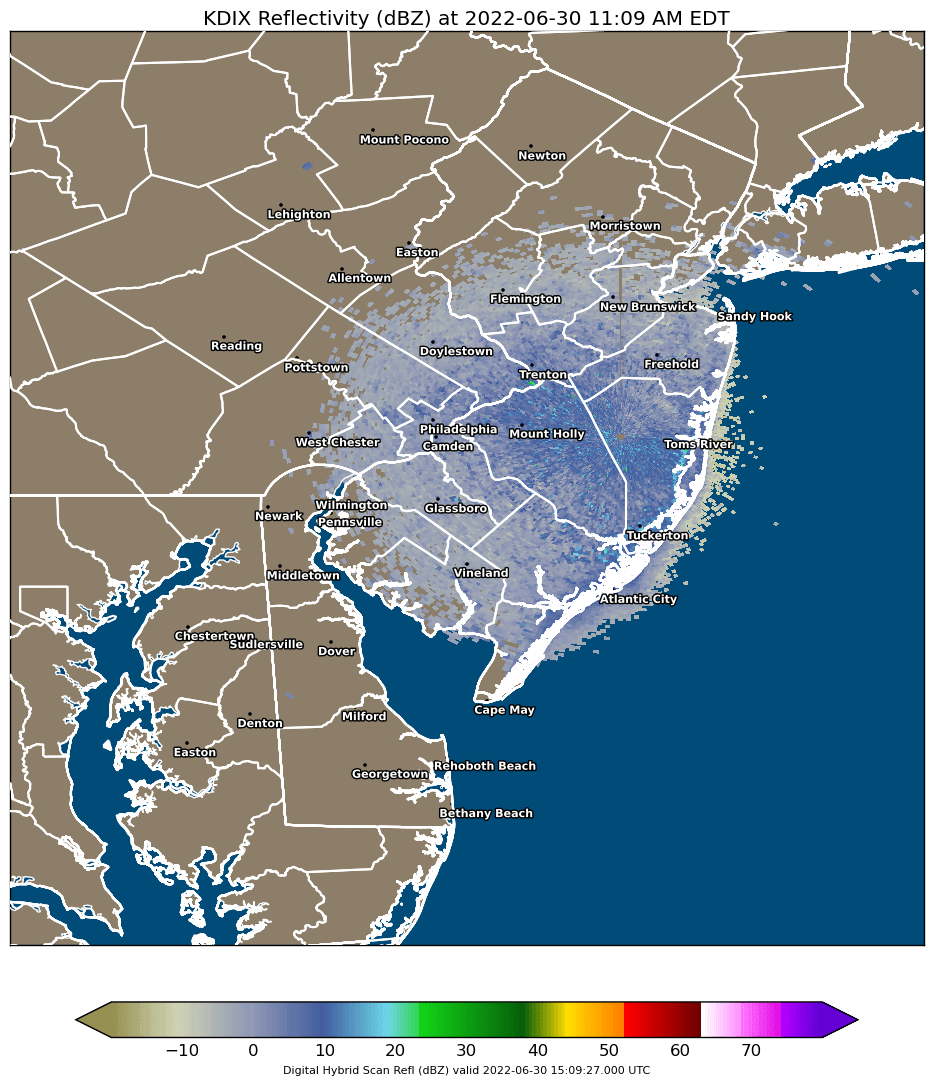
The derecho winds across Maryland’s Eastern Shore and Delaware were produced mostly from an intense gust front that moved well ahead of the rain. The northern end intensified near Baltimore, MD and then moved across northern Delaware and especially southern New Jersey. Intense lightning moved across southern New Jersey along with widespread wind gusts of 60 mph to nearly 90 mph. The intensity and widespread nature of the winds took down numerous trees and power lines. This resulted in hundreds of thousands of customers without power. Some areas did not get power back until at least a week after the storm.
Check out a more detailed version of all Storm Reports provided to our office here
Summary
Derechos are relatively uncommon to this region, especially ones of this magnitude. Typically, the Mid Atlantic region might experience a derecho once every two to four years. The last significant derecho that impacted our area or a portion of it occurred on June 4, 2008. Realize that the vast majority of thunderstorms that impact our region will not be associated with a derecho. But, derechos can occur locally and at any time; tomorrow, next week or next month, or not until several years from now. Monitoring your local National Weather Service forecasts and media outlets is the best way to know if any future derecho or other types of severe weather could impact your location.
Acknowledgements
The wind data and storm reports included in this presentation were obtained via the public, trained spotters, emergency managers, DEOS, NJ Weather Network and Weatherflow


 Coastal Flood
 Marine Forecasts
 Text Products
 Climate Information
 Skywarn
 Submit Storm Report
 Weather Event Archives
 Forecast Discussion
 Emergency Managers
 Briefing Page
 Follow us on YouTube