2017 Phoenix & Yuma Climate Year in Review |
|
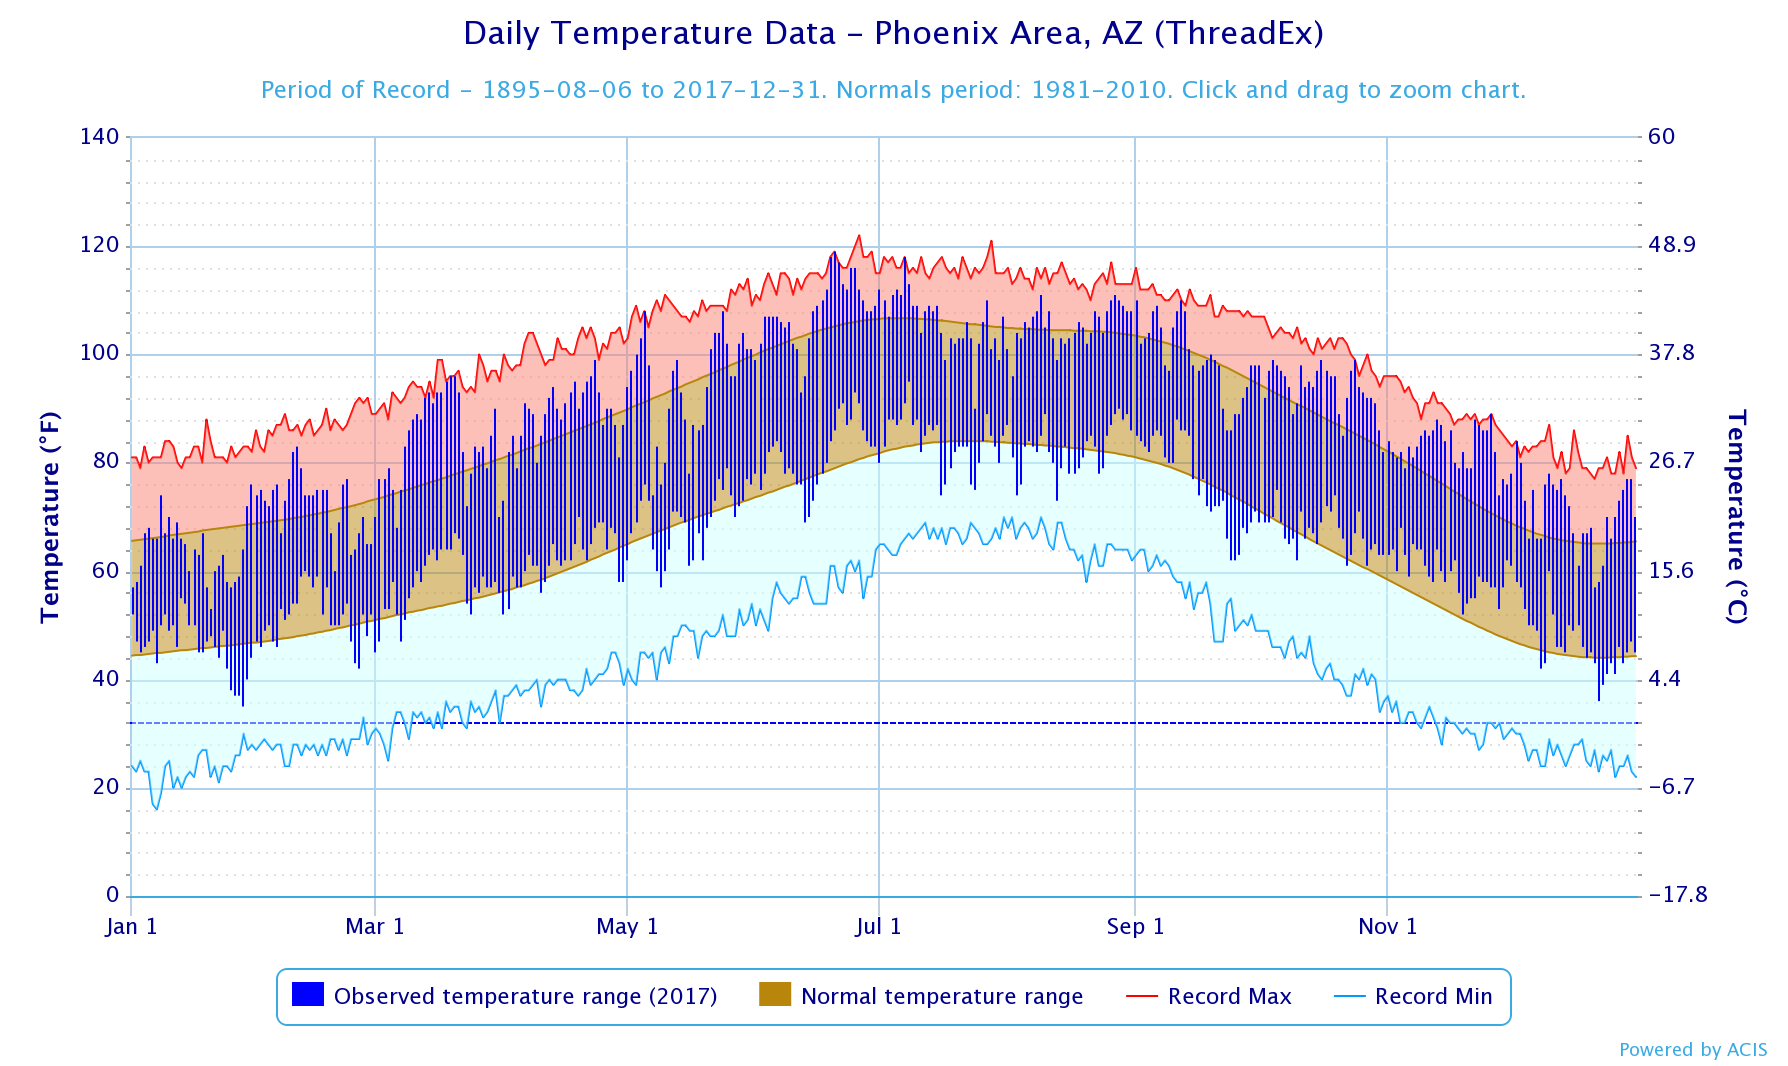
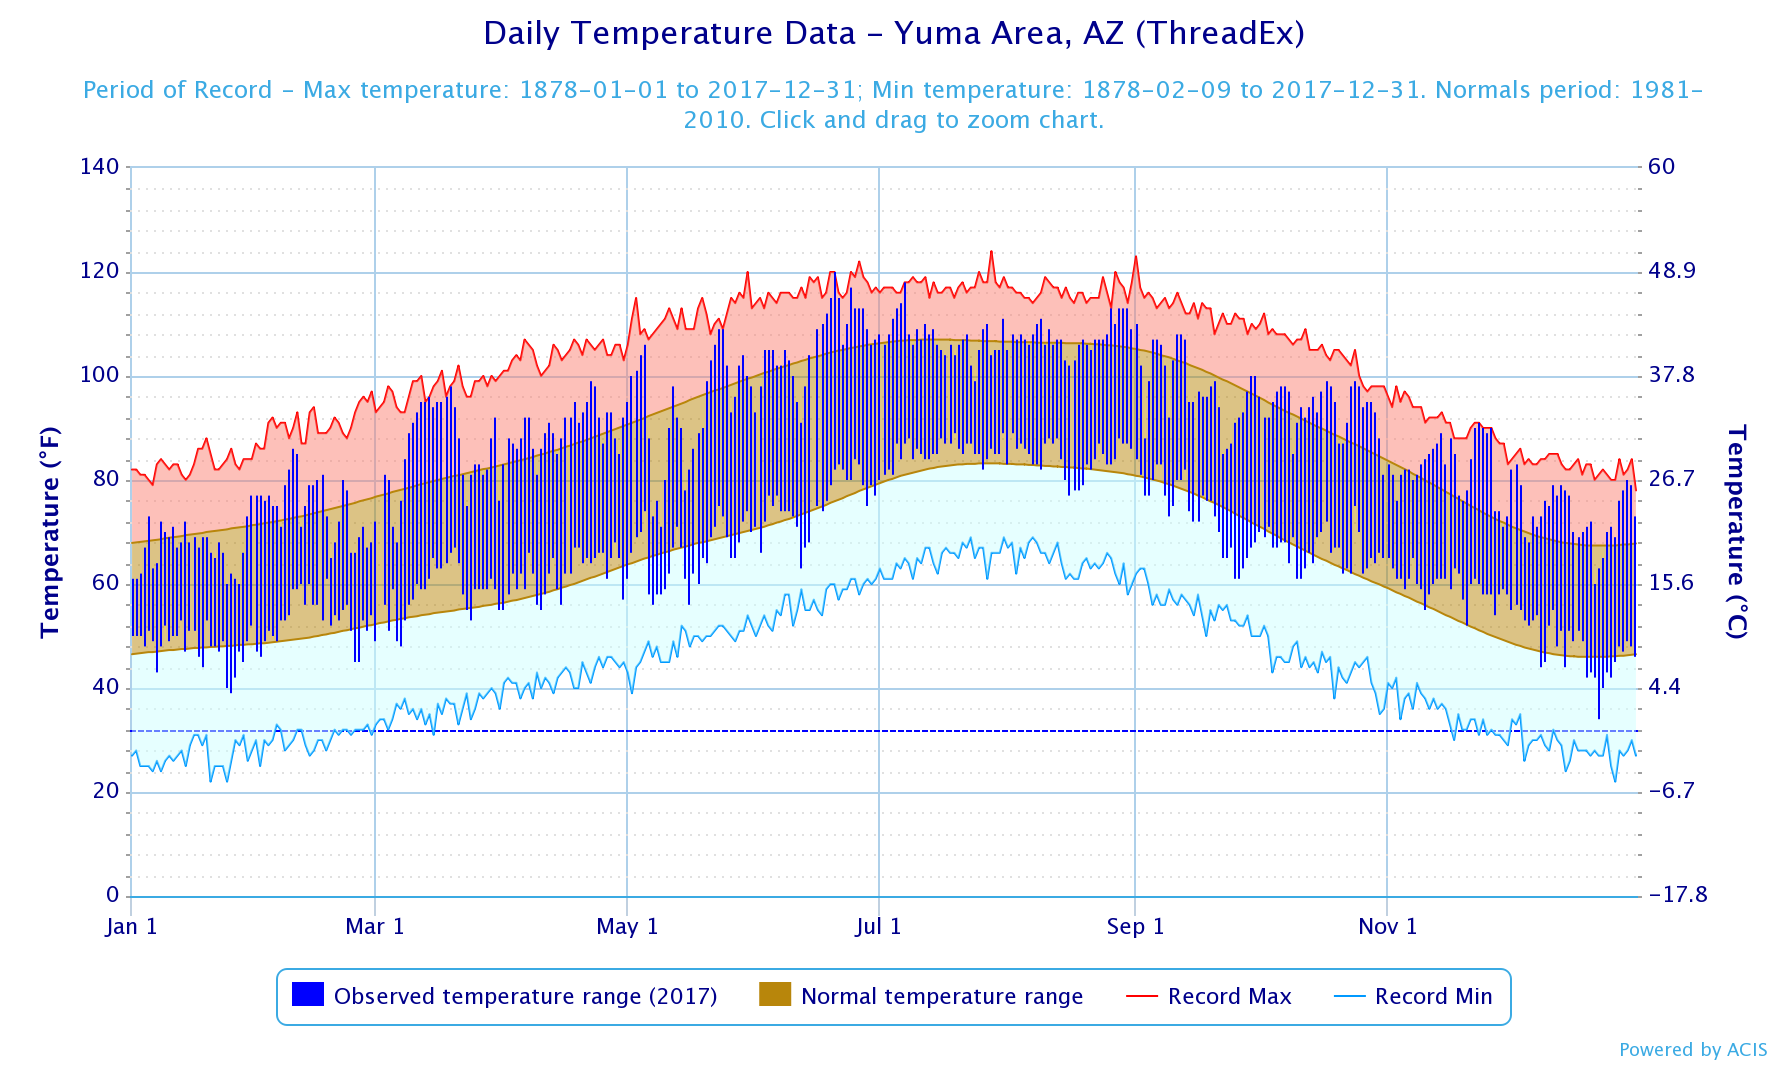
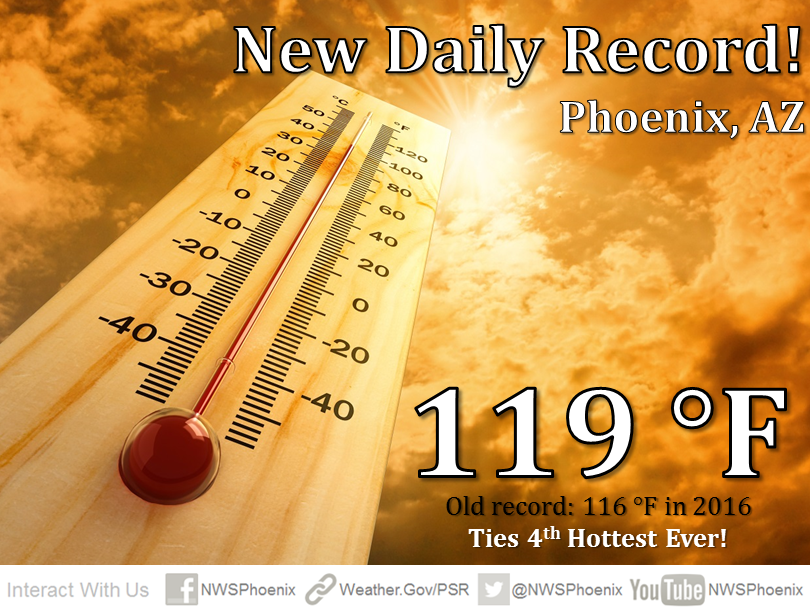
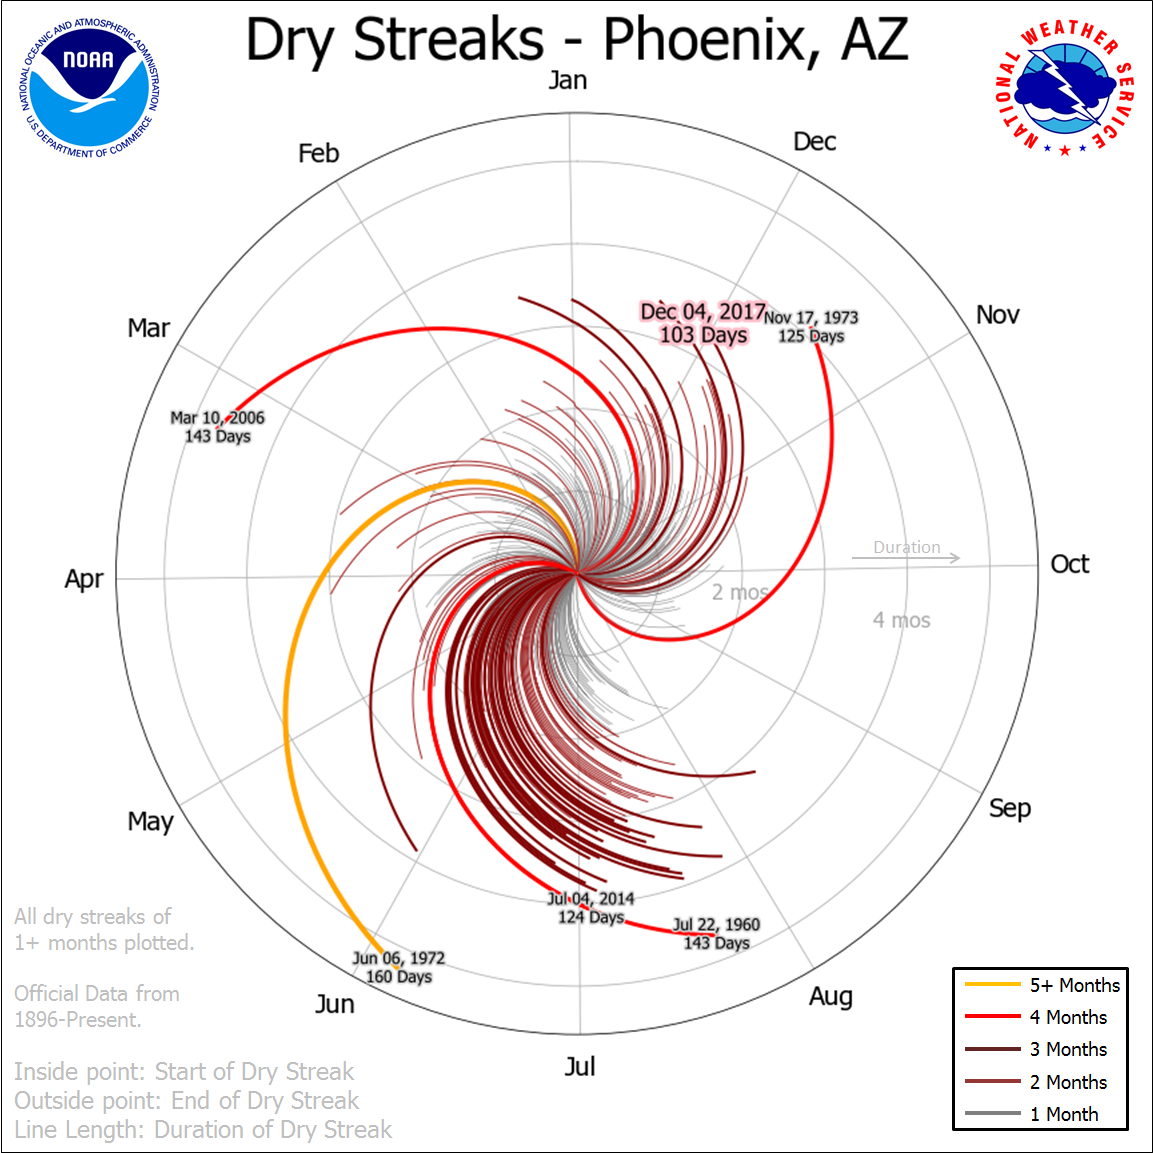
The year 2017 ended up being the all-time warmest year recorded in the history of central Arizona (Phoenix), as well as the warmest ever recorded for southwest Arizona (Yuma). In fact, the year will go down as one of the top 2 warmest for the state as a whole after all data are compiled. Records for Phoenix began in 1896, first taken in downtown and since moved to Sky Harbor airport in the 1950s. Records in Yuma began in 1878. Heat was obviously one of the biggest stories in 2017. Not only from an annual record setting average, but also periodically on a daily basis. In fact, Phoenix experienced its 4th hottest temperature ever recorded on Jun 20th. While extreme heat was certainly a major impact, the total number of 100 and 110 degree days in Phoenix and Yuma were not particularly unusual (ironically, both cities had exactly the same number of 100 & 110 degree days). The other predominant weather story in 2017 was the prolonged periods without rainfall. The first 3 months of the year began very optimistically, however Monsoon rainfall was very spotty and the last 4 months of the year turned exceptionally dry. In fact, the complete lack of rainfall in Phoenix exceeded 100 days by the beginning of December and became one of the longer rain-free streaks in the climate history of the city.
|
***Please note all climatic data are considered preliminary until validated by the National Centers for Environmental Information*** |
Phoenix Annual Temperature Rankings (Warmest Years)
|
|
|
|---|
|
|
Avg Max Temp |
Highest
Temp |
Avg Min Temp
|
Lowest Temp
|
Avg Temp
|
Rank (1=Warmest, 122=Coldest)
|
|---|---|---|---|---|---|---|
| Jan |
64.1
|
76 on the 30th
|
46.1
|
35 on the 28th
|
55.1 /-1.3
|
Tied 38th
|
| Feb |
72.2
|
83 on the 10th
|
51.6
|
42 on the 25th
|
61.9 /+2.2
|
Tied 8th
|
| Mar |
83.9
|
96 on the 19th & 20th
|
57.4
|
45 on the 1st
|
70.7 /+5.5
|
3rd
|
| Apr |
88.6
|
99 on the 23rd
|
61.9
|
52 on the 1st
|
75.3 /+2.6
|
Tied 7th
|
| May |
94.5
|
108 on the 5th & 24th
|
69.1
|
57 on the 9th
|
81.8 /-0.3
|
22nd
|
| Jun |
107.9
|
119 on the 20th
|
81.4
|
69 on the 13th
|
94.7 /+3.8
|
3rd
|
| Jul |
106.2
|
118 on the 7th
|
83.8
|
74 on the 16th
|
95.0 /+0.2
|
Tied 19th
|
| Aug |
105.4
|
111 on the 9th & 27th
|
82.6
|
73 on the 13th
|
94.0 /+0.4
|
Tied 20th
|
| Sep |
99.3
|
110 on the 1st & 12th
|
76.4
|
62 on the 24th & 25th
|
87.9 /-0.5
|
Tied 24th
|
| Oct |
93.8
|
99 on the 16th & 24th
|
67.1
|
61 on the 22nd & 27th
|
80.5 /+3.8
|
5th
|
| Nov |
82.9
|
89 on the 26th
|
59.5
|
52 on the 19th
|
71.2 /+7.1
|
1st
|
| Dec |
71.0
|
84 on the 2nd
|
47.3
|
36 on the 22nd
|
59.1 /+3.7
|
4th
|
(*** click on month for more comprehensive monthly summary ***)
| Record Highs Set in 2017 |
|---|
| Date | Record | Previous Record |
|---|---|---|
| Mar 13 |
92 - tied record
|
92 in 1972
|
| Mar 18 |
95
|
94 in 2007
|
| Mar 19 |
96
|
92 in 2004, 1925, & 1907
|
| Mar 20 |
96
|
95 in 2004
|
| May 5 |
108
|
105 in 1989
|
| Jun 19 |
118 - tied record
|
118 in 2016
|
| Jun 20 |
119
|
116 in 2016
|
| Jun 21 |
117
|
115 in 2008 & 1968
|
| Jul 7 |
118
|
115 in 1905
|
| Sep 12 |
110 - tied record
|
110 in 2001 & 1971
|
| Oct 24 |
99
|
96 in 2014, 2007, & 1990
|
| Nov 23 |
87 - tied record
|
87 in 1950
|
| Nov 26 |
89
|
88 in 1950
|
| Dec 2 | 84 | 81 in 1940 |
| No Record Lows were set in 2017 |
|---|

Yuma Annual Temperature Rankings (Warmest Years)
|
|
|
|---|
|
|
Avg Max Temp |
Highest
Temp |
Avg Min Temp
|
Lowest Temp
|
Avg Temp
|
Rank (1=Warmest, 140=Coldest)
|
|---|---|---|---|---|---|---|
| Jan |
67.2
|
77 on the 30th & 31st
|
48.0
|
39 on the 25th
|
57.6 /-1.0
|
44th
|
| Feb |
74.7
|
86 on the 9th
|
53.4
|
45 on the 24th & 25th
|
64.0 /+2.1
|
Tied 13th
|
| Mar |
85.8
|
98 on the 19th
|
58.1
|
48 on the 7th
|
71.9 /+4.7
|
4th
|
| Apr |
89.9
|
99 on the 22nd
|
61.9
|
55 on the 1st & 10th
|
75.9 / +2.9
|
Tied 10th
|
| May |
93.9
|
109 on the 23rd & 24th
|
65.6
|
56 on the 7th & 16th
|
79.8 /-1.5
|
Tied 41st
|
| Jun |
106.2
|
120 on the 20th
|
75.4
|
63 on the 12th
|
90.8 /+1.8
|
Tied 13th
|
| Jul |
107.5
|
118 on the 7th
|
85.2
|
80 on the 1st
|
96.3 /+1.8
|
Tied 5th
|
| Aug |
107.6
|
113 on the 29th & 30th
|
84.2
|
77 on the 16th
|
95.9 /+1.6
|
Tied 6th
|
| Sep |
98.0
|
110 on the 1st
|
73.5
|
61 on the 25th & 26th
|
85.7 /-3.3
|
Tied 81st
|
| Oct |
93.7
|
99 on the 17th & 24th
|
66.3
|
61 on the 10th & 11th
|
80.0 /+2.5
|
Tied 13th
|
| Nov |
82.4
|
91 on the 23rd
|
59.6
|
52 on the 20th
|
71.0 /+5.3
|
1st
|
| Dec |
73.4
|
83 on the 2nd
|
47.9
|
34 on the 22nd
|
60.7 /+3.3
|
6th
|
(*** click on month for more comprehensive monthly summary ***)
| Record Highs Set in 2017 |
|---|
| Date | Record | Previous Record |
|---|---|---|
| Mar 13 |
95 - tied record
|
95 in 1916
|
| Mar 14 |
96 - tied record
|
96 in 2013
|
| Mar 18 |
96 - tied record
|
96 in 1907
|
| Mar 19 |
98
|
96 in 1997
|
| May 24 |
109 - tied record
|
109 in 2001 & 1983
|
| Jun 20 |
120
|
116 in 2008 & 1892
|
| Jul 7 |
118
|
117 in 1942
|
| Aug 26 |
113 - tied record
|
113 in 2011, 1944, & 1910
|
| Nov 23 |
91
|
87 in 1950
|
| Nov 24 | 90 | 89 in 1950 |
| Nov 26 | 90 | 87 in 1950 & 1949 |
| No Record Lows were set in 2017 |
|---|

| Arizona Statewide Temperature Maps (Data courtesy of Western Region Climate Center) |
|---|
|
Arizona 2017 Average
Maximum Temperature
 |
Arizona 2017 Maximum Temp Departure from normal
 |
|
Arizona 2017 Average
Minimum Temperature
 |
Arizona 2017 Minimum Temp
Departure from normal
 |
|
Arizona 2017 Average Temperature
 |
Arizona 2017 Average Temp
Departure from normal
 |
| 2017 Phoenix Precipitation Statistics |
|---|
| Precip Total | Departure | Rank (1=Wettest, 122=Driest) | |
|---|---|---|---|
| Jan |
1.10
|
+0.19
|
36th
|
| Feb |
1.24
|
+0.32
|
23rd
|
| Mar |
0.06
|
-0.93
|
Tied104th
|
| Apr |
T
|
-0.28
|
Tied 122nd
|
| May |
0.01
|
-0.10
|
Tied 56th
|
| Jun |
0.00
|
-0.02
|
Tied 122nd
|
| Jul |
0.89
|
-0.16
|
Tied 49th
|
| Aug |
1.43
|
+0.43
|
28th
|
| Sep |
T
|
-0.64
|
Tied 122nd
|
| Oct |
0.00
|
-0.58
|
Tied 122nd
|
| Nov |
T
|
-0.65
|
Tied 122nd
|
| Dec |
0.23
|
-0.65
|
Tied 83rd
|
(*** click on month for more comprehensive monthly summary ***)
| Phoenix Record Daily Rainfall for 2017 |
|---|
| Date | Record | Previous Record |
|---|---|---|
| Jan 20 |
0.86
|
0.77 in 1933
|

| 2017 Yuma Precipitation Statistics |
|---|
| Precip Total | Departure | Rank (1=Wettest, 140=Driest) | |
|---|---|---|---|
| Jan |
0.31
|
-0.06
|
56th
|
| Feb |
1.06
|
+0.67
|
Tied 15th
|
| Mar |
0.19
|
-0.14
|
Tied 59th
|
| Apr |
0.00
|
-0.15
|
Tied 140th
|
| May |
0.14
|
+0.06
|
11th
|
| Jun |
0.00
|
-0.01
|
Tied 140th
|
| Jul |
T
|
-0.29
|
Tied 140th
|
| Aug |
0.09
|
-0.38
|
Tied 83rd
|
| Sep |
0.45
|
-0.08
|
Tied 34th
|
| Oct |
0.00
|
-0.21
|
Tied 140th
|
| Nov |
0.07
|
-0.15
|
Tied 58th
|
| Dec |
0.00
|
-0.51
|
Tied 140th
|
(*** click on month for more comprehensive monthly summary ***)
| Yuma Record Daily Rainfall for 2017 |
|---|
| Date | Record | Previous Record |
|---|---|---|
| May 10 |
0.08
|
0.05 in 1958
|
| Sep 3 |
0.08
|
0.04 in 1967
|

| Arizona Statewide Precipitation Maps (Data courtesy of Western Region Climate Center) |
|---|
|
Arizona 2017
Precipitation
 |
Arizona 2017 Precip Departure from normal
 |
Arizona 2017 Precip Percent Normal
 |
CLIMATE REPORT
NATIONAL WEATHER SERVICE PHOENIX AZ
738 AM MST MON JAN 1 2018
...................................
...THE PHOENIX AZ CLIMATE SUMMARY FOR THE YEAR OF 2017...
CLIMATE NORMAL PERIOD 1981 TO 2010
CLIMATE RECORD PERIOD 1895 TO 2017
WEATHER OBSERVED NORMAL DEPART
VALUE DATE(S) VALUE FROM
NORMAL
.................................................
TEMPERATURE (F)
RECORD
HIGH 122 06/26/1990
LOW 16 01/07/1913
HIGHEST 119 06/20 114 5
LOWEST 35 01/28 35 0
AVG. MAXIMUM 89.1 86.7 2.4
AVG. MINIMUM 65.4 63.5 1.9
MEAN 77.3 75.1 2.2
DAYS MAX >= 90 192 168.8 23.2
DAYS MAX <= 32 0 0.0 0.0
DAYS MAX >= 100 109
DAYS MIN <= 32 0 0.4 -0.4
PRECIPITATION (INCHES)
RECORD
MAXIMUM 19.73 1905
MINIMUM 2.82 2002
1956
TOTALS 4.96 8.03 -3.07
DAYS >= .01 26 36.6 -10.6
DAYS >= .10 13 18.7 -5.7
DAYS >= .50 3 4.5 -1.5
DAYS >= 1.00 0 1.3 -1.3
GREATEST
24 HR. TOTAL 0.92 08/03 TO 08/03
DEGREE_DAYS
HEATING TOTAL 618 935 -317
SINCE 7/1 194 401 -207
COOLING TOTAL 5212 4608 604
SINCE 1/1 5212 4607 605
..............................................................
WIND (MPH)
AVERAGE WIND SPEED 6.4
HIGHEST GUST SPEED/DIRECTION 62/030 DATE 07/16
AVERAGE RH (PERCENT) 32
WEATHER CONDITIONS. NUMBER OF DAYS WITH
THUNDERSTORM 27 HEAVY RAIN 5
RAIN 8 LIGHT RAIN 41
FOG W/VIS <= 1/4 MILE 0
CLIMATE REPORT
NATIONAL WEATHER SERVICE PHOENIX AZ
738 AM MST MON JAN 1 2018
...................................
...THE YUMA AZ CLIMATE SUMMARY FOR THE YEAR OF 2017...
CLIMATE NORMAL PERIOD 1981 TO 2010
CLIMATE RECORD PERIOD 1876 TO 2017
WEATHER OBSERVED NORMAL DEPART
VALUE DATE(S) VALUE FROM
NORMAL
................................................
TEMPERATURE (F)
RECORD
HIGH 124 07/28/1995
LOW 22 01/24/1937
12/26/1911
01/20/1883
HIGHEST 120 06/20 115 5
LOWEST 34 12/22 36 -2
AVG. MAXIMUM 90.0 88.3 1.7
AVG. MINIMUM 64.9 63.4 1.5
MEAN 77.5 75.9 1.6
DAYS MAX >= 90 196 174.8 21.2
DAYS MAX <= 32 0 0.0 0.0
DAYS MIN <= 32 0 0.1 -0.1
DAYS MIN <= 0 0 0.0 0.0
PRECIPITATION (INCHES)
RECORD
MAXIMUM 11.41 1905
MINIMUM 0.03 2002
TOTALS 2.31 3.56 -1.25
DAYS >= .01 16 17.4 -1.4
DAYS >= .10 7 8.6 -1.6
DAYS >= .50 1 1.9 -0.9
DAYS >= 1.00 0 0.5 -0.5
GREATEST
24 HR. TOTAL 0.83 02/18 TO 02/18
DEGREE_DAYS
HEATING TOTAL 434 687 -253
SINCE 7/1 139 304 -165
COOLING TOTAL 5068 4650 418
SINCE 1/1 5068 4651 417
.................................................
WIND (MPH)
AVERAGE WIND SPEED 7.1
HIGHEST GUST SPEED/DIRECTION 48/060 DATE 09/02
AVERAGE RH (PERCENT) 35
WEATHER CONDITIONS. NUMBER OF DAYS WITH
THUNDERSTORM 14 HEAVY RAIN 4
RAIN 8 LIGHT RAIN 23
FOG W/VIS <= 1/4 MILE 0


 Follow us on YouTube