2018 Climate Summaries

...Highlights of 2020...

| Element | Jan | Feb | Mar | Apr | May | Jun | Jul | Aug | Sep | Oct | Nov | Dec | Year |
| Average High | 37.1 | 30.4 | 47.4 | 54.7 | 69.8 | 82.1 | 94.2 | 90.9 | 75.5 | 59.3 | 51.7 | 35.7 | 60.5 |
| Mean High (1981-2010 Normals) | 35.2 | 37.8 | 47.9 | 56.8 | 67.1 | 78.8 | 88.1 | 86.4 | 74.3 | 59.4 | 44.7 | 34.2 | 59.2 |
| Average Low | 18.1 | 12.6 | 24.5 | 23.4 | 36.3 | 45.7 | 52.2 | 51.9 | 40 | 26 | 22.5 | 16.8 | 30.8 |
| Mean Low (1981-2010 Normals) | 14.3 | 15.7 | 22.4 | 28.6 | 37.2 | 45.7 | 53.0 | 51.5 | 41.4 | 31.0 | 21.6 | 13.5 | 31.3 |
| Average Temperature | 27.6 | 21.5 | 36 | 39 | 53 | 63.9 | 71.7 | 71.4 | 57.8 | 42.6 | 37.1 | 26.3 | 45.7 |
| Mean Average Temperature (1981-2010 Normals) | 24.7 | 26.7 | 35.2 | 42.7 | 52.2 | 62.2 | 70.5 | 69.0 | 57.9 | 45.2 | 33.2 | 23.8 | 45.3 |
| Departure from Normal | 2.9 | -5.2 | 0.8 | -3.7 | 0.8 | 1.7 | 1.2 | 2.4 | -0.1 | -2.6 | 3.9 | 2.5 | 0.4 |
|
Rank: 81 years of record (P.O.R 12/1939-2020) |
63 | 15 | 51 | 13 | 43 | 52 | 52 | 66 | 31 | 10 | 62 | 44 | 43 |
 |
|||||||||||||
| Highest Daily Maximum | 49 | 44 | 60 | 78 | 91 | 94 | 100 | 98 | 98 | 82 | 73 | 53 | 100 |
| Date of Occurrence | 16 | 29 | 31 | 30 | 31 | 5 | 12 | 23 | 5 | 6 | 4 | 9 | 7/12 |
| Lowest Daily Minimum | 3 | -6 | 6 | -5 | 22 | 31 | 41 | 33 | 24 | -8 | 4 | -9 | -9 |
| Date of Occurrence | 10 | 13 | 1 | 3 | 8 | 18 | 2 | 31 | 9 | 25 | 21 | 28 | 12/28 |
| Number of Days with: | Jan | Feb | Mar | Apr | May | Jun | Jul | Aug | Sep | Oct | Nov | Dec | |
| Maximum >= 90° | 0 | 0 | 0 | 0 | 1 | 5 | 19 | 25 | 4 | 0 | 0 | 0 | 54 |
| Maximum <= 32° | 5 | 18 | 5 | 4 | 0 | 0 | 0 | 0 | 0 | 2 | 1 | 14 | 49 |
| Minimum <= 32° | 31 | 28 | 28 | 24 | 10 | 1 | 0 | 0 | 6 | 18 | 23 | 29 | 198 |
| Minimum <= 0° | 0 | 2 | 0 | 2 | 0 | 0 | 0 | 0 | 0 | 3 | 0 | 3 | 10 |
| Record High Temperatures Set or Tied | 0 | 0 | 0 | 0 | 1 | 2 | 0 | 2 | 2 | 1 | 4 | 0 | 11 |
| Record Low Temperatures Set or Tied | 0 | 0 | 0 | 3 | 2 | 1 | 0 | 1 | 3 | 5 | 0 | 0 | 15 |
Daily Records:
Record High Temperatures:
April: -5 on the 3rd, 23 on the 12th, and 7 on the 13th.May: 91 on the 31st.June: 91 on the 1st and 94 on the 5th.
August: 97 on the 17th (tie) and 98 on the 23rd.September: 98 on the 5th (ties all time high). 87 on the 24th (tie).October: 81 on the 8th.
November: 71 on the 2nd (tie), 72 on the 3rd, 73 on the 4th, and 71 on the 5th (tie).Record Low Temperatures:
May: 29 on the 24th and 27 on the 25th.
June: 31 on the 18th.August: 33 on the31st (tie).
September: 29 on the 8th (tie), 24 on the 9th, and 27 on the 10th.October: 9 on the 22nd, -5 on the 23rd, 10 on the 24th, 8 on the 25th and -6 on the 26th.
| Coldest Months of October on Record | |||||||
| Rank | Year | Average Temperature °F | |||||
| 1 | 2019 | 36.8 | |||||
| 2 | 2009 | 37.0 | |||||
| 3 | 1969 | 37.8 | |||||
| 4 | 2002 | 38.3 | |||||
| 5 | 1984 | 40.1 | |||||
| 6 | 1949 | 41.0 | |||||
| 7 | 1970 | 41.2 | |||||
| 8 | 2013 | 41.5 | |||||
| 9 | 1946 | 41.8 | |||||
| 10 | 2020 | 42.3 | |||||
| Top Ten Warmest Years on Record | |||||||
| Rank | Year | Average Temperature °F | |||||
| 1 | 1994 | 49.1 | |||||
| 2 | 2012 | 48.7 | |||||
| 3 | 1954 | 48.3 | |||||
| 4 | 1981 | 48.1 | |||||
| 5 | 1992 | 48.0 | |||||
| 6 | 1940, 1953, 1963 | 47.3 | |||||
| 9 | 2015, 2006, 1999 | 47.1 | |||||
| 40 | 2020 | 45.7 | |||||
| Top Ten Coldest Years on Record | |||||||
| Rank | Year | Average Temperature °F | |||||
| 1 | 1985 | 42.5 | |||||
| 2 | 1951 | 43.1 | |||||
| 3 | 1978 | 43.2 | |||||
| 4 | 1964 | 43.5 | |||||
| 5 | 2019, 1975 | 43.6 | |||||
| 6 | 2009, 1979, 1968, 1949 | 43.8 | |||||
| 10 | 1971 | 43.9 | |||||
| 43 | 2020 | 45.7 | |||||
 |
 |
| Average Annual Temperature for Period of Record - Click on Graph to Enlarge | |
 |
Learn more about the National Weather Service's efforts to build a Weather-Ready Nation! |

| Element | Jan | Feb | Mar | Apr | May | Jun | Jul | Aug | Sep | Oct | Nov | Dec | Year |
| Average Speed (MPH) | 16.8 | 15.7 | 13.8 | 11.1 | 11 | 11.8 | 10 | 9 | 10.4 | 12.4 |
16.4
|
16
|
12.9 |
| Maximum 3-sec Gust | 75 | 57 | 62 | 54 | 59 | 70 | 55 | 61 | 53 | 57 | 72 |
53
|
75 |
| Direction | 210 | 230 | 260 | 220 | 230 | 220 | 220 | 220 | 250 | 310 | 210 |
210
|
210 |
| Date of Occurrence | 4 | 14 | 11 | 6 | 31 | 6 | 7 | 24 | 19 | 11 | 8 | 22 | 1/4 |
| Number of Days with: | |||||||||||||
| 2-Min Wind >50 mph | 1 | 0 | 1 | 0 | 0 | 0 | 0 | 0 | 0 | 0 | 0 | 0 | 2 |
| Peak Wind >50 mph | 6 | 3 | 2 | 3 | 4 | 10 | 6 | 5 | 1 | 5 | 9 | 3 | 57 |
| Peak Wind >70 mph | 1 | 0 | 0 | 0 | 0 | 1 | 0 | 0 | 0 | 0 | 1 | 0 | 3 |
|
Learn more about the National Weather Service's efforts to build a Weather-Ready Nation! |

| Element | Jan | Feb | Mar | Apr | May | Jun | Jul | Aug | Sep | Oct | Nov | Dec | Year |
| Total (inches) | 0.48 | 0.82 | 0.96 | 1.28 | 0.3 | 0.3 | 0.02 | 0.05 | 0.54 | 0.32 | 0.04 | 0.68 | 5.79 |
| Mean Precipitation (1981-2010 Normals) |
0.51 | 0.57 | 0.82 | 1.29 | 2.02 | 1.61 | 1.41 | 0.85 | 1.08 | 1.11 | 0.76 | 0.49 | 12.52 |
| Departure from Normal | -0.03 | 0.25 | 0.14 | -0.01 | -1.72 | -1.31 | -1.39 | -0.8 | -0.54 | -0.79 | -0.72 | 0.19 | -6.73 |
| Percent of Normal | 94 | 144 | 117 | 99 | 15 | 19 | 1 | 6 | 50 | 29 | 5 | 139 | 46 |
|
Rank - |
41 | 70 | 50 | 44 | 1 | 11 | 1 | 4 | 35 | 13 | 1 | 56 | 1 |
 |
|||||||||||||
| Greatest 24-HR Total | 0.16 | 0.24 | 0.24 | 0.42 | 0.15 | 0.17 | 0.02 | 0.02 | 0.32 | 0.13 | 0.02 | 0.23 | 0.42 |
| Dates of Occurrence | 29 | 3 | 25 | 23 | 4 | 6 | 29 | 3, 6 | 7 | 22 | 14 | 22-23 | 4/23 |
| Number of Days with: | |||||||||||||
| Precipitation >= 0.01 | 6 | 10 | 8 | 9 | 6 | 5 | 1 | 3 | 3 | 7 | 3 | 10 | 71 |
| Precipitation >= 0.10 | 2 | 4 | 5 | 5 | 1 | 1 | 0 | 0 | 2 | 1 | 0 | 3 | 24 |
| Precipitation >= 1.00 | 0 | 0 | 0 | 0 | 0 | 0 | 0 | 0 | 0 | 0 | 0 | 0 | 0 |
| Days with Thunderstorms | 0 | 0 | 0 | 3 | 2 | 7 | 4 | 10 | 0 | 0 | 0 | 0 | 26 |
| Daily Precipitation Records Set or Tied | 0 | 0 | 0 | 0 | 0 | 0 | 0 | 0 | 0 | 0 | 0 | 1 | 1 |
One Day Precipitation Records:
December: 0.22" on the 22nd.
| Top Ten Driest May's on Record | |||||||
| Rank | Year | Precipitation (inches) | |||||
| 1 | 2020 | 0.30 | |||||
| 1 | 1966 | 0.30 | |||||
| 3 | 1994 | 0.37 | |||||
| 4 | 2009 | 0.43 | |||||
| 5 | 2014 | 0.49 | |||||
| 6 | 2003 | 0.51 | |||||
| 7 | 1960 | 0.56 | |||||
| 8 | 1974 | 0.62 | |||||
| 9 | 2001 | 0.63 | |||||
| 10 | 1954 | 0.70 | |||||
| Top Ten Driest July's on Record | |||||||
| Rank | Year | Precipitation (inches) | |||||
| 1 | 2020 | 0.02 | |||||
| 2 | 1991 | 0.09 | |||||
| 3 | 1971 | 0.11 | |||||
| 4 | 2000 | 0.22 | |||||
| 5 | 2016 | 0.24 | |||||
| 5 | 1999 | 0.24 | |||||
| 7 | 1959 | 0.27 | |||||
| 7 | 1955 | 0.27 | |||||
| 9 | 1989 | 0.28 | |||||
| 10 | 2017 | 0.37 | |||||
| Top Ten Driest August's on Record | |||||||
| Rank | Year | Precipitation (inches) | |||||
| 1 | 1944 | Trace | |||||
| 2 | 1950 | 0.02 | |||||
| 3 | 1995 | 0.04 | |||||
| 4 | 2020 | 0.05 | |||||
| 5 | 1961 | 0.08 | |||||
| 6 | 1943 | 0.09 | |||||
| 6 | 1985 | 0.09 | |||||
| 8 | 1951 | 0.10 | |||||
| 9 | 1971 | 0.11 | |||||
| 9 | 1999 | 0.11 | |||||
| Top Ten Driest November's on Record | |||||||
| Rank | Year | Precipitation (inches) | |||||
| 1 | 1949 | 0.04 | |||||
| 1 | 2020 | 0.04 | |||||
| 3 | 2007 | 0.05 | |||||
| 3 | 2009 | 0.05 | |||||
| 5 | 1965 | 0.07 | |||||
| 6 | 1997 | 0.08 | |||||
| 7 | 1976 | 0.09 | |||||
| 8 | 1951 | 0.20 | |||||
| 8 | 2000 | 0.20 | |||||
| 10 | 2013 | 0.24 | |||||
| Top Ten Driest Years on Record | |||||||
| Rank | Year | Precipitation (inches) | |||||
| 1 | 2020 | 5.79 | |||||
| 2 | 1988 | 6.56 | |||||
| 3 | 2001 | 6.76 | |||||
| 4 | 2002 | 7.05 | |||||
| 5 | 1960 | 7.34 | |||||
| 6 | 1954 | 7.70 | |||||
| 7 | 2012 | 7.88 | |||||
| 8 | 1963 | 7.90 | |||||
| 9 | 1966 | 8.14 | |||||
| 10 | 1943 | 8.91 | |||||
| Top Ten Wettest Years on Record | |||||||
| Rank | Year | Precipitation (inches) | |||||
| 1 | 1982 | 20.48 | |||||
| 2 | 1995 | 18.94 | |||||
| 3 | 1983 | 18.41 | |||||
| 4 | 1978 | 17.64 | |||||
| 5 | 1941 | 16.24 | |||||
| 6 | 1957 | 16.12 | |||||
| 7 | 1986 | 15.92 | |||||
| 8 | 1993 | 15.91 | |||||
| 9 | 2009 | 15.77 | |||||
| 10 | 2016 | 15.57 | |||||
| 81 | 2020 | 5.79 | |||||
 |
 |
| Annual Precipitation for Period of Record - Click on Graph to Enlarge | |
|
Learn more about the National Weather Service's efforts to build a Weather-Ready Nation! |

| Element | Jan | Feb | Mar | Apr | May | Jun | Jul | Aug | Sep | Oct | Nov | Dec | Year |
| Total (inches) | 7.9 | 28.4 | 15.1 | 15.2 | 0.001 | 0.001 | 0 | 0 | 7.5 | 3.7 | 0.4 | 11 | 89.2 |
| Mean Snowfall (1981-2010 Normals) | 9.1 | 9.8 | 10.9 | 11.6 | 2.9 | 0.1 | 0.0 | 0.0 | 1.8 | 7.4 | 10.3 | 11.0 | 74.9 |
| Departure from Normal | -1.2 | 18.6 | 4.2 | 3.6 | -2.9 | 0.1 | 0.0 | 0.0 | 5.7 | -3.7 | -9.9 | 0 | 14.3 |
| Percent of Normal | 87 | 290 | 139 | 131 | 0 | 1 | 0 | 0 | 417 | 50 | 4 | 100 | 119 |
| Rank - Least to Most 81 years (P.O.R 12/1939-2020) |
30 | 81 | 62 | 58 | 29 | NA | NA | NA | 78 | 31 | 3 | 50 | 63 |
|
|||||||||||||
| Greatest 24-HR Total | 2.6 | 15.2 | 4.1 | 4.9 | T | 0.0 | 0.0 | 0 | 5.2 | 2.3 | 0..4 | 3.2 | 15.2 |
| Dates of Occurrence | 27 | 3 | 12 | 1 | 9 | NA | NA | NA | 20 | 25 | 8 | 2/3 | |
| Number of Days with: | |||||||||||||
| Snowfall >= 1.0 inch | 3 | 3 | 6 | 5 | 0 | 0 | 0 | 0 | 2 | 2 | 0 | 3 | 24 |
| Daily Snowfall Records Set or Tied | 0 | 0 | 0 | 0 | 0 | 0 | 0 | 0 | 1 | 0 | 0 | 0 | 1 |
| * 50 months of September on record with no snowfall. | |||||||||||||
Snowfall Ranks and Records:
One Day Snowfall Records (inches):
September: 5.2" on the 8th.
| Snowiest Months of February on Record | |||||||
| Rank | Year | Snowfall (inches) | |||||
| 1 | 2020 | 28.4 | |||||
| 2 | 1952 | 23.8 | |||||
| 3 | 1987 | 22.7 | |||||
| 4 | 1989 | 21.5 | |||||
| 4 | 1955 | 21.5 | |||||
| 6 | 2004 | 18.9 | |||||
| 7 | 2018 | 18.6 | |||||
| 8 | 1953 | 18.5 | |||||
| 9 | 1995 | 16.9 | |||||
| 10 | 1976 | 16.1 | |||||
| Snowiest Months of October on Record | |||||||
| Rank | Year | Snowfall (inches) | |||||
| 1 | 2000 | 11.5 | |||||
| 1 | 1982 | 11.5 | |||||
| 3 | 1965 | 8.8 | |||||
| 4 | 2020 | 7.5 | |||||
| 5 | 1995 | 7.1 | |||||
| 6 | 1985 | 7.0 | |||||
| 7 | 1961 | 6.3 | |||||
| 8 | 1974 | 5.1 | |||||
| 9 | 1994 | 4.9 | |||||
| 10 | 2013 | 4.8 | |||||
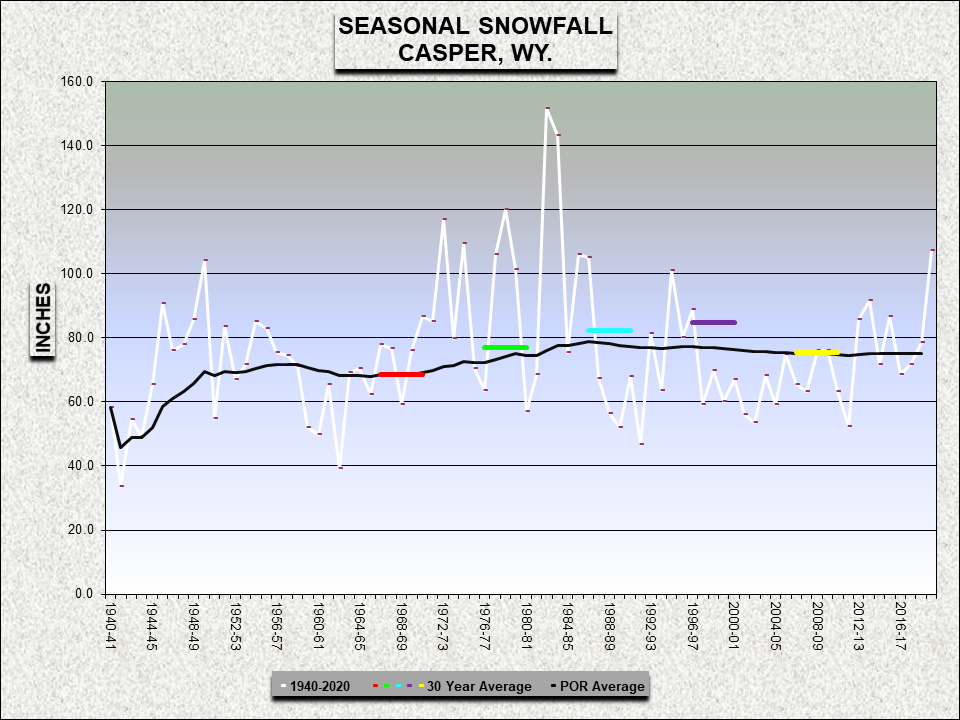
| Top Ten Snowiest Years on Record | |||||||
| Rank | Year | Snowfall (inches) | |||||
| 1 | 1982 | 137.6 | |||||
| 2 | 1975 | 124.0 | |||||
| 3 | 1984 | 121.2 | |||||
| 4 | 1973 | 118.3 | |||||
| 5 | 1983 | 114.2 | |||||
| 6 | 1978 | 112.7 | |||||
| 7 | 2013 | 107.5 | |||||
| 8 | 1955 | 103.3 | |||||
| 9 | 1979 | 103.0 | |||||
| 10 | 1985 | 101.0 | |||||
| 20 | 2020 | 89.2 | |||||
  |
  |
|
| Annual and Seasonal Snowfall for Period of Record - Click on Graph to Enlarge | ||
|
Learn more about the National Weather Service's efforts to build a Weather-Ready Nation! |
Click Here for the complete 2018 summary for Lander
...Highlights of 2018...

...Highlights of 2020...
| Element | Jan | Feb | Mar | Apr | May | Jun | Jul | Aug | Sep | Oct | Nov | Dec | Year |
| Average High | 31.6 | 24.9 | 47.6 | 56.1 | 71.3 | 80.5 | 89.2 | 90.6 | 75.3 | 59.6 | 49.1 | 33.8 | 59.1 |
| Mean High (1981-2010 Normals) | 31.0 | 37.4 | 49.6 | 60.3 | 69.2 | 79.4 | 88.2 | 86.7 | 74.9 | 60.0 | 43.1 | 29.5 | 59.1 |
| Average Low | 6.6 | 1.2 | 21.9 | 27.4 | 41.1 | 50.1 | 53.7 | 53.0 | 41.5 | 27.5 | 16.9 | 7.8 | 29.1 |
| Mean Low (1981-2010 Normals) | 6.2 | 11.0 | 22.5 | 30.6 | 40.1 | 48.1 | 54.0 | 51.4 | 41.4 | 30.0 | 17.6 | 5.4 | 29.9 |
| Average Temperature | 19.1 | 13.0 | 34.8 | 41.8 | 56.2 | 65.3 | 71.5 | 71.8 | 58.4 | 43.1 | 33.0 | 22.2 | 44.2 |
| Mean Average Temperature (1981-2010 Normals) | 18.6 | 24.2 | 36.1 | 45.4 | 54.6 | 63.8 | 71.1 | 69.0 | 58.2 | 45.0 | 30.3 | 17.4 | 44.5 |
| Departure from Normal | 0.5 | -11.2 | -1.3 | -3.6 | 1.6 | 1.5 | 0.4 | 2.8 | 0.2 | -1.9 | 2.7 | 4.8 | -0.3 |
| Rank: Coldest to Warmest 103 years of record (P.O.R 12/1918-2020) |
66 | 13 | 57 | 23 | 78 | 73 | 68 | 97 | 62 | 26 | 78 | 78 | 66 |
| Highest Daily Maximum | 44 | 50 | 59 | 77 | 90 | 95 | 97 | 96 | 97 | 84 | 72 | 53 | 97 |
| Date of Occurrence | 8 | 2 | 31 | 30 | 31 | 6 | 13 | 7,18 | 6 | 7 | 6 | 23 | 7/13, 9/6 |
| Lowest Daily Minimum | -5 | -16 | -2 | 2 | 28 | 39 | 44 | 38 | 26 | -12 | 1 | -6 | -16 |
| Date of Occurrence | 16 | 20,21 | 2 | 3 | 5 | 8 | 1 | 31 | 9 | 26 | 30 | 13 | 2/20, 2/21 |
| Number of Days with: | |||||||||||||
| Maximum >= 90° | 0 | 0 | 0 | 0 | 1 | 6 | 16 | 23 | 1 | 0 | 0 | 0 | 47 |
| Maximum <= 32° | 19 | 4 | 1 | 2 | 0 | 0 | 0 | 0 | 0 | 3 | 0 | 13 | 42 |
| Minimum <= 32° | 31 | 29 | 30 | 21 | 5 | 0 | 0 | 0 | 5 | 18 | 27 | 31 | 197 |
| Minimum <= 0° | 5 | 12 | 1 | 0 | 0 | 0 | 0 | 0 | 0 | 1 | 0 | 4 | 23 |
| Record Highs Set or Tied | 0 | 0 | 0 | 0 | 0 | 1 | 0 | 1 | 1 | 0 | 1 | 0 | 7 |
| Record Lows Set or Tied | 0 | 0 | 0 | 0 | 0 | 0 | 0 | 0 | 0 | 1 | 0 | 0 | 1 |
| * Multiple day occurrence | |||||||||||||
Temperature Ranks and Records:
Daily Records:
Max:June: 78 on the 13th.August: 96 on the 18th (tie).September: 97 on the 6th.November: 64 on the 19th.
Min:
October: -12th the 26th.
| Top Ten Warmest August's on Record | |||||||
| Rank | Year | Average Temperature °F | |||||
| 1 | 2003 | 73.8 | |||||
| 2 | 2013 | 73.0 | |||||
| 2 | 2000 | 73.0 | |||||
| 4 | 2001 | 72.9 | |||||
| 5 | 2012 | 71.9 | |||||
| 6 | 2020 | 71.8 | |||||
| 6 | 2011 | 71.8 | |||||
| 8 | 2007 | 71.6 | |||||
| 9 | 1922 | 71.3 | |||||
| 10 | 1999 | 71.0 | |||||
| Warmest Years on Record (101 Years) | |||||||
| Rank | Year | Average Temperature °F | |||||
| 1 | 2012 | 48.5 | |||||
| 2 | 2006, 1999 | 47.0 | |||||
| 4 | 1934 | 46.9 | |||||
| 5 | 2007 | 46.5 | |||||
| 6 | 2005, 1981 | 46.3 | |||||
| 8 | 1954 | 46.2 | |||||
| 9 | 2015 | 45.9 | |||||
| 10 | 1953 | 45.8 | |||||
| 33 | 2020 | 44.2 | |||||
| Top Ten Coldest Years on Record | |||||||
| Rank | Year | Average Temperature °F | |||||
| 1 | 1993 | 38.8 | |||||
| 2 | 1924 | 39.5 | |||||
| 3 | 1984, 1944 | 39.7 | |||||
| 5 | 1978 | 40.1 | |||||
| 6 | 1985 | 40.3 | |||||
| 7 | 1968, 1929 | 40.5 | |||||
| 9 | 1975 | 40.8 | |||||
| 10 | 1986, 1932 | 41.0 | |||||
| 66 | 2020 | 44.2 | |||||
 |
 |
| Average Annual Temperature for Period of Record - Click on Graph to Enlarge | |
|
Learn more about the National Weather Service's efforts to build a Weather-Ready Nation! |
| Element | Jan | Feb | Mar | Apr | May | Jun | Jul | Aug | Sep | Oct | Nov | Dec | Year |
| Total (inches) | 0.29 | 0.98 | 0.24 | 1.84 | 0.34 | 0.41 | 0.25 | 0.001 | 0.7 | 0.18 | 0.03 | 0.36 | 5.62 |
| Mean Precipitation (1981-2010 Normals) |
0.28 | 0.34 | 0.56 | 0.98 | 1.45 | 1.21 | 0.78 | 0.50 | 0.83 | 0.85 | 0.41 | 0.24 | 8.42 |
| Departure from Normal | 0.01 | 0.64 | -0.32 | 0.86 | -1.11 | -0.8 | -0.53 | -0.50 | -0.13 | -0.67 | -0.38 | 0.12 | -2.8 |
| Percent of Normal | 104 | 288 | 43 | 188 | 23 | 34 | 32 | 0 | 84 | 21 | 7 | 150 | 67 |
|
Rank - Driest to Wettest |
72 | 98 | 34 | 82 | 8 Tie | 24 | 29 | 6 | 60 | 16 | 8 Tie | 78 | 7 |
|
|||||||||||||
| Greatest 24-HR Total | 0.2 | 0.42 | 0.12 | 0.64 | 0.26 | 0.19 | 0.13 | T | 0.63 | 0.1 | 0.03 | 0.12 | 0.64 |
| Dates of Occurrence | 28 | 3 | 2 | 12 | 31 | 7 | 1 | 8,19,20,26 | 8 | 25 | 8 | 15 | 4/12 |
| Number of Days with: | |||||||||||||
| Precipitation >= 0.01 | 3 | 7 | 4 | 8 | 4 | 6 | 3 | 0 | 3 | 3 | 1 | 7 | 49 |
| Precipitation >= 0.10 | 1 | 3 | 1 | 4 | 1 | 1 | 1 | 0 | 1 | 1 | 0 | 1 | 15 |
| Precipitation >= 1.00 | 0 | 0 | 0 | 0 | 0 | 0 | 0 | 0 | 0 | 0 | 0 | 0 | 0 |
| Daily Precipitation Records Set or Tied | 0 | 0 | 0 | 1 | 0 | 0 | 0 | 0 | 0 | 0 | 0 | 0 | 1 |
One Day Precipitation Records:
April: 0.64" on the 12th.
| Top Ten Wettest February's on Record | |||||||
| Rank | Year | Precipitation (inches) | |||||
| 1 | 2004 | 1.33 | |||||
| 2 | 2015 | 1.28 | |||||
| 3 | 2003 | 1.15 | |||||
| 4 | 2020 | 0.98 | |||||
| 5 | 1986 | 0.97 | |||||
| 6 | 2017 | 0.96 | |||||
| 7 | 1955 | 0.90 | |||||
| 8 | 1935 | 0.86 | |||||
| 9 | 1920 | 0.80 | |||||
| 10 | 2011 | 0.75 | |||||
| Top Ten Driest May's on Record | |||||||
| Rank | Year | Precipitation (inches) | |||||
| 1 | 1936 | 0.08 | |||||
| 2 | 1963 | 0.11 | |||||
| 3 | 1994 | 0.17 | |||||
| 4 | 1984 | 0.18 | |||||
| 5 | 1974 | 0.20 | |||||
| 6 | 2006 | 0.26 | |||||
| 7 | 2001 | 0.31 | |||||
| 8 | 1969 | 0.34 | |||||
| 8 | 2020 | 0.34 | |||||
| 10 | 1948 | 0.35 | |||||
| Top Ten Driest August's on Record | |||||||
| Rank | Year | Precipitation (inches) | |||||
| 1 | 1929 | 0 | |||||
| 1 | 1944 | 0 | |||||
| 1 | 1949 | 0 | |||||
| 1 | 1969 | 0 | |||||
| 1 | 1985 | 0 | |||||
| 6 | 2020 | 0.001 | |||||
| 7 | 1937 | 0.01 | |||||
| 7 | 1967 | 0.01 | |||||
| 9 | 1924 | 0.02 | |||||
| 10 | 1956 | 0.02 | |||||
| Top Ten Driest November's on Record | |||||||
| Rank | Year | Precipitation (inches) | |||||
| 1 | 1939 | 0 | |||||
| 1 | 1949 | 0 | |||||
| 1 | 1976 | 0 | |||||
| 1 | 1989 | 0 | |||||
| 5 | 1981 | 0.01 | |||||
| 5 | 1982 | 0.01 | |||||
| 5 | 2009 | 0.01 | |||||
| 8 | 1954 | 0.03 | |||||
| 8 | 2020 | 0.03 | |||||
| 10 | 1988 | 0.04 | |||||
| Top Ten Driest Years on Record | |||||||
| Rank | Year | Precipitation (inches) | |||||
| 1 | 1988 | 3.75 | |||||
| 2 | 2012 | 3.98 | |||||
| 3 | 1974 | 4.12 | |||||
| 4 | 1954 | 4.85 | |||||
| 5 | 2001, 2006 | 5.07 | |||||
| 7 | 2020 | 5.62 | |||||
| 8 | 1966 | 5.66 | |||||
| 9 | 1990 | 5.71 | |||||
| 10 | 1922 | 5.91 | |||||
| Top Ten Wettest Years on Record | |||||||
| Rank | Year | Precipitation (inches) | |||||
| 1 | 1923 | 18.43 | |||||
| 2 | 2017 | 15.86 | |||||
| 3 | 2016 | 15.24 | |||||
| 4 | 1941 | 14.74 | |||||
| 5 | 1912 | 14.73 | |||||
| 6 | 1993 | 13.49 | |||||
| 7 | 1998, 1995 | 13.41 | |||||
| 9 | 1971 | 13.11 | |||||
| 10 | 1947 | 12.45 | |||||
| 97 | 2020 | 5.62 | |||||
 |
 |
| Annual Precipitation for Period of Record - Click on Graph to Enlarge | |
 |
|
| Click on Graph to Enlarge | |
|
Learn more about the National Weather Service's efforts to build a Weather-Ready Nation! |
| Element | Jan | Feb | Mar | Apr | May | Jun | Jul | Aug | Sep | Oct | Nov | Dec | Year |
| Total (inches) | 4 | 19.5 | 4.4 | 20.3 | 0.01 | 0 | 0 | 0 | 3.3 | 3.8 | 0.001 | 6.4 | 61.7 |
| Mean Snowfall (1981-2010 Normals) | 4.8 | 6.0 | 5.9 | 6.1 | 1.2 | 0.0 | 0.0 | 0.0 | 0.3 | 3.7 | 4.3 | 4.8 | 37.1 |
| Departure from Normal | -0.8 | 13.5 | -1.5 | 14.2 | -1.19 | 0.0 | 0.0 | 0.0 | 3 | 0.1 | -4.3 | 1.6 | 24.6 |
| Percent of Normal | 83 | 325 | 75 | 333 | 1 | 0 | 0 | 0 | 1100 | 103 | 0 | 133 | 166 |
| Rank - Least to Most 103 years (P.O.R 1918-2020) |
57 | 97 | 82 | 94 | 70 | NA | NA | NA | 95 | 66 | 15 | 71 | 100 |
|
|||||||||||||
| Greatest 24-HR Total | 2.5 | 9 | 2 | 8 | T | 0 | 0 | 0 | 2.9 | 2.5 | T | 2.3 | 2.9 |
| Dates of Occurrence | 28 | 3 | 2 | 12 | 31 | NA | NA | NA | 8 | 25 | 9,10 | 15 | 9/8 |
| Number of Days with: | |||||||||||||
| Snowfall >= 1.0 inch | 1 | 5 | 3 | 4 | 0 | 0 | 0 | 0 | 1 | 2 | 0 | 3 | 19 |
| Daily Snowfall Records Set or Tied | 0 | 0 | 0 | 1 | 0 | 0 | 0 | 0 | 2 | 0 | 0 | 0 | 3 |
|
* 69 months of May on record a trace or 0.0" of snowfall. |
|||||||||||||
One Day Snowfall Records (inches):
April: 8.0" on the 12th.September: 2.9" on the 8th, and 0.4" on the 9th.
| Top Ten Snowiest February's on Record | |||||||
| Rank | Year | Snowfall (inches) | |||||
| 1 | 1986 | 22.5 | |||||
| 2 | 2020 | 19.5 | |||||
| 3 | 2014 | 17.8 | |||||
| 4 | 2003 | 16.9 | |||||
| 5 | 1958 | 16.0 | |||||
| 6 | 2002 | 15.3 | |||||
| 7 | 2016 | 15.1 | |||||
| 8 | 1964 | 13.5 | |||||
| 9 | 1934,1919 | 13.0 | |||||
| Top Ten Snowiest April's on Record | |||||||
| Rank | Year | Snowfall (inches) | |||||
| 1 | 1998 | 31.7 | |||||
| 2 | 1919 | 29.0 | |||||
| 3 | 2012 | 24.7 | |||||
| 4 | 1944 | 22.1 | |||||
| 5 | 1921 | 21.0 | |||||
| 6 | 2016 | 20.9 | |||||
| 7 | 2020 | 20.3 | |||||
| 8 | 1926 | 18.0 | |||||
| 9 | 1978, 1933 | 17.0 | |||||
| Top Ten Snowiest September's on Record | |||||||
| Rank | Year | Snowfall (inches) | |||||
| 1 | 1982 | 13.0 | |||||
| 2 | 2013 | 5.7 | |||||
| 2 | 2000 | 5.7 | |||||
| 4 | 1965 | 5.0 | |||||
| 5 | 1946 | 4.0 | |||||
| 5 | 1944 | 4.0 | |||||
| 7 | 2020 | 3.3 | |||||
| 8 | 1929 | 3.0 | |||||
| 9 | 1999 | 2.8 | |||||
| 10 | 1945 | 2.0 | |||||
| Top Ten Snowiest Years on Record | |||||||
| Rank | Year | Snowfall (inches) | |||||
| 1 | 1920 | 77.0 | |||||
| 2 | 2017 | 71.1 | |||||
| 3 | 2013 | 70.6 | |||||
| 4 | 2009 | 62.5 | |||||
| 5 | 2020 | 61.7 | |||||
| 5 | 2016 | 61.7 | |||||
| 7 | 2010 | 60.1 | |||||
| 8 | 1919 | 58.0 | |||||
| 9 | 1923 | 56.2 | |||||
| 10 | 1944 | 55.4 | |||||
 |
 |
 |
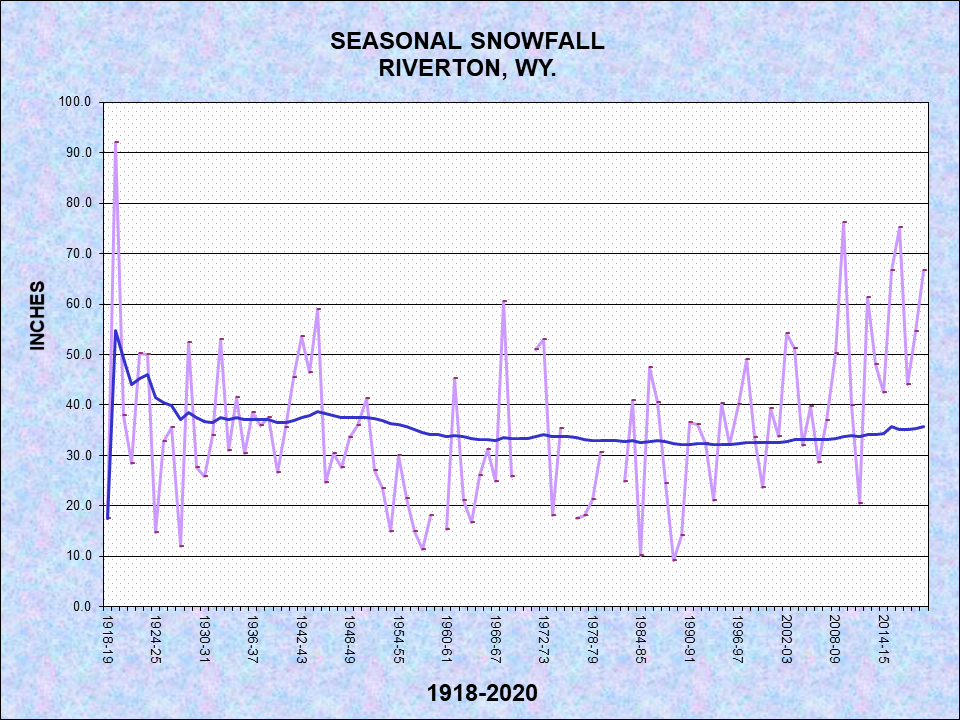 |
| Annual and Seasonal Snowfall for Period of Record - Click on Graph to Enlarge | |
|
Learn more about the National Weather Service's efforts to build a Weather-Ready Nation! |
|
Learn more about the National Weather Service's efforts to build a Weather-Ready Nation! |
Top 5 Events of 2018 (video presentations):
| Numbers 5 through 2 | Number 1: The Roosevelt Fire |


 Follow us on YouTube