Where will the clouds block the Eclipse on Monday?
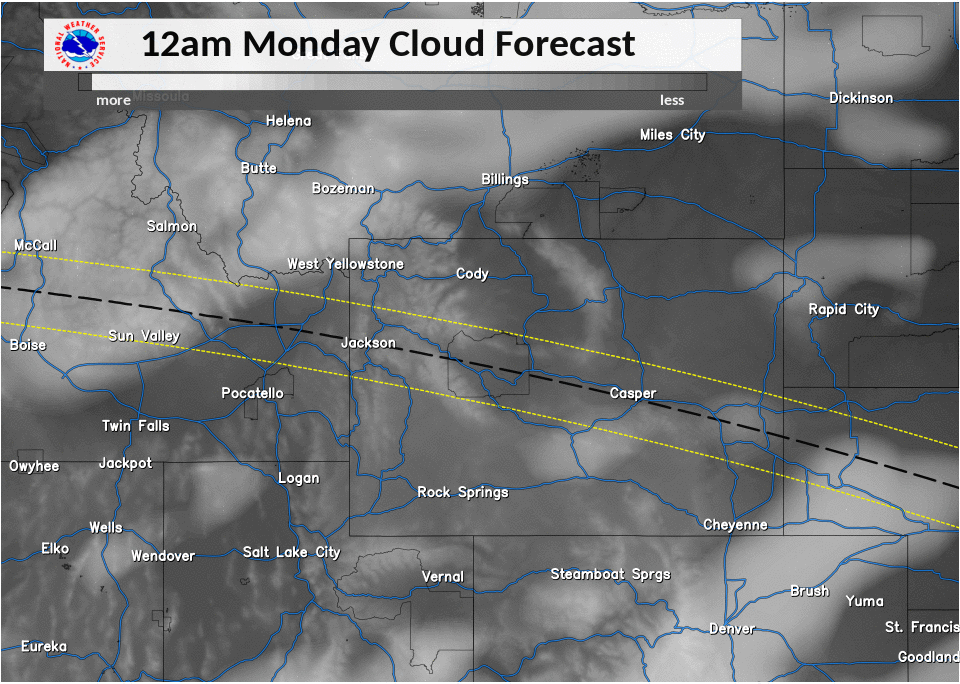
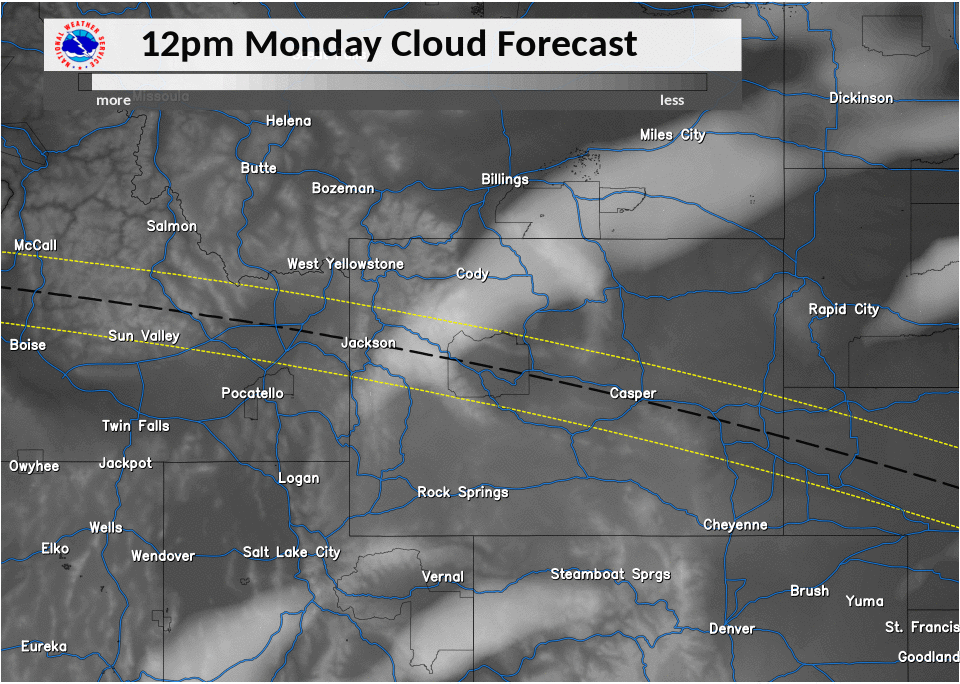
Currently, that all depends on what weather model we look at. When these numerical models continue to display differences in the timing of weather systems, fronts and associated cloud cover, a forecaster's confidence will typically be low in determining what specific areas will be cloudy or sunny at a given time. However, we can pick up on trends and areas of agreement. For Monday morning, all the model runs shown here from Friday evening are displaying a band of clouds or higher mid-level moisture ahead of an upper level disturbance moving southeast into northwest Wyoming, and also some clouds pushing up from the south from the Great Basin. The first animated loop below paints the general setup. This Global Forecast System (GFS) simulation shows the progress of the most extensive cloud cover (in bright white) across Wyoming from midnight MDT Sunday night through 6 pm MDT Monday. Click on any image to enlarge it. |
|
GFS Simulated Cloud Cover Animation (All Times MDT) - Click on Image to Enarge |
|
 |
|
A Comparison of Four Weather Models at Noon MDT on Monday (Click on Images to Enlarge) |
|
|
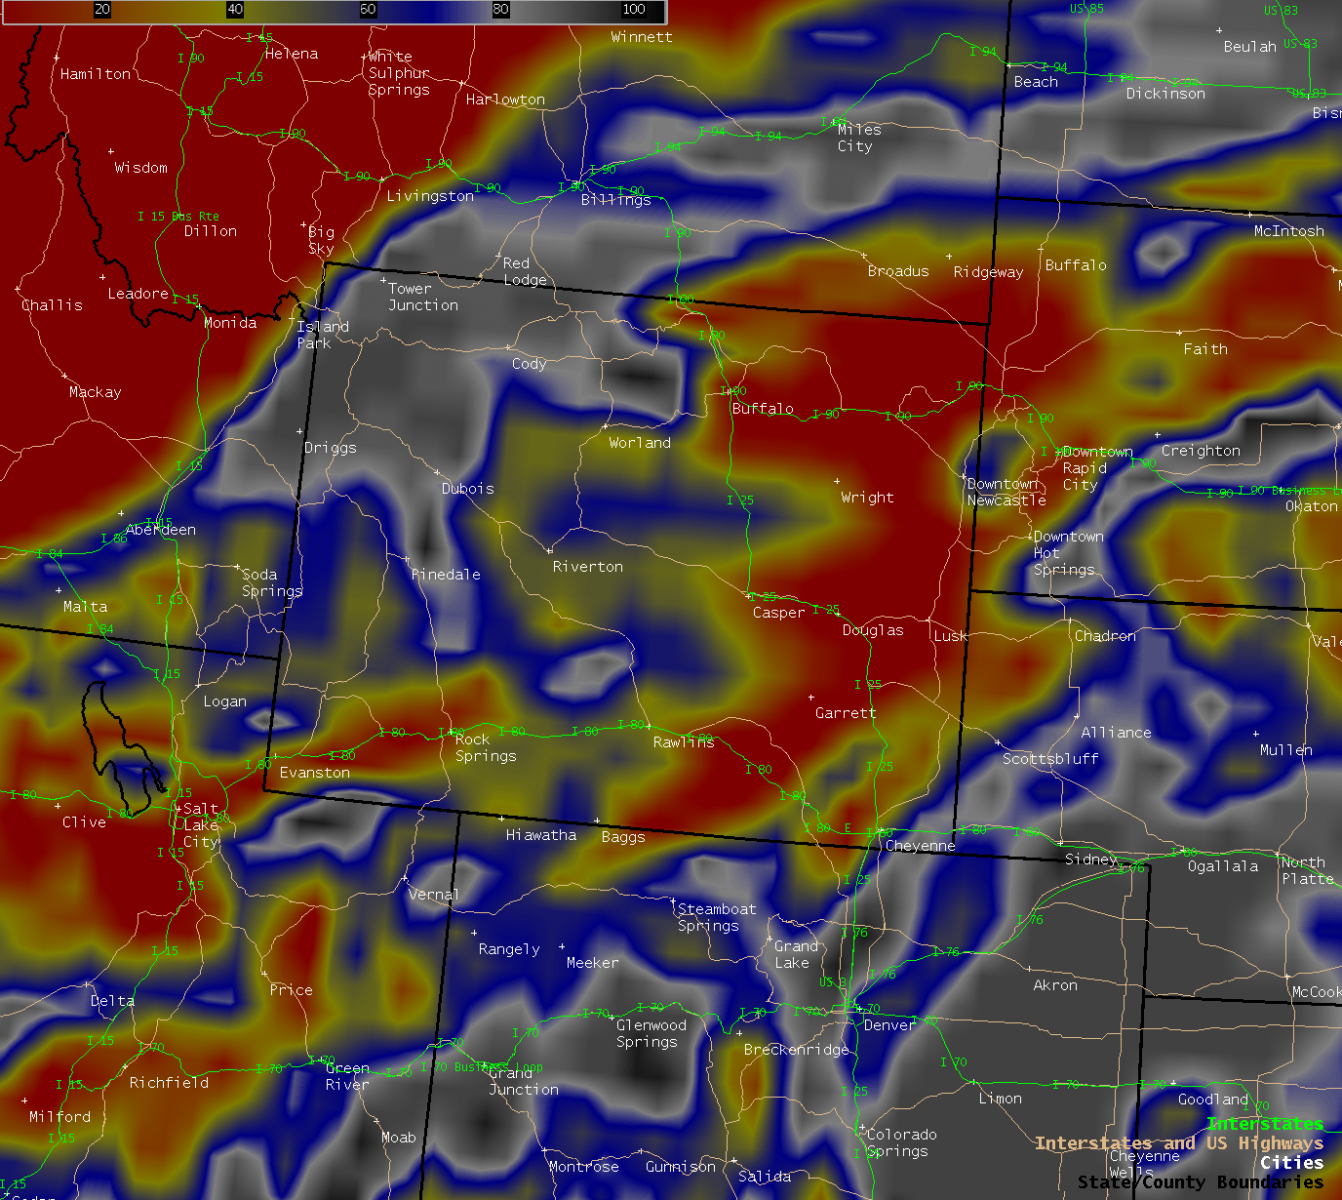
And now here are four different numerical model displays of cloud cover or mid-level moisture at Noon MDT on Monday, shortly after the total eclipse across Wyoming. Bright white in the top two images show the more extensive cloud cover. Gray colors show more extensive cloud cover in the bottom two images with yellow and reds representing clearer skies or drier air. Comparing the top two images, the NAM on the right is faster than the GFS (left) in moving the band of clouds across northwest Wyoming. The Canadian model in the lower left shows more extensive cloud cover across northwest Wyoming. The best case scenario with the least potential cloud cover is the ECMWF (European Centre Model) in the lower right. |
|
GFS Cloud Forecast |
NAM (North American Model) Cloud Forecast |
 |
 |
Canadian Model Cloud Forecast |
European Centre Model (ECMWF)
|
 |
 |
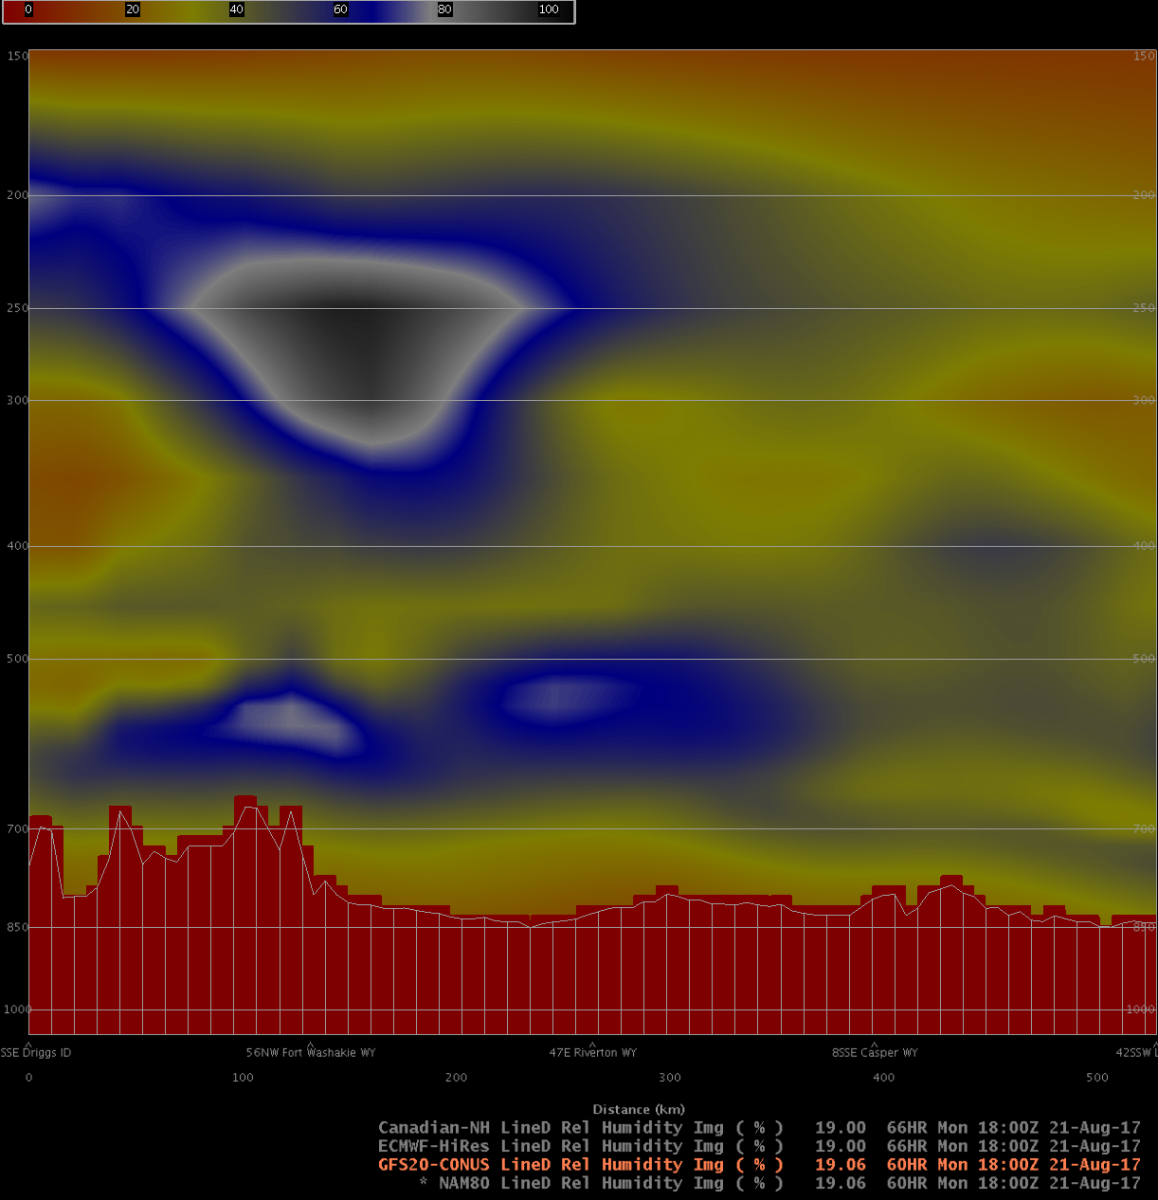
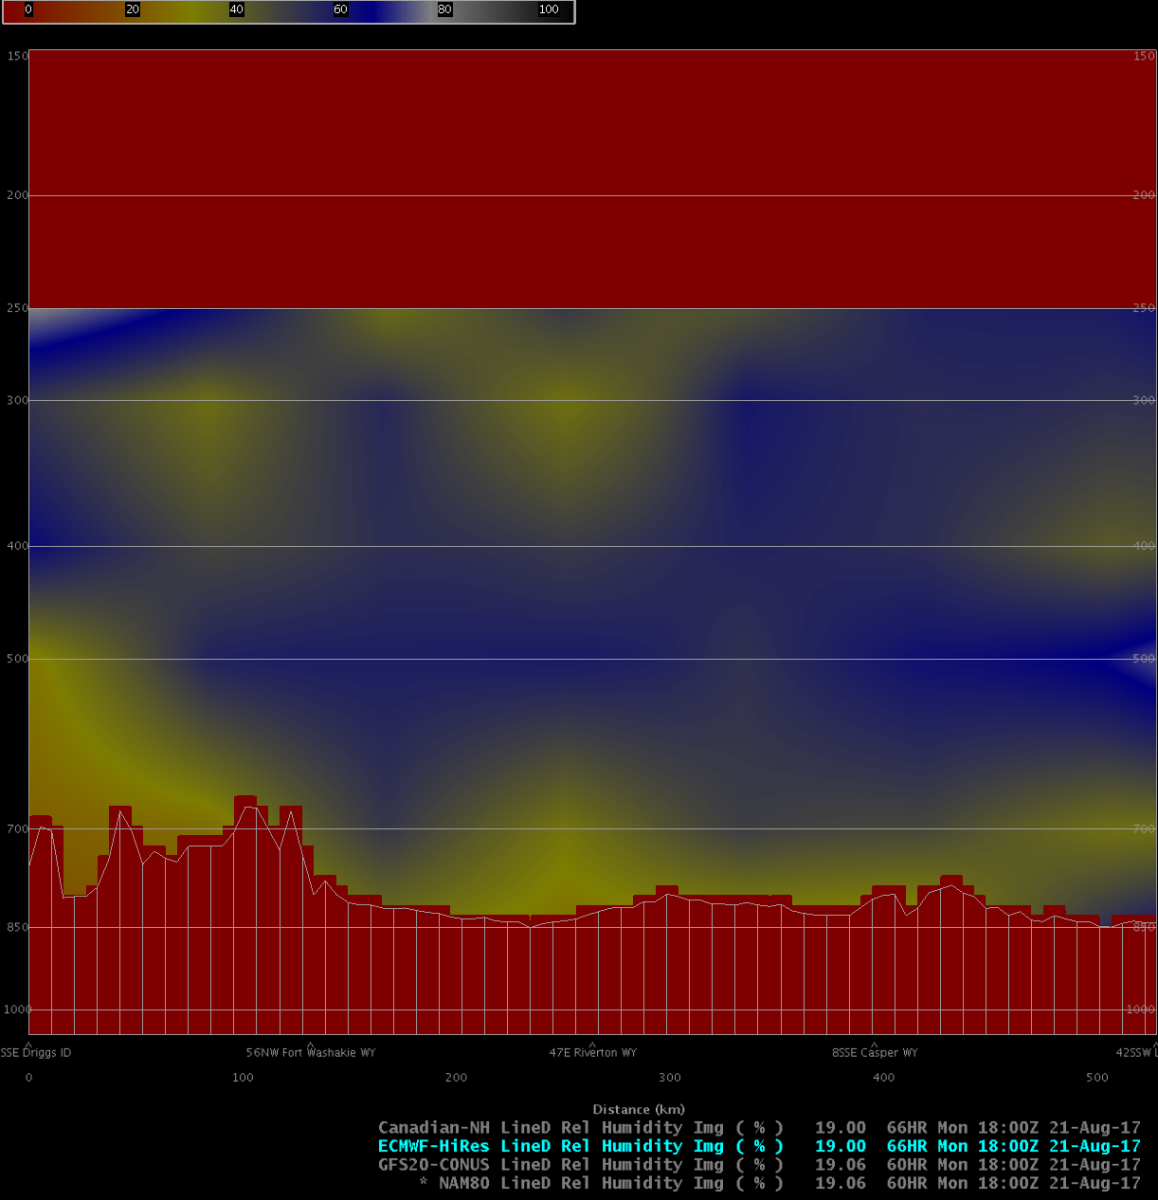
Forecast Sky Cover Along The Path of Totality From Jackson to Glendo - The Bad and the Good |
|
|
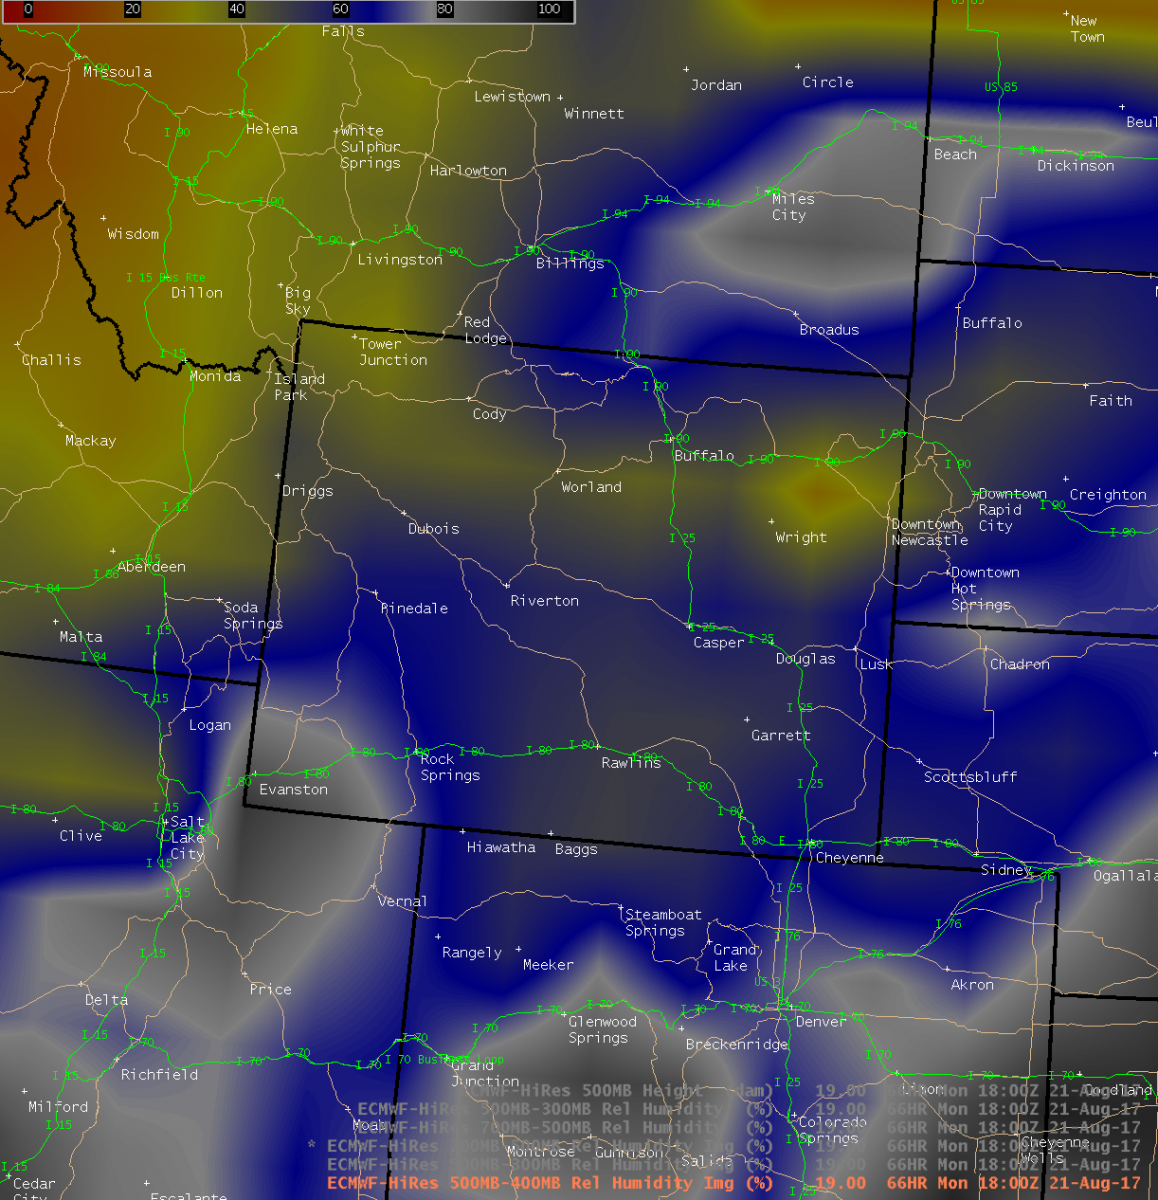
Lastly, let's take a slice of the atmosphere from near Jackson (left) to Glendo (right) along the path of totality displayed on the graphs below. These are model projections of atmospheric relative humidity (Red and yellow are the drier colors, the gray colors show a nearly saturated layer and high potential for cloud formation; red colors at the bottom are the terrain) . One of the wetter models, the GFS shows some high level moisture (potential high clouds) and a some lower level moisture mainly in the vicinity of Togwotee Pass to Riverton. The more optimistic ECMWF in the bottom graphic shows a drier atmosphere along the entire path of totality between Jackson and Glendo. GFS Cross Section from Jackson (left) to Glendo (right) at Noon MDT Monday, August 21st
|
|
 |
|
|
|
|
ECMWF Cross Section from Jackson (left) to Glendo (right) at Noon MDT on Monday, August 21st |
|
 |
|


 Follow us on YouTube