|
Local Weather History For April 24th...
|
|
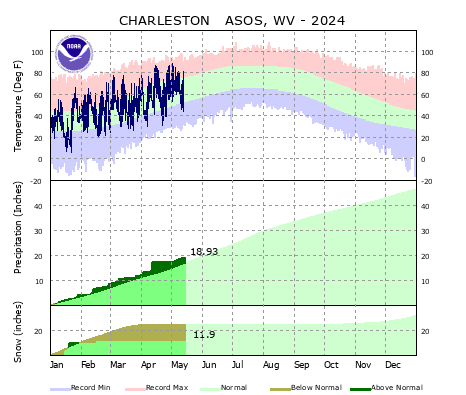
In 197, a warm month of April continued as temperatures hovered around 90 degrees in the Charleston
area.
|
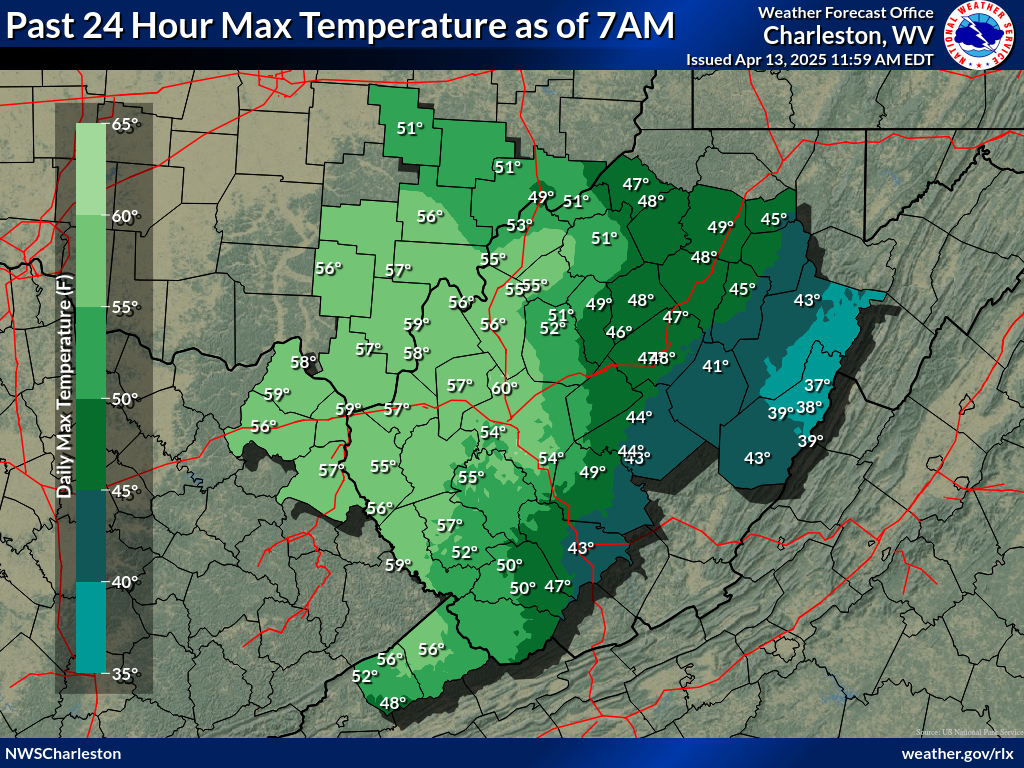
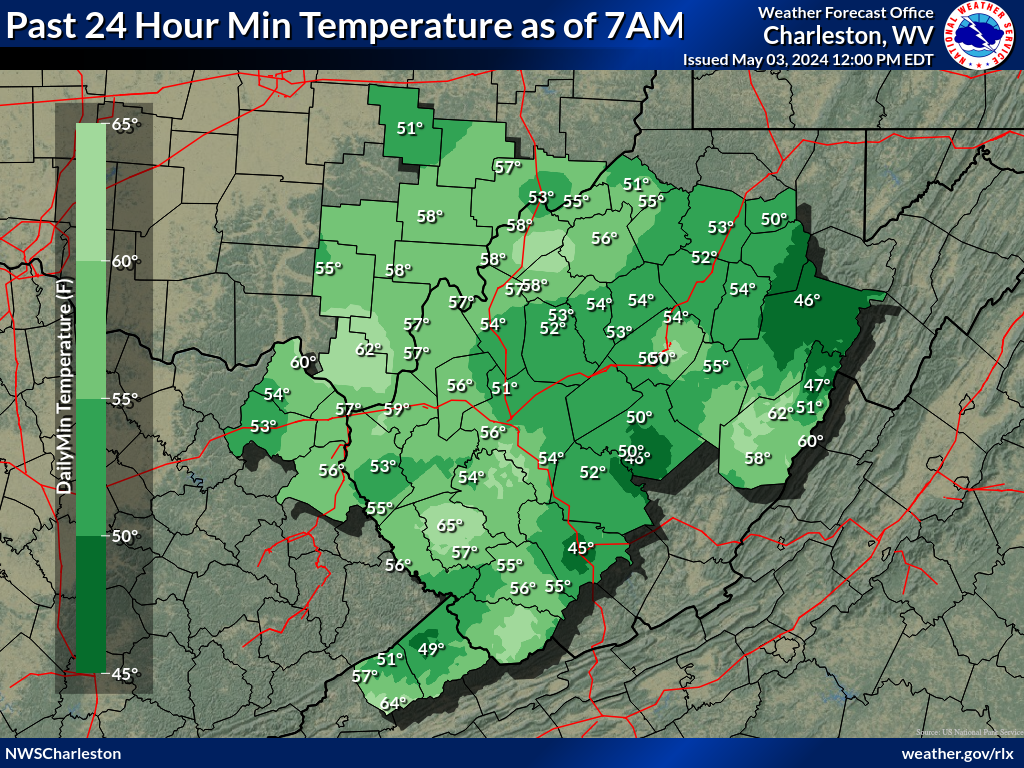
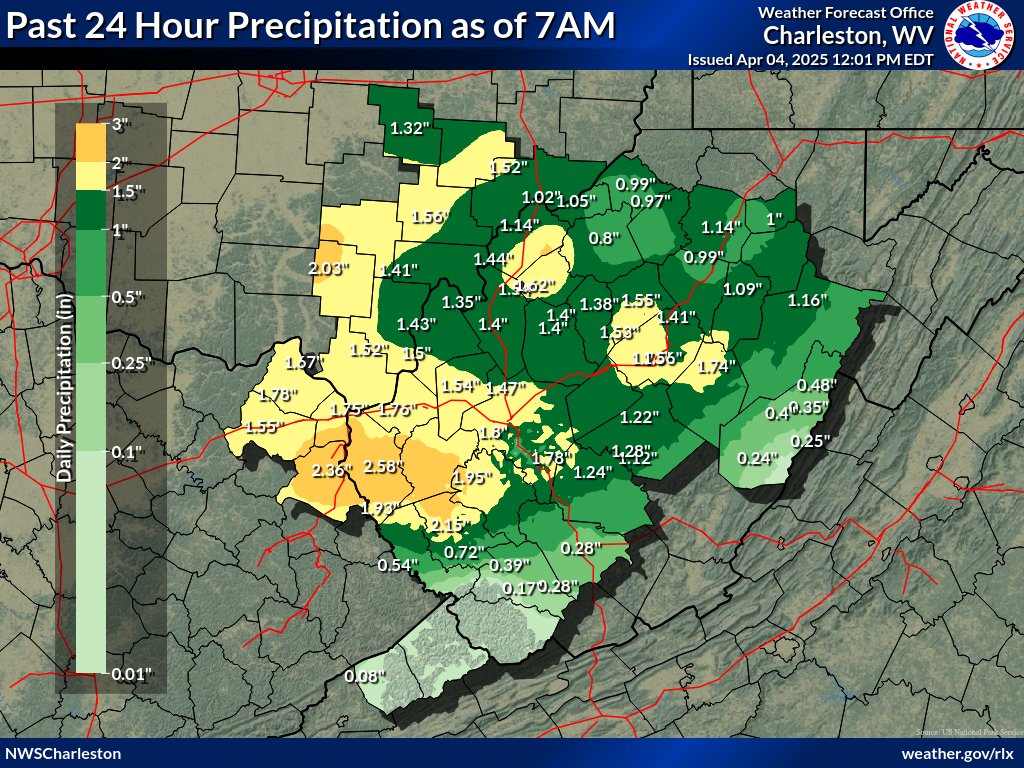
Daily temperature and precipitation maps covering the past 24 hours from 7 A.M. to 7 A.M. EST/EDT. Snow depth is based on measurement at 7 A.M. of the day shown. Maps are generally updated around 10:30 A.M. each day. Ranked listings by state of the individual station reports is provided on our full climate maps page at http://www.weather.gov/rlx/climatemaps.
| Max Temp | Min Temp | Precip | Snowfall | Snow Depth |
 |
 |
 |
 |
 |
Select drop-down menu for other sites and months
|
|
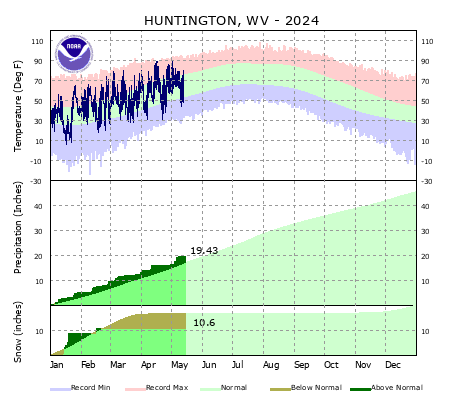
Huntington, WV |
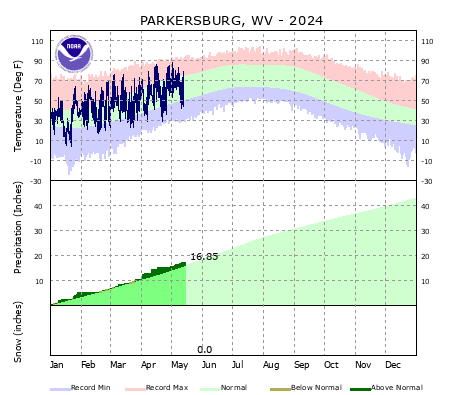
Parkersburg, WV |
|
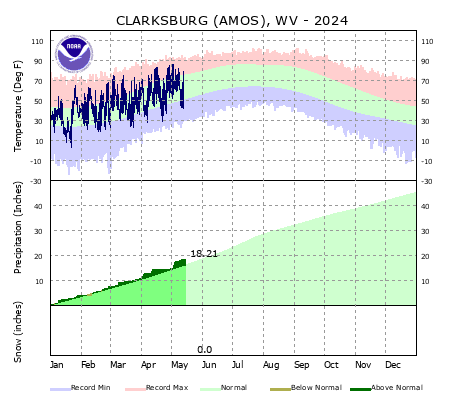
Clarksburg, WV |
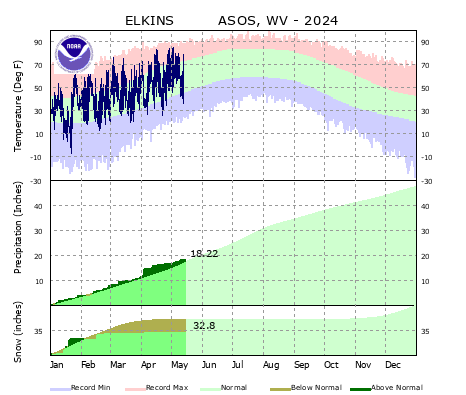
Elkins, WV |
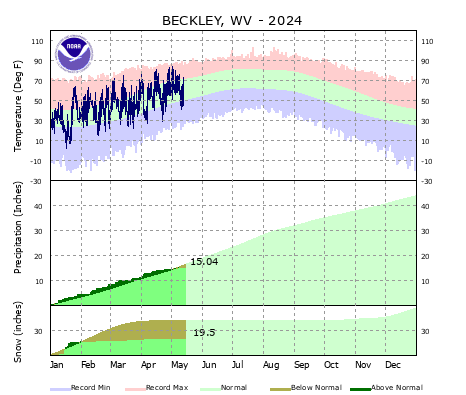
Beckley, WV |