Monthly Climate Normals - Vichy (1991-2020)
| Month | Total Precipitation Normal (inches) | Mean Max Temperature Normal (°F) | Mean Min Temperature Normal (°F) | Mean Avg Temperature Normal (°F) |
|---|---|---|---|---|
| January | 2.22 | 40.8 | 22.4 | 31.6 |
| February | 2.06 | 45.9 | 26.3 | 36.1 |
| March | 3.40 | 56.3 | 34.9 | 45.6 |
| April | 4.71 | 67.0 | 44.6 | 55.8 |
| May | 5.35 | 74.9 | 54.4 | 64.7 |
| June | 4.46 | 83.1 | 63.1 | 73.1 |
| July | 4.43 | 87.9 | 67.0 | 77.4 |
| August | 3.66 | 87.0 | 65.6 | 76.3 |
| September | 3.81 | 79.1 | 57.5 | 68.3 |
| October | 3.21 | 67.8 | 46.4 | 57.1 |
| November | 3.45 | 54.9 | 35.2 | 45.1 |
| December | 2.31 | 44.3 | 26.6 | 35.4 |
| Annual | 43.07 | 65.7 | 45.3 | 55.5 |


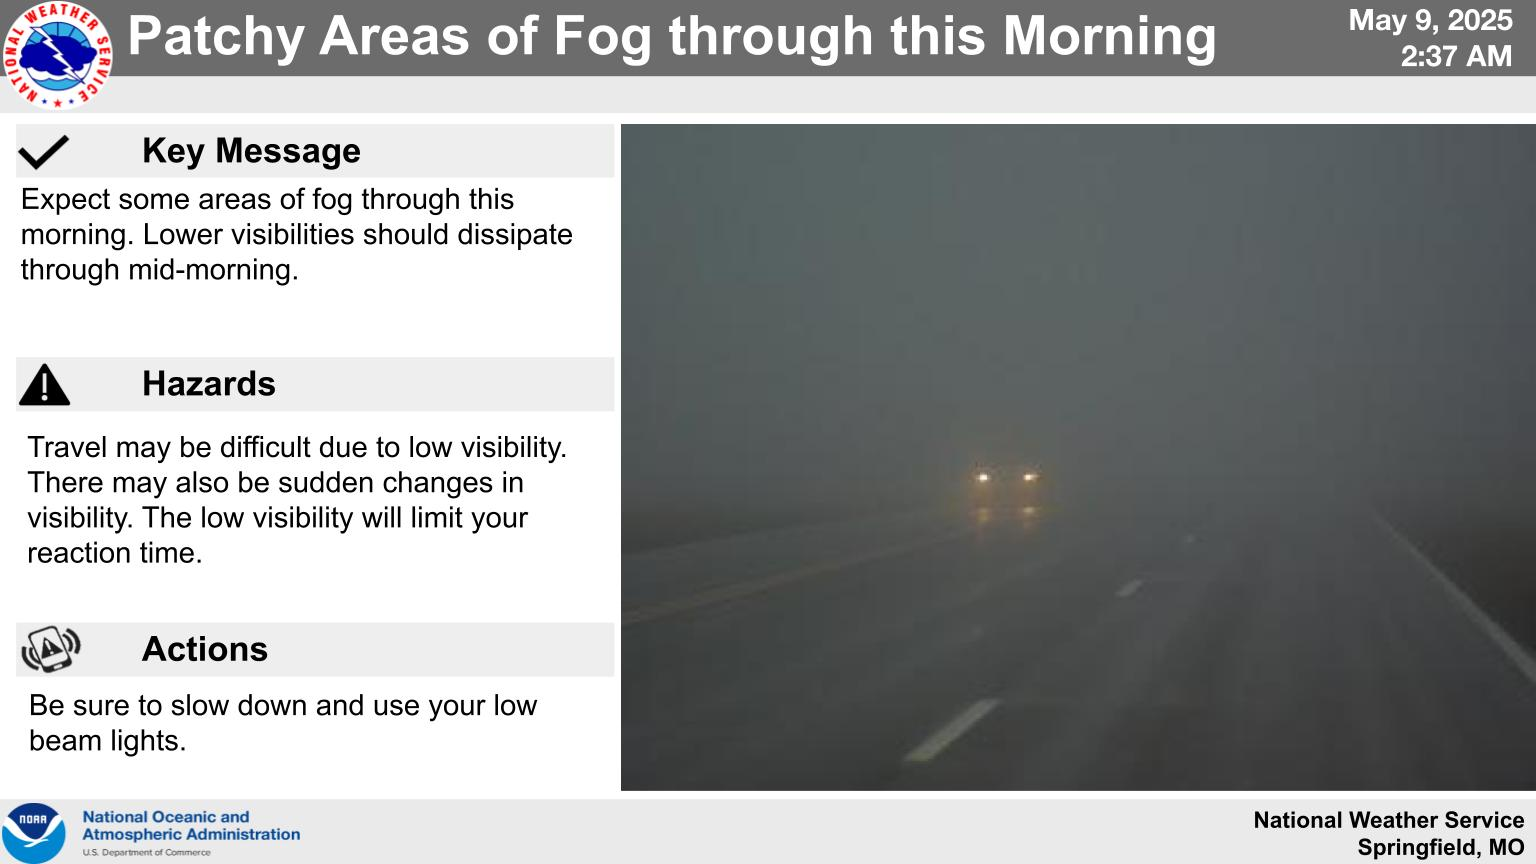 Weather Story
 Weather Map
 Local Radar
 Follow us on YouTube