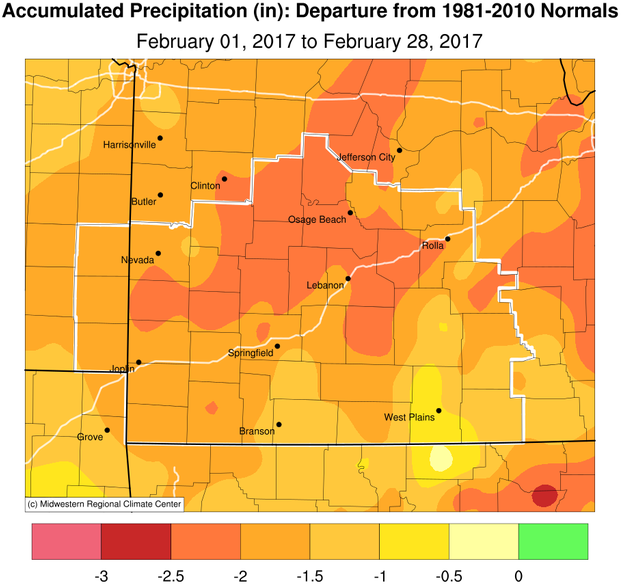
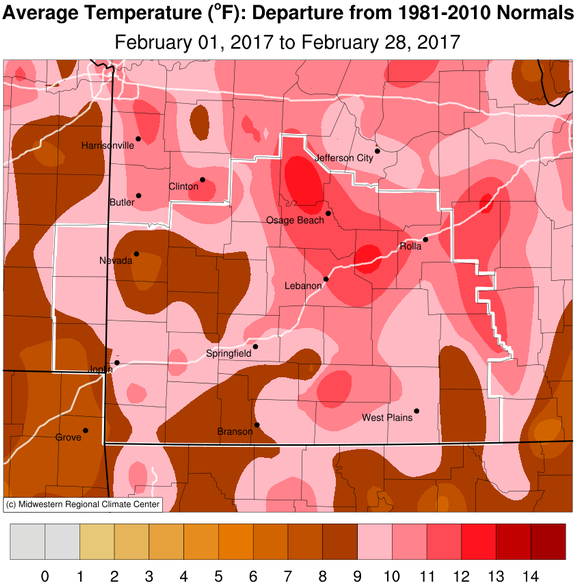
February 2017 was a record-breaking month, with the highest monthly average temperatures at all 4 automated weather sites...Springfield, Joplin, West Plains and Vichy. Most locations were around 9 to over 10 degrees above normal for the month. Precipitation was on the low side for much of the area, with Springfield, Joplin and Vichy all in the top 10 driest Februarys on record.
Overview
Climate Graphs
Normal Departure Maps
Records
Upcoming Normals
Precipitation Report
Daily Data
Monthly Climate Overview
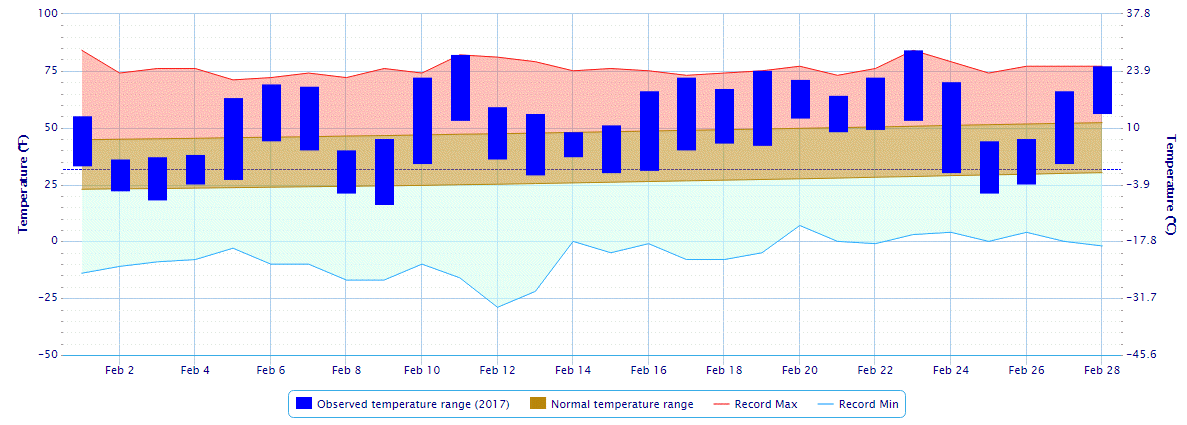
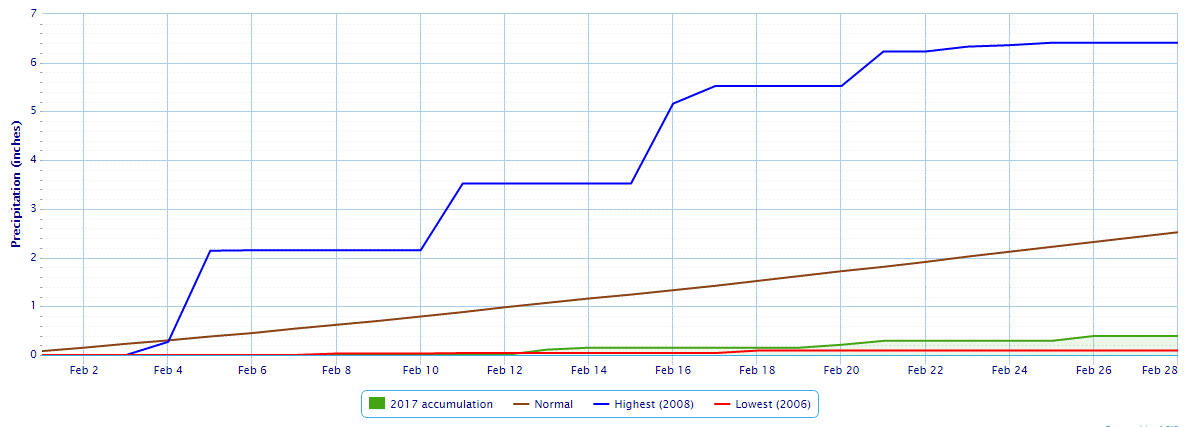
Springfield
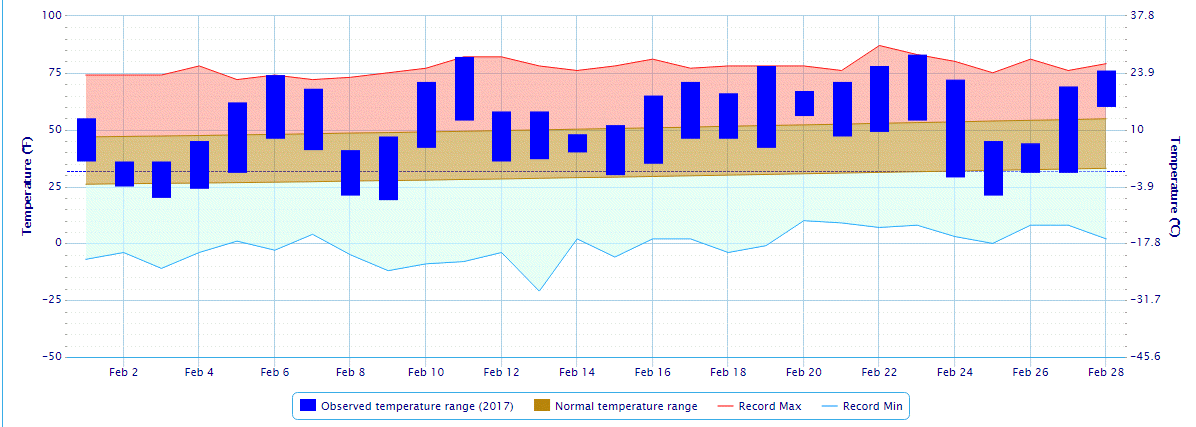
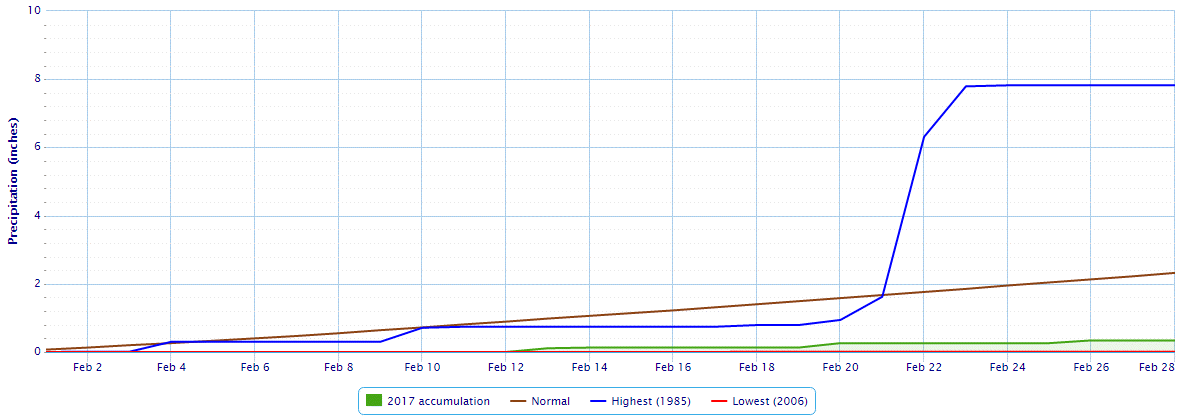
Joplin
West Plains
Vichy
Highest Temperature of the Month
84
83
80
77
Average High Temperature
60.4
61.4
59.7
58.1
Lowest Temperature of the Month
16
19
18
17
Average Low Temperature
35.4
37.5
36.3
33.9
Average Mean Temperature
47.9
49.4
48.0
46.0
Depart from Normal
+ 10.7
+ 9.6
+ 10.1
+ 10.3
Rank
Warmest / 130
Warmest / 88
Warmest / 69
Warmest / 68
Days with highs of 90 degrees or warmer
0
0
0
0
Days with highs of 32 degrees or lower
0
0
0
0
Days with lows of 32 deg F or lower
12
11
13
16
Days with lows of 0 deg F or lower
0
0
0
0
Precipitation (Inches)
0.39
0.34
2.59
0.46
Depart from Normal
- 2.13
- 1.93
- 0.25
- 1.47
Rank
4th driest / 130
8th driest / 107
33rd driest / 69
5th driest / 69
days of 0.01 or greater
5
4
6
3
days of 0.10 or greater
2
2
4
1
days of 0.50 or greater
0
0
2
0
days of 1.00 or greater
0
0
1
0
Monthly Snowfall
Trace
Climate Graphs
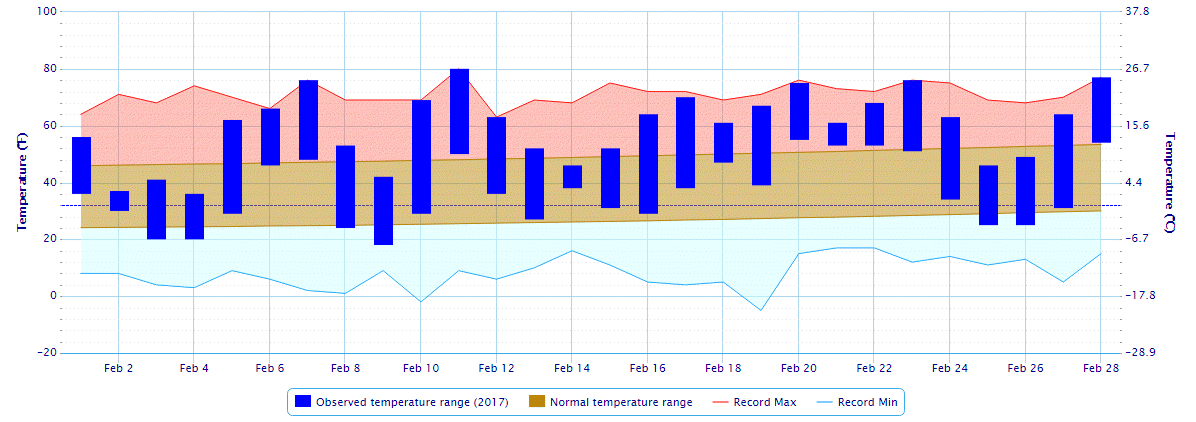
Springfield Temperature Plot for February 2017
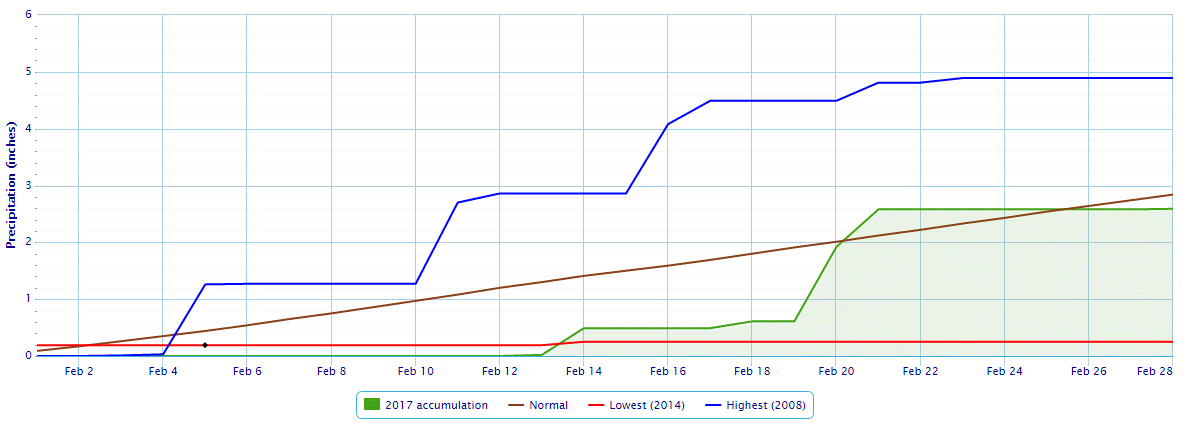
Springfield Precipitation Plot for February 2017
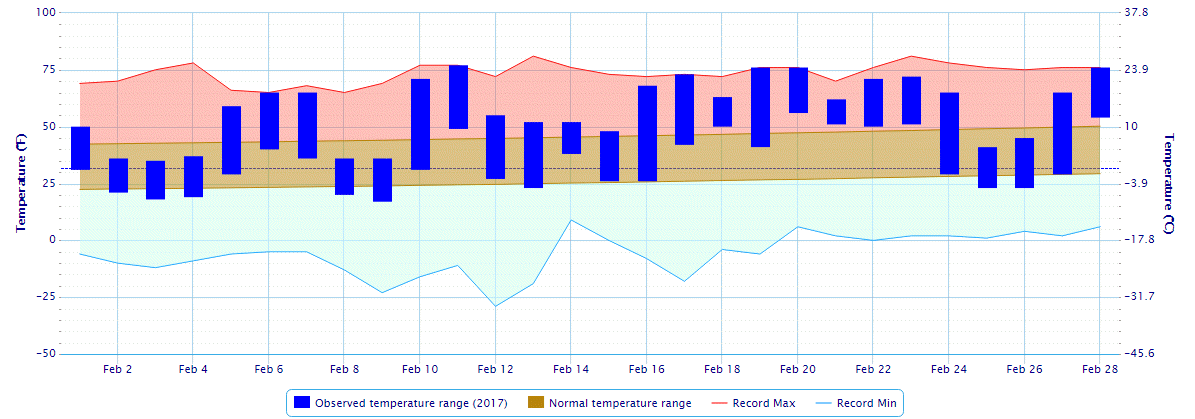
Joplin Temperature Plot for February 2017
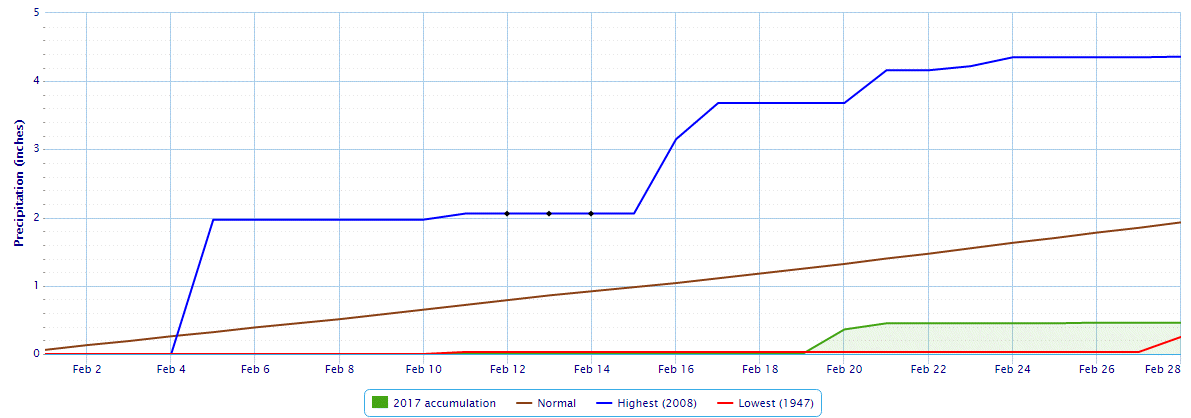
Joplin Precipitation Plot for February 2017
West Plains Temperature Plot for February 2017
West Plains Precipitation Plot for February 2017
Vichy Temperature Plot for February 2017
Vichy Precipitation Plot for February 2017
Monthly Climate Maps
February 2017 Precipitation Departure from Normal
February 2017 Average Temperature Departure from Normal
Monthly Climate Records
List of February 2017 Records
Date
Station
Record
Feb 6th
Joplin
Record high of 74 degrees breaks the old record of 72 in 1904.
West Plains
Record high of 66 degrees tied the old record set back in 2007.
Vichy
Record high of 65 degrees tied the old record set back in 2009.
Feb 11th
West Plains
Record high of 80 degrees breaks the old record of 75 degrees in 1996.
Feb 17th
Vichy
Record high of 73 tied the old record set back in 2011.
Feb 19th
Springfield
Record high of 75 degrees breaks the old record of 72 set in 2016.
Joplin
Record high of 78 degrees breaks the old record of 75 set in 2011.
Vichy
Record high of 76 breaks the old record of 70 set in 2004 and 2016.
Feb 20th
Vichy
Record high of 76 breaks the old record of 75 set in 2016.
Feb 23rd
Springfield
Record high of 84 degrees breaks the old record of 79 set in 1982.
Joplin
Record high of 83 degrees breaks the old record set in 1982.
Feb 28th
Vichy
Record high of 76 degrees breaks the old record of 75 set in 2006.
Springfield
Record high of 77 degrees tied the old mark set back in 2006.
West Plains
Record high of 77 degrees tied the old mark set back in 1955.
Monthly Records
Feb 23rd
Springfield
All time highest temperature was tied for the Month of February was recorded when reading hit 84 degrees.
Average
Springfield
Highest average temperatures for month of February of 47.9 breaks the old record of 46.7 set in 1930.
Average
Joplin
Highest average temperatures for month of February of 49.4 breaks the old record of 47.4 set in 1976.
Average
West Plains
Highest average temperatures for month of February of 48.0 breaks the old ASOS record of 44.6 set in 2000 and the COOP station of 46.4 set back in 1976.
Average
Vichy
Highest average temperatures for the month of February of 46.0 breaks the old record of 45.0 set back in 1976.
Monthly Climate Normals
Normal Conditions for the Upcoming 3 Months
Springfield
High
Low
Precip.
Snowfall
March
57.5
35.2
3.62
2.4
April
67.2
44.3
4.32
0.0
May
75.3
54.4
5.10
0.0
Joplin
High
Low
Precip.
Snowfall
March
60.1
37.7
3.42
1.1
April
70.0
46.9
4.47
0.0
May
77.7
56.2
5.71
0.0
West Plains
High
Low
Precip.
March
59.5
35.5
4.29
April
69.7
45.1
4.48
May
76.7
54.2
4.94
Vichy
High
Low
Precip.
March
56.3
34.3
3.45
April
66.7
43.8
4.22
May
74.5
53.2
5.04
Precipitation Report
Monthly Data for February 2017 for Springfield MO NWS CWA
State
Name
Station Type
Total Precipitation
MO
MONTAUK SP
COOP
2.90
MO
WEST PLAINS MUNI AP
WBAN
2.59
MO
ALTON 1.7 NNW
CoCoRaHS
2.44
MO
POTTERSVILLE 0.7 NNW
CoCoRaHS
2.33
MO
RAYMONDVILLE 3.5 SE
CoCoRaHS
2.24
MO
SALEM 4.3 S
CoCoRaHS
2.20
MO
WEST PLAINS 1.0 W
CoCoRaHS
2.19
MO
WEST PLAINS 10.6 S
CoCoRaHS
2.14
MO
W PLAINS
WBAN
2.10
MO
WEST PLAINS 1.5 NW
CoCoRaHS
2.09
MO
PROTEM
CoCoRaHS
2.01
MO
TECUMSEH
COOP
1.99
MO
SALEM 1.8 NW
CoCoRaHS
1.99
MO
WINONA FOREST RS
COOP
1.93
MO
THEODOSIA 6.2 SW
CoCoRaHS
1.75
MO
OZARK 1.6 SE
CoCoRaHS
1.73
MO
WEST PLAINS 8.3 NNE
CoCoRaHS
1.68
MO
DORA 1N
COOP
1.60
MO
EMINENCE 1 N
COOP
1.54
MO
HOUSTON 6.3 ESE
CoCoRaHS
1.54
MO
EMINENCE 0.1 SSE
CoCoRaHS
1.49
MO
BRANSON AP
COOP
1.47
MO
OZARK BEACH
COOP
1.41
MO
FORSYTH 0.9 S
CoCoRaHS
1.41
MO
HOUSTON 4.5 ESE
CoCoRaHS
1.39
MO
HOUSTON
COOP
1.38
MO
SALEM 10 W
WBAN
1.38
MO
HOUSTON 0.3 SE
CoCoRaHS
1.37
MO
BIRCH TREE 10.1 SSW
CoCoRaHS
1.36
MO
HOLLISTER 3.8 SW
CoCoRaHS
1.34
MO
TABLE ROCK DAM
COOP
1.32
MO
MOUNTAIN GROVE 14.0 S
CoCoRaHS
1.28
MO
BRANSON 3.8 E
CoCoRaHS
1.27
MO
ALTON 6 SE
COOP
1.16
MO
ROUND SPRING
COOP
1.16
MO
ELDORADO SPRINGS
COOP
1.12
MO
MOUNTAIN VIEW 7.0 NE
CoCoRaHS
1.10
MO
WEST PLAINS 1.3 SE
CoCoRaHS
1.08
MO
SHELL KNOB 5.6 ESE
CoCoRaHS
1.07
MO
EMERALD BEACH 5.5 E
CoCoRaHS
1.06
MO
ISABELLA 2.0 NNW
CoCoRaHS
1.06
MO
AVA 0.8 NNW
CoCoRaHS
1.05
MO
SELIGMAN 3.0 N
CoCoRaHS
1.00
MO
CASSVILLE 4.8 SSE
CoCoRaHS
1.00
MO
HOUSTON 2.0 S
CoCoRaHS
1.00
MO
AVA 12 SW
COOP
0.96
MO
MORRISVILLE 2SW
COOP
0.96
MO
ANDERSON 3W
COOP
0.94
MO
ANDERSON 6.8 W
CoCoRaHS
0.94
MO
NOEL 3.8 NNE
CoCoRaHS
0.93
MO
CASSVILLE 0.5 SW
CoCoRaHS
0.90
MO
MANSFIELD 3.7 SSE
CoCoRaHS
0.89
MO
AVA 6NW
COOP
0.88
MO
AVA 6.0 NW
CoCoRaHS
0.87
MO
SALEM 14.9 E
CoCoRaHS
0.82
MO
MTN GROVE 2 N
COOP
0.81
MO
ROLLA 8.1 S
CoCoRaHS
0.81
MO
ST. JAMES 10.1 SSE
CoCoRaHS
0.81
MO
ANDERSON 3.2 NNW
CoCoRaHS
0.80
MO
MANSFIELD
COOP
0.76
MO
BATTLEFIELD 3.3 E
CoCoRaHS
0.71
MO
NEOSHO 3.9 WNW
CoCoRaHS
0.69
MO
MOUNTAIN GROVE 13.0 NNW
CoCoRaHS
0.67
MO
SPRINGFIELD 0.7 ENE
CoCoRaHS
0.66
MO
MARSHFIELD 3.6 S
CoCoRaHS
0.65
MO
HURLEY 3.5 NNE
CoCoRaHS
0.64
MO
ROLLA 1.3 NE
CoCoRaHS
0.64
MO
VIENNA 4.3 NNW
CoCoRaHS
0.63
MO
ST. JAMES 1.2 SE
CoCoRaHS
0.63
MO
WAYNESVILLE 3.9 NNW
CoCoRaHS
0.62
MO
ROLLA 7.6 SSE
CoCoRaHS
0.62
MO
CRANE 0.7 SSW
CoCoRaHS
0.61
MO
FORT LEONARD WOOD 5.4 SE
CoCoRaHS
0.61
MO
ROLLA 2.5 NW
CoCoRaHS
0.61
MO
SHOAL CREEK ESTATES 0.2 SE
CoCoRaHS
0.58
MO
GALENA
COOP
0.58
MO
ROLLA UNI OF MISSOURI
COOP
0.58
MO
ROLLA 3.2 SSW
CoCoRaHS
0.58
MO
BILLINGS 2 N
COOP
0.57
MO
STARK CITY 5.5 ENE
CoCoRaHS
0.57
MO
REPUBLIC 0.8 SE
CoCoRaHS
0.57
MO
SPRINGFIELD 5.3 SSW
CoCoRaHS
0.55
MO
OZARK
COOP
0.54
MO
MARSHFIELD 3.7 SE
CoCoRaHS
0.54
MO
NIXA 2.7 SSW
CoCoRaHS
0.53
MO
ROLLA 3.0 WSW
CoCoRaHS
0.53
MO
EMERALD BEACH 3.0 S
CoCoRaHS
0.52
MO
PURDY 4.8 SSW
CoCoRaHS
0.52
MO
MONETT 1.8 N
CoCoRaHS
0.52
MO
LEBANON 2.4 SE
CoCoRaHS
0.52
MO
MARSHFIELD
COOP
0.51
MO
MONETT
WBAN
0.50
MO
NEWBURG 9.6 SSW
CoCoRaHS
0.50
MO
JOPLIN 4.2 SW
CoCoRaHS
0.49
MO
GAINESVILLE 6.2 ENE
CoCoRaHS
0.49
KS
COLUMBUS
COOP
0.48
MO
DIAMOND 2 W
COOP
0.48
MO
CLEVER 4.0 ENE
CoCoRaHS
0.48
MO
HARTVILLE 0.5 SSE
CoCoRaHS
0.48
MO
NEOSHO
COOP
0.47
MO
SPRINGFIELD WFO
COOP
0.47
MO
VICHY ROLLA NATIONAL AP
WBAN
0.46
MO
BROOKLINE 2.3 NNW
CoCoRaHS
0.45
MO
ELDON
COOP
0.45
MO
CONWAY 8.9 SW
CoCoRaHS
0.45
MO
CARL JUNCTION 3.4 WSW
CoCoRaHS
0.42
MO
MARSHFIELD 0.9 SE
CoCoRaHS
0.42
MO
ASH GROVE 4S
COOP
0.41
MO
WASHBURN 5 W
COOP
0.41
MO
MOUNT VERNON 0.2 E
CoCoRaHS
0.39
MO
SPRINGFIELD RGNL AP
WBAN
0.39
MO
WILLARD 2.6 W
CoCoRaHS
0.39
MO
HALLTOWN 5 NW
COOP
0.38
MO
MOUNT VERNON 1.3 NNW
CoCoRaHS
0.36
MO
WILLARD 5.8 NNE
CoCoRaHS
0.36
MO
CARTHAGE 1.5 S
CoCoRaHS
0.35
KS
PITTSBURG 0.7 WSW
CoCoRaHS
0.35
MO
MILLER 6.2 WNW
CoCoRaHS
0.35
MO
FAIR GROVE 4.7 SSW
CoCoRaHS
0.35
MO
JOPLIN REGIONAL AIRPORT
WBAN
0.34
MO
TUSCUMBIA 0.1 S
CoCoRaHS
0.34
KS
MCCUNE 1.6 NW
CoCoRaHS
0.33
KS
PITTSBURG
COOP
0.33
MO
BRUMLEY 5.6 SW
CoCoRaHS
0.33
KS
WALNUT 3 S
COOP
0.32
MO
CARTHAGE 0.8 S
CoCoRaHS
0.32
MO
LEBANON 1.3 E
CoCoRaHS
0.32
MO
IBERIA 5.6 NE
CoCoRaHS
0.32
MO
SPRINGFIELD 4.0 SW
CoCoRaHS
0.31
MO
LEBANON 2W
COOP
0.30
MO
FT LEONARD WOOD
COOP
0.30
MO
JOPLIN 24 N
WBAN
0.28
KS
PITTSBURG 4.9 WSW
CoCoRaHS
0.28
MO
REPUBLIC 0.8 ESE
CoCoRaHS
0.27
MO
IBERIA
COOP
0.27
MO
PHILLIPSBURG 5.0 NW
CoCoRaHS
0.27
MO
LOCKWOOD
COOP
0.26
MO
WALNUT GROVE 5.2 SE
CoCoRaHS
0.26
KS
CHEROKEE 0.3 N
CoCoRaHS
0.24
MO
WAYNESVILLE 2 W
COOP
0.24
MO
WAYNESVILLE 3.5 WSW
CoCoRaHS
0.24
MO
SALEM
COOP
0.24
MO
GOLDEN CITY 6 S
COOP
0.23
MO
CARTHAGE 3.8 SW
CoCoRaHS
0.21
MO
MILLER 1 E
COOP
0.21
MO
GREENFIELD 0.8 SSW
CoCoRaHS
0.20
MO
BUFFALO
COOP
0.20
MO
LEBANON 0.6 N
CoCoRaHS
0.20
MO
BUFFALO 1.0 SW
CoCoRaHS
0.20
MO
BOLIVAR 9.0 N
CoCoRaHS
0.19
KS
FT SCOTT
COOP
0.18
MO
BOLIVAR 2.7 NE
CoCoRaHS
0.18
MO
ALDRICH 5.0 ESE
CoCoRaHS
0.17
MO
MYRTLE 0.3 E
CoCoRaHS
0.17
MO
LAMAR 7N
COOP
0.16
MO
UMBER VIEW HEIGHTS 0.1 WSW
CoCoRaHS
0.16
MO
LINN CREEK 9.4 SE
CoCoRaHS
0.16
MO
MARSHFIELD 1.4 W
CoCoRaHS
0.16
KS
FORT SCOTT 8.2 SW
CoCoRaHS
0.15
KS
GARLAND 2.7 SW
CoCoRaHS
0.15
MO
STOCKTON 2.5 NNE
CoCoRaHS
0.15
MO
STOCKTON 5.6 S
CoCoRaHS
0.15
MO
BOLIVAR 1 NE
COOP
0.15
KS
GIRARD
COOP
0.14
MO
NEVADA WTP
COOP
0.14
MO
HAZELGREEN 1 W
COOP
0.14
MO
LAMAR 0.3 ESE
CoCoRaHS
0.13
MO
NEVADA 0.2 W
CoCoRaHS
0.13
MO
STOCKTON 0.2 NW
CoCoRaHS
0.13
MO
FAIR PLAY 1.3 E
CoCoRaHS
0.13
MO
KIMBERLING CITY 1.5 WNW
CoCoRaHS
0.13
MO
GOODSON 0.5 NNW
CoCoRaHS
0.13
KS
FARLINGTON 0.8 NNE
CoCoRaHS
0.12
MO
STOCKTON DAM
COOP
0.12
MO
ROLLA 0.9 SE
CoCoRaHS
0.12
KS
DEVON 0.1 SE
CoCoRaHS
0.11
MO
DUNNEGAN 2.4 NNW
CoCoRaHS
0.11
MO
WHEATLAND 2.7 S
CoCoRaHS
0.11
MO
WEST PLAINS 2.2 NNW
CoCoRaHS
0.10
MO
POMME DE TERRE DAM
COOP
0.10
MO
VERSAILLES
COOP
0.10
MO
LOWRY CITY 3.8 ESE
CoCoRaHS
0.09
MO
BOLIVAR 1.0 ENE
CoCoRaHS
0.09
MO
APPLETON CITY
COOP
0.08
MO
SPRINGFIELD 4.9 SE
CoCoRaHS
0.08
MO
WALNUT GROVE 2.8 NNE
CoCoRaHS
0.07
MO
OSCEOLA 0.3 SW
CoCoRaHS
0.07
MO
FLEMINGTON 4E
COOP
0.06
KS
FORT SCOTT 9.3 NNE
CoCoRaHS
0.05
MO
RICHLAND 3.6 NNE
CoCoRaHS
0.05
MO
HERMITAGE 0.5 ESE
CoCoRaHS
0.05
MO
CASSVILLE
COOP
0.04
MO
VERSAILLES 0.2 SE
CoCoRaHS
0.04
MO
COLLINS 5.5 WNW
CoCoRaHS
0.03
MO
COLLINS 5.6 N
CoCoRaHS
0.02
MO
ELDON 3.8 NW
CoCoRaHS
0.02
MO
COLE CAMP 3NW
COOP
0.02
MO
GRAVOIS MILLS 8.4 S
CoCoRaHS
0.02
MO
ROLLA 8.2 SSE
CoCoRaHS
0.01
MO
MILLER 9.2 WNW
CoCoRaHS
T
MO
EL DORADO SPRINGS 12.0 NE
CoCoRaHS
T
MO
ROLLA 3.3 WSW
CoCoRaHS
T
MO
SUMMERSVILLE
COOP
0.00
MO
LINCOLN 0.4 NNE
CoCoRaHS
0.00
MO
LICKING 4N
COOP
0.00
MO
ROLLA 1.3 S
CoCoRaHS
0.00
Daily Data
Climatological Data for Springfield Area, MO (ThreadEx) - February 2017
Date
Max Temperature
Min Temperature
Avg Temperature
Avg Temperature Departure
HDD
CDD
Precipitation
Snowfall
Snow Depth
2017-02-01
55
33
44.0
10.2
21
0
0.00
0.0
0
2017-02-02
36
22
29.0
-5.0
36
0
0.00
0.0
0
2017-02-03
37
18
27.5
-6.7
37
0
0.00
0.0
0
2017-02-04
38
25
31.5
-2.9
33
0
0.00
0.0
0
2017-02-05
63
27
45.0
10.4
20
0
0.00
0.0
0
2017-02-06
69
44
56.5
21.7
8
0
0.00
0.0
0
2017-02-07
68
40
54.0
19.0
11
0
0.00
0.0
0
2017-02-08
40
21
30.5
-4.7
34
0
0.00
0.0
0
2017-02-09
45
16
30.5
-5.0
34
0
0.00
0.0
0
2017-02-10
72
34
53.0
17.3
12
0
0.00
0.0
0
2017-02-11
82
53
67.5
31.5
0
3
0.00
0.0
0
2017-02-12
59
36
47.5
11.3
17
0
0.00
0.0
0
2017-02-13
56
29
42.5
6.0
22
0
0.11
0.0
0
2017-02-14
48
37
42.5
5.7
22
0
0.04
0.0
0
2017-02-15
51
30
40.5
3.4
24
0
0.00
0.0
0
2017-02-16
66
31
48.5
11.1
16
0
0.00
0.0
0
2017-02-17
72
40
56.0
18.3
9
0
0.00
0.0
0
2017-02-18
67
43
55.0
17.0
10
0
0.00
0.0
0
2017-02-19
75
42
58.5
20.2
6
0
0.00
0.0
0
2017-02-20
71
54
62.5
23.9
2
0
0.06
0.0
0
2017-02-21
64
48
56.0
17.1
9
0
0.08
0.0
0
2017-02-22
72
49
60.5
21.3
4
0
0.00
0.0
0
2017-02-23
84
53
68.5
28.9
0
4
0.00
0.0
0
2017-02-24
70
30
50.0
10.1
15
0
0.00
0.0
0
2017-02-25
44
21
32.5
-7.7
32
0
0.00
0.0
0
2017-02-26
45
25
35.0
-5.6
30
0
0.10
T
0
2017-02-27
66
34
50.0
9.1
15
0
T
0.0
0
2017-02-28
77
56
66.5
25.3
0
2
T
0.0
0
Sum
1692
991
-
-
479
9
0.39
T
-
Average
60.4
35.4
47.9
10.7
-
-
-
-
0.0
Normal
48.2
26.1
37.2
-
780
0
2.52
3.6
-
Observations for each day cover the 24 hours ending
at the time given below (Local Standard Time).
Max Temperature : midnight
Min Temperature : midnight
Precipitation : midnight
Snowfall : midnight
Snow Depth : 6am
Climatological Data for JOPLIN REGIONAL AIRPORT, MO - February 2017
Date
Max Temperature
Min Temperature
Avg Temperature
Avg Temperature Departure
HDD
CDD
Precipitation
2017-02-01
55
36
45.5
9.1
19
0
0.00
2017-02-02
36
25
30.5
-6.1
34
0
0.00
2017-02-03
36
20
28.0
-8.8
37
0
0.00
2017-02-04
45
24
34.5
-2.5
30
0
0.00
2017-02-05
62
31
46.5
9.3
18
0
0.00
2017-02-06
74
46
60.0
22.6
5
0
T
2017-02-07
68
41
54.5
16.8
10
0
0.00
2017-02-08
41
21
31.0
-6.9
34
0
0.00
2017-02-09
47
19
33.0
-5.2
32
0
0.00
2017-02-10
71
42
56.5
18.1
8
0
0.00
2017-02-11
82
54
68.0
29.3
0
3
0.00
2017-02-12
58
36
47.0
8.0
18
0
0.00
2017-02-13
58
37
47.5
8.3
17
0
0.11
2017-02-14
48
40
44.0
4.5
21
0
0.02
2017-02-15
52
30
41.0
1.2
24
0
0.00
2017-02-16
65
35
50.0
9.9
15
0
0.00
2017-02-17
71
46
58.5
18.1
6
0
0.00
2017-02-18
66
46
56.0
15.3
9
0
0.00
2017-02-19
78
42
60.0
19.0
5
0
0.00
2017-02-20
67
56
61.5
20.1
3
0
0.13
2017-02-21
71
47
59.0
17.3
6
0
0.00
2017-02-22
78
49
63.5
21.5
1
0
0.00
2017-02-23
83
54
68.5
26.2
0
4
0.00
2017-02-24
72
29
50.5
7.9
14
0
0.00
2017-02-25
45
21
33.0
-9.9
32
0
0.00
2017-02-26
44
31
37.5
-5.8
27
0
0.08
2017-02-27
69
31
50.0
6.4
15
0
0.00
2017-02-28
76
60
68.0
24.1
0
3
0.00
Sum
1718
1049
-
-
440
10
0.34
Average
61.4
37.5
49.4
9.6
-
-
-
Normal
50.5
29.2
39.8
-
705
1
2.32
Observations for each day cover the 24 hours ending
at the time given below (Local Standard Time).
Max Temperature : midnight
Min Temperature : midnight
Precipitation : midnight
Climatological Data for WEST PLAINS MUNI AP, MO - February 2017
Date
Max Temperature
Min Temperature
Avg Temperature
Avg Temperature Departure
HDD
CDD
Precipitation
2017-02-01
56
36
46.0
11.0
19
0
0.00
2017-02-02
37
30
33.5
-1.6
31
0
0.00
2017-02-03
41
20
30.5
-4.8
34
0
0.00
2017-02-04
36
20
28.0
-7.4
37
0
0.00
2017-02-05
62
29
45.5
9.9
19
0
0.00
2017-02-06
66
46
56.0
20.2
9
0
0.00
2017-02-07
76
48
62.0
26.1
3
0
0.00
2017-02-08
53
24
38.5
2.4
26
0
0.00
2017-02-09
42
18
30.0
-6.3
35
0
0.00
2017-02-10
69
29
49.0
12.5
16
0
0.00
2017-02-11
80
50
65.0
28.3
0
0
0.00
2017-02-12
63
36
49.5
12.5
15
0
0.00
2017-02-13
52
27
39.5
2.3
25
0
0.02
2017-02-14
46
38
42.0
4.6
23
0
0.47
2017-02-15
52
31
41.5
3.8
23
0
0.00
2017-02-16
64
29
46.5
8.6
18
0
0.00
2017-02-17
70
38
54.0
15.8
11
0
0.00
2017-02-18
61
47
54.0
15.5
11
0
0.12
2017-02-19
67
39
53.0
14.2
12
0
0.00
2017-02-20
75
55
65.0
25.9
0
0
1.31
2017-02-21
61
53
57.0
17.6
8
0
0.66
2017-02-22
68
53
60.5
20.8
4
0
0.00
2017-02-23
76
51
63.5
23.5
1
0
0.00
2017-02-24
63
34
48.5
8.2
16
0
0.00
2017-02-25
46
25
35.5
-5.2
29
0
0.00
2017-02-26
49
25
37.0
-4.0
28
0
T
2017-02-27
64
31
47.5
6.1
17
0
0.00
2017-02-28
77
54
65.5
23.8
0
1
0.01
Sum
1672
1016
-
-
470
1
2.59
Average
59.7
36.3
48.0
10.1
-
-
-
Normal
49.2
26.5
37.9
-
760
0
2.84
Observations for each day cover the 24 hours ending
at the time given below (Local Standard Time).
Max Temperature : midnight
Min Temperature : midnight
Precipitation : midnight
Climatological Data for VICHY ROLLA NATIONAL AP, MO - February 2017
Date
Max Temperature
Min Temperature
Avg Temperature
Avg Temperature Departure
HDD
CDD
Precipitation
2017-02-01
50
31
40.5
8.1
24
0
0.00
2017-02-02
36
21
28.5
-4.0
36
0
0.00
2017-02-03
35
18
26.5
-6.2
38
0
0.00
2017-02-04
37
19
28.0
-4.9
37
0
T
2017-02-05
59
29
44.0
10.9
21
0
0.00
2017-02-06
65
40
52.5
19.2
12
0
T
2017-02-07
65
36
50.5
17.0
14
0
T
2017-02-08
36
20
28.0
-5.8
37
0
T
2017-02-09
36
17
26.5
-7.5
38
0
0.00
2017-02-10
71
31
51.0
16.8
14
0
0.00
2017-02-11
77
49
63.0
28.5
2
0
0.00
2017-02-12
55
27
41.0
6.3
24
0
0.00
2017-02-13
52
23
37.5
2.5
27
0
0.00
2017-02-14
52
38
45.0
9.7
20
0
0.00
2017-02-15
48
26
37.0
1.4
28
0
0.00
2017-02-16
68
26
47.0
11.2
18
0
0.00
2017-02-17
73
42
57.5
21.4
7
0
0.00
2017-02-18
63
50
56.5
20.1
8
0
T
2017-02-19
76
41
58.5
21.7
6
0
0.00
2017-02-20
76
56
66.0
28.9
0
1
0.36
2017-02-21
62
51
56.5
19.1
8
0
0.09
2017-02-22
71
50
60.5
22.8
4
0
0.00
2017-02-23
72
51
61.5
23.5
3
0
T
2017-02-24
65
29
47.0
8.6
18
0
T
2017-02-25
41
23
32.0
-6.7
33
0
0.00
2017-02-26
45
23
34.0
-5.1
31
0
0.01
2017-02-27
65
29
47.0
7.6
18
0
T
2017-02-28
76
54
65.0
25.3
0
0
T
Sum
1627
950
-
-
526
1
0.46
Average
58.1
33.9
46.0
10.3
-
-
-
Normal
45.8
25.5
35.7
-
822
0
1.93
Observations for each day cover the 24 hours ending
at the time given below (Local Standard Time).


 Weather Story
 Weather Map
 Local Radar
 Follow us on YouTube