Critical Fire Weather Conditions Continue Across the Plains
Locally critical fire weather conditions continue for portions of the Northern/Central Plains and much of northern lower Michigan Monday evening. Red Flag Warnings are currently in effect. Dry conditions and gusty winds will persist across southern Colorado Tuesday.
Read More >
In the early morning hours of December 3rd, 1978, much of the Four State Region was affected by severe weather as a cold front moved through the area. Tornadoes affected parts of Bossier, Webster, Claiborne, and Union Parishes in Louisiana, as well as Columbia and Union Counties in Arkansas. The most destructive of these tornadoes, rated an F4 on the Fujita Scale, cut an 8 mile long path across Bossier City and resulted in 266 injuries and 2 fatalities.
One of the worst tornadoes in Northwest Louisiana history, this web page was developed to commemorate the event and help remember those affected by this devastating storm.
The information contained in the first few tabs below can also be downloaded in PDF format in the "Downloads" tab.
Track Overview
Meteorological Discussion
Then vs. Today
Photos
Downloads
The Bossier City tornado was spawned from a supercell thunderstorm which developed in Deep East Texas ahead of a squall line. No tornadoes were reported with the supercell as it moved from Deadwood, Texas and across Southwood High School, Pierremont Mall, and the VA Hospital in Shreveport. However, wind equipment at the National Weather Service, located at the Greater Shreveport Municipal Airport (as it was known at the time), recorded a 52 mile per hour wind gust during the passage of the supercell.
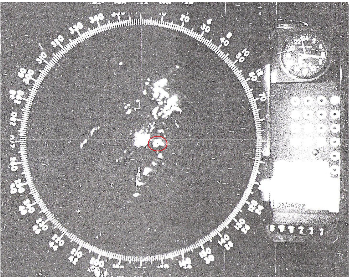
National Weather Service-Longview, TX, radar image at 12:58am CST. The red circle highlights the supercell thunderstorm which would eventually produce the Bossier City tornado.
The tornado initially developed in the Central Park area of Bossier City, almost directly across the Red River from the VA Hospital around 1:50 AM. The tornado crossed Interstate 20, just west of the Barksdale Boulevard interchange. It continued moving northeastward, affecting businesses and residences along Benton Road and Airline Drive, before briefly moving into the more sparsely populated area east of Airline Drive and north of US-80.
From there, the storm moved into the Meadowview region of Bossier City. Parts of Meadowview Elementary School were destroyed, as wind speeds around 260 mile per hour carried several 700 pound I-beam structures several hundred feet before being firmly planted into the ground. Two fatalities occurred in a home on La Don Drive, when the tornado thrust an automobile into a bedroom where two sisters were sleeping.
The National Guard Armory was then destroyed. Moving across Interstate 220 near the Shed Road Interchange, the tornado destroyed the Northwest Louisiana State School prior to affecting homes in the Stockwell Place and Carriage Oaks region of Bossier City. The tornado lifted just north of this region, near Red Chute Bayou.
In addition to the Bossier City tornado, other tornadoes were spawned by this long-track supercell thunderstorm. A sleeping woman, in a mobile home, was killed as an F2 tornado destroyed homes and outbuildings near El Dorado, Arkansas. The same supercell also produced a tornado that briefly touched down 3 miles southwest of Tunica, Mississippi, located near Memphis.
Following the event, renowned tornado scientist, Theodore Fujita, with colleagues Robert Abbey and James McDonald arrived in Shreveport to examine the damage. Working with Official-in-Charge Ernest Ethridge of the National Weather Service, an extensive areal and ground damage survey was completed. The resulting damage path was mapped with great precision, a rather cutting-edge idea at the time. Over $100 million in damage resulted from the F4 tornado, but miraculously, only two lives were lost.
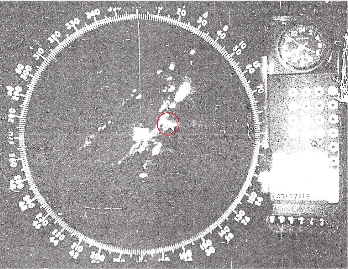
National Weather Service-Longview, TX, radar image at 1:581m CST. The red circle highlights the supercell thunderstorm. A tornado is on the ground at this time in Bossier City.
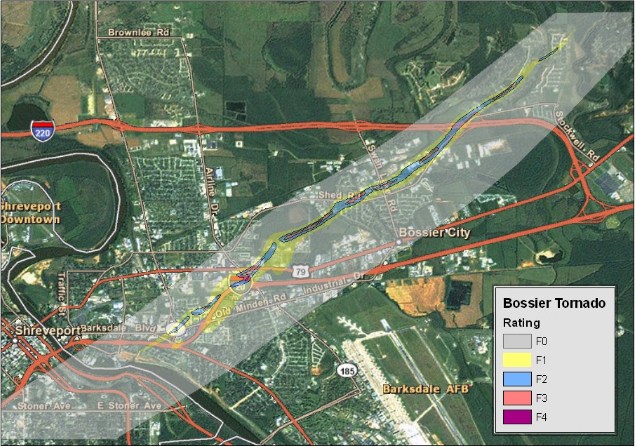
Overview of the Bossier City tornado track. Colors indicate the tornado's intensity. (Modified from Fujita, 1979.)
The weather maps depicting the weather conditions present at midnight on December 3, 1978 will be discussed and shown in this section. These charts will display just a few of the fields meteorologists examine when forecasting your weather. The charts shown here will also display the standard deviation of each field with warm and cool colors. By examining the standard deviation, you can see how “rare” or “common” the height pattern, wind speeds, or temperatures were when compared to “normal” for early December.
Background
A cold front moved through Northwest Louisiana on Monday, November 27. By Friday, December 1, a positively-tilted trough was present in the upper atmosphere from the High Plains to the Desert Southwest. This allowed Gulf moisture to return to the lower part of the atmosphere Friday night, in response to surface low pressure developing over the Texas Panhandle. Considering the placement of the upper atmospheric trough, the associated cold front moved very little from Thursday through Saturday. It remained stretched from the surface low into the Ohio River Valley.
Upper Atmosphere Charts
250mb
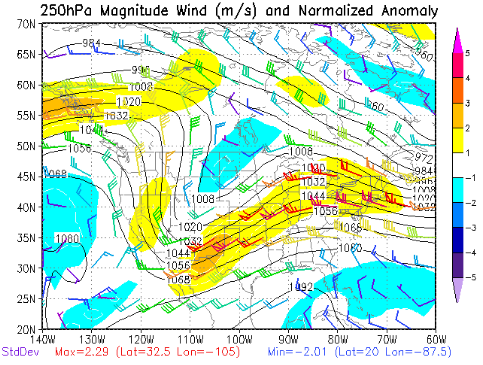
250mb chart for midnight on December 3, 1978. Heights, wind barbs, and the standard deviation of wind speeds are shown.
A deep, positively tilted trough axis stretches from western North Dakota to Baja California. However, the 250mb chart is useful in displaying the location and position of the jet stream. This chart shows a strong jet stream, with wind speeds of 120 to 130 knots, extending from southern New Mexico into the Ohio River Valley. Some diffluence is evident near the Interstate 30 corridor as the core of the jet starts to move northeast. Effectively, our region was moving into the right entrance region of the jet stream. This area of the jet is known for enhancing atmospheric lift and favoring the development of thunderstorms.
500mb
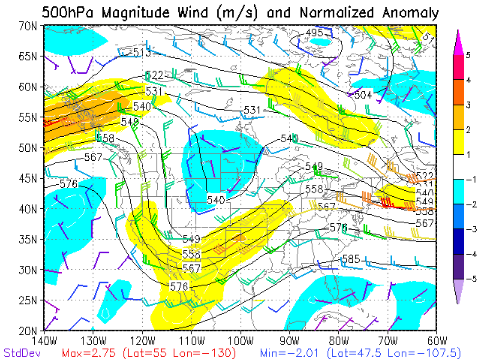
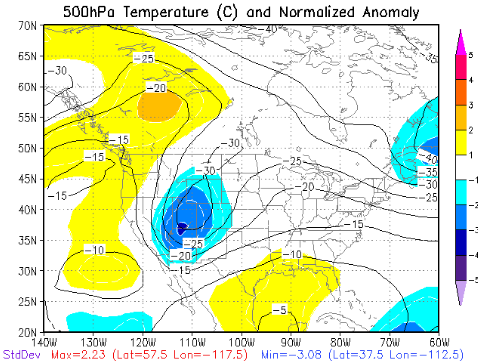
The deep trough is again noted on the 500mb chart. Wind speeds are unusually strong at this level as well, with speeds near 90 knots and standard deviations of almost 3 across Central Oklahoma. These charts, though, are rather useful in depicting the location and movement of “shortwave troughs,” more commonly known as “upper-level disturbances.” One such disturbance is seen in the temperature field as a subtle trough from Central Kansas toward the Interstate 30 corridor. This disturbance passed through the region during the overnight hours, providing yet another source of atmospheric lift for thunderstorm development. Incidentally, standard deviations between 3 and 4 were noted near the base of the trough, providing another indication of the strength of this storm system.
500mb chart for midnight on December 3, 1978. Heights, wind barbs, and the standard deviation of wind speeds are shown.
500mb chart for midnight on December 3, 1978. Isotherms and the standard deviation of temperatures are shown.
850mb
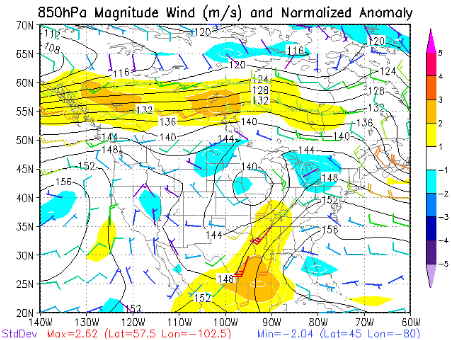
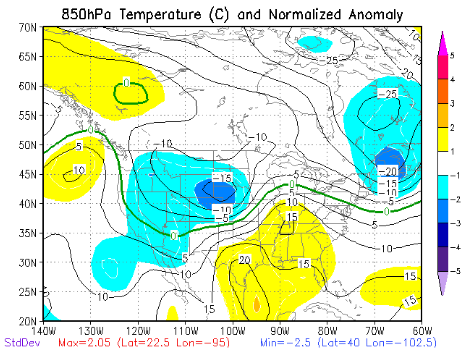
Evidence of a warm and moist airmass, brought into the region by a strong (50 knot) low-level jet, is presented in the 850mb charts. Temperatures at this level (approximately 5000 feet) averaged between 15° and 20° Celsius, or 59° and 68° Fahrenheit, which are up to 2 standard deviations above normal. Warm temperatures at this height, especially in early December, are not usually a good sign. Why? With warmer temperatures, you have a greater possibility of being “capped.” The cap, known by meteorologists as an inversion, allows instability to increase in the lower part of the atmosphere. The instability is then realized when a lifting mechanism, such as a front or “upper-level disturbance” combines with a developing thunderstorm to “break the cap.” This can result in seemingly explosive thunderstorm development in a short period of time.
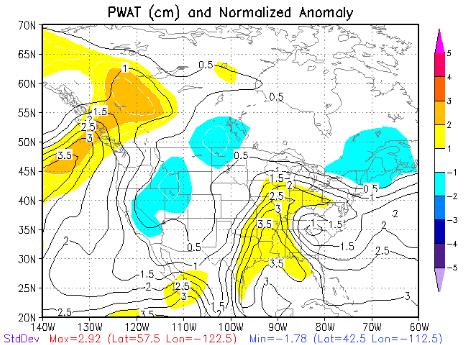
Another indication of the amount of moisture present in the lower part of the atmosphere is shown in the precipitable water chart. Values at midnight were in excess of 3.5 centimeters, or 1.4 inches, over much of the Four State Region. In fact, drier air did not start filtering into the region until after noon on December 3.
850mb chart for midnight on December 3, 1978. Heights, wind barbs, and the standard deviation of wind speeds are shown.
850mb chart for midnight on December 3, 1978. Isotherms and the standard deviation of temperature are shown.
Precipitable water chart for midnight on December 3, 1978. Contours of precipitable water and their standard deviation are shown.
Surface Map
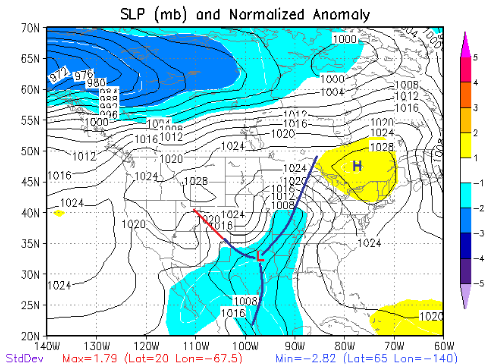
Surface weather map for midnight on December 3, 1978. Isobars and the standard deviation of pressure are shown.
A rough overview of the midnight surface map is presented here. The front stretched across North Texas, then northeastward across Southeast Oklahoma, and into Central Missouri. It is a rather strong front for early December, with surface pressure values between 1 and 2 standard deviations lower than what would normally be anticipated. The front extended along the Interstate 30 corridor by 6 am on December 3, and finally moved of the Shreveport/Bossier City area by noon.
A closer look at surface observations (not shown) indicates the presence of an area of low pressure over Northeast Texas. The presence of this surface low likely increased the amount of low-level wind shear available for thunderstorms. If the amount of low-level wind shear is high enough, tornadoes may be possible.
Sounding Analysis
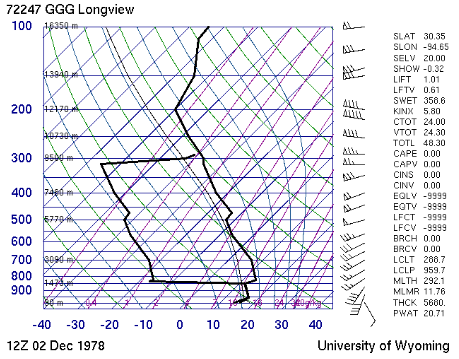
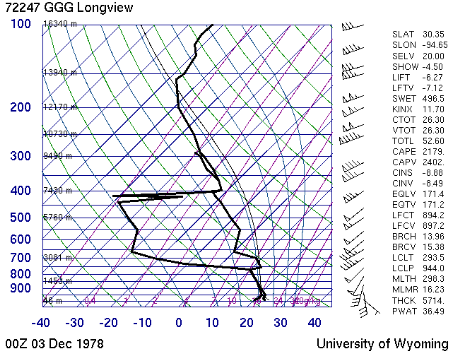
These data are derived from weather balloons, which are launched twice daily from meteorological offices around the world. Of the two thick lines on the image, the line on the right is the temperature. The line on the left is the dewpoint. In the late 1970s, weather balloons were not launched at the National Weather Service in Shreveport. Instead, they were launched an office in Longview, Texas.
The 6 am sounding from December 2 shows a very moist airmass in place over the lowest 5000 feet. Near the top of this layer, around 850mb, a subsidence inversion (or “cap”) is present, with a large amount of dry air in place above the cap. The presence of the cap all but prohibits large-scale convective development while allowing instability to increase. Depth of the low-level moist layer increased through December 2, and was noticeably deeper by 6 pm. By 6 pm, the atmosphere across the Four State Region was very unstable for early December. The lifted index was -6.2°, with a CAPE (or Convective Available Potential Energy) of 2179 J/kg.
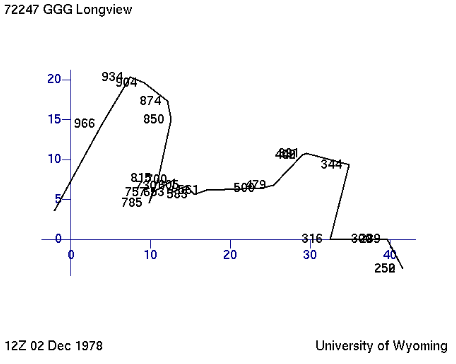
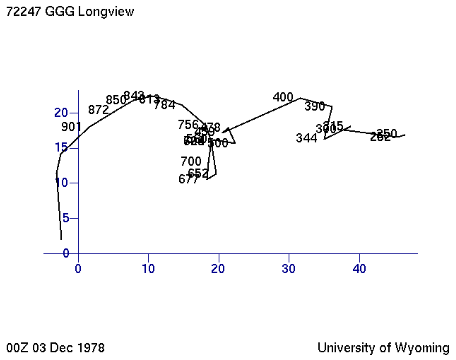
An examination of the 6 am and 6 pm soundings shows the height of the cap increased from 850mb at 6 am to almost 750mb at 6 pm. This was probably due to mechanical lifting of the air parcel in advance of the approaching shortwave trough. Wind speeds and low-level wind shear also increased throughout the day on December 2, as seen on both the soundings and associated hodographs. An estimate of the surface to 6 kilometer wind shear at 6 pm on December 2 shows an approximate magnitude of 40 knots. Studies have shown values such as these are sufficient to obtain the thunderstorm rotation which could lead to tornado development.
Upper atmospheric sounding taken at Longview, TX, at 6am on December 2, 1978.
Hodograph from the upper atmospheric sounding taken at Longview, TX, at 6am on December 2, 1978.
Upper atmospheric sounding taken at Longview, TX, at 6pm on December 2, 1978.
Hodograph from the upper atmospheric sounding taken at Longview, TX, at 6pm on December 2, 1978.
Pierre Bossier Mall, the Louisiana Boardwalk, and several casinos have become part of the Bossier City landscape since the 1978 tornado. Residential development has also occurred north of Interstate 220 as the city expands northward. Because of this, we wished to examine what would happen if the 1978 Bossier City tornado occurred in 2008.
How?
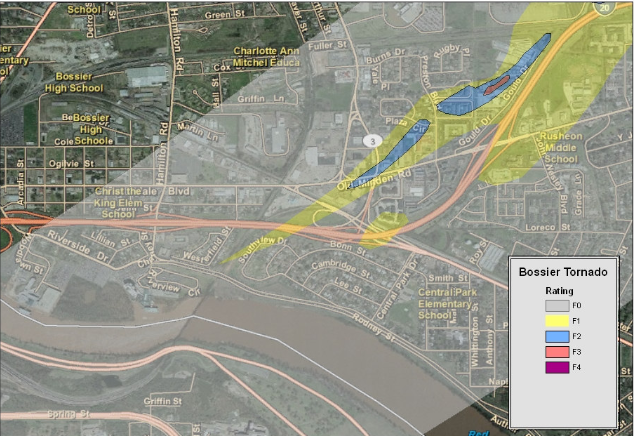
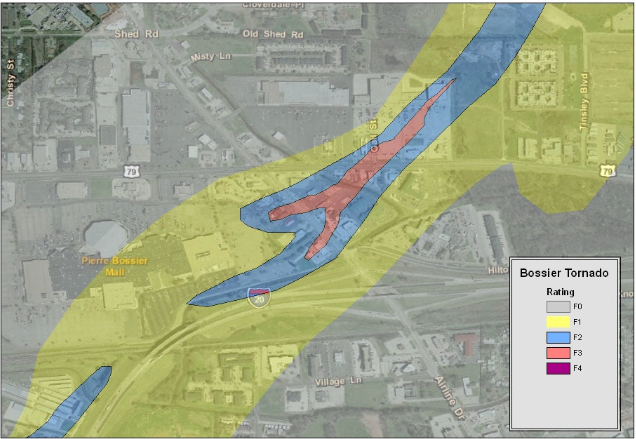
In order to accomplish this, a reanalysis of Dr. Fujita’s track map was completed using GIS software. The initial track was modified slightly based upon modern aerial photography and damage reports listed in local newspapers. The resulting track maps are shown in the series of images below.
Data from the 2000 census were overlaid once track maps were completed. Based upon this information, it is estimated that approximately 21,000 people could be affected by the tornado if it happened today. An estimated 5,000 people could be impacted by wind speeds greater than 73 miles per hour, which is the lower threshold for an F1 tornado.
Overview of Bossier City tornado track. Colors indicate the tornado's intensity. (Modified from Fujita, 1979.)
Touchdown Location: Portion of the Bossier City tornado track showing the approximate touchdown location. Colors indicate the tornado's intensity. (Modified from Fujita, 1979.)
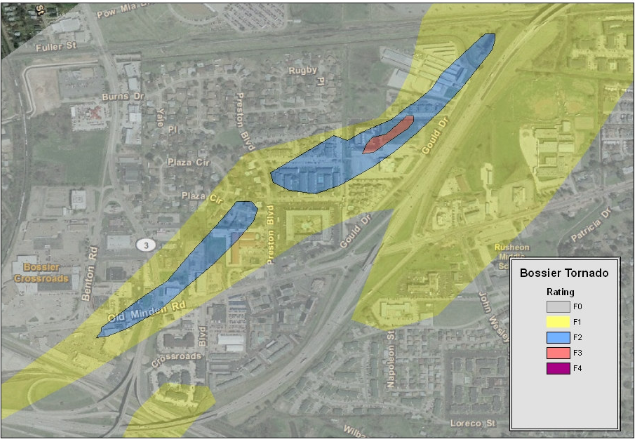
Benton Road Area: Portion of the Bossier City tornado track showing damage in and around Benton Road. Colors indicate the tornado's intensity. (Modified from Fujita, 1979.)
Airline Drive Area: Portion of the Bossier City tornado track showing damage in and around Airline Drive. Colors indicate the tornado's intensity. (Modified from Fujita, 1979.)
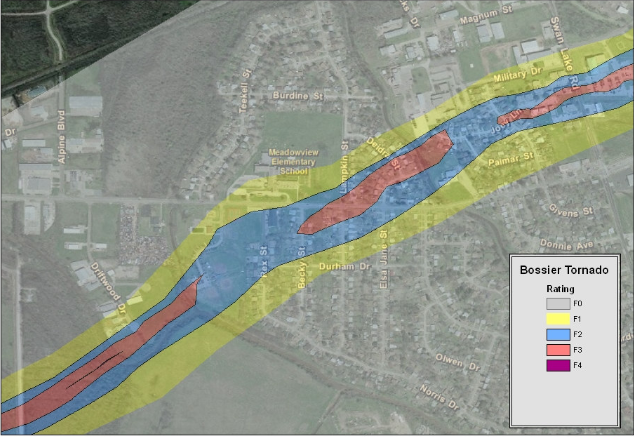
Meadowview Area: Portion of the Bossier City tornado track showing damage in and around Meadowview Elementary School. Colors indicate the tornado's intensity. (Modified from Fujita, 1979.)
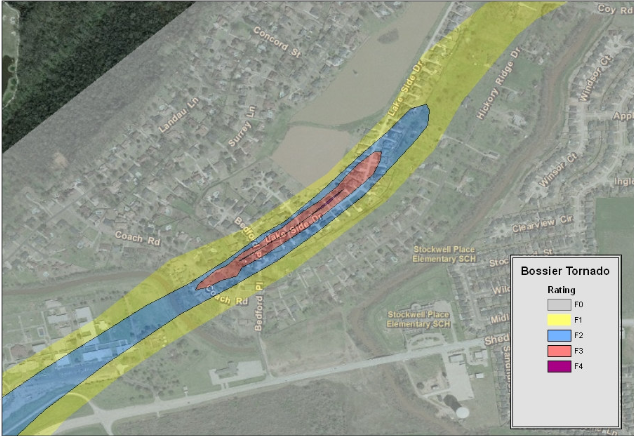
Stockwell Place Area: Portion of the Bossier City tornado track showing damage north of Interstate 220. Colors indicate the tornado's intensity. (Modified from Fujita, 1979.)
Impacts
If the storm occurred today, there is the potential to see greater structural damage than in 1978. Newer structures, such as Pierre Bossier Mall, would likely suffer significant damage. Diamond Jacks Casino would probably see some damage as well, given its proximity to the initial touchdown location.
Many of the same structures which were damaged in 1978 would again receive damage as the tornado moves toward the northeast. The Heart of Bossier shopping center and other developments in the Benton Road and Old Minden Road corridors would likely experience major damage. Businesses along Airline Drive, between Interstate 20 and US-80 (Texas Avenue) would probably be completely destroyed by at least F3 strength winds. This would include such present-day businesses as Starbucks, Pizza Hut, Burger King, and the Howard Johnson motel. Newer developments along US-80, such as Chili’s, Sonic, and Albertson's would also see a significant amount of damage.
An increased amount of residential development has been seen since 1978 in northeastern parts of Bossier City, in and around Red Chute, Stockwell Place, and Carriage Oaks. Because of this, there is a potential to see an increased amount of structural damage as the tornado crossed Interstate 220. Increased fatalities might also result.
There has been much speculation as to why the loss of life was not greater. The time of the tornado’s occurrence clearly played a role. Just before 2 am, shopping centers and most restaurants were closed. Schools were not in session. Traffic along Interstate 20 and other major roadways was relatively light. If this storm had occurred during afternoon on a weekday, the number of fatalities would likely be much higher. In fact, according to former Official-in-Charge Ernest Ethridge, if the tornado moved through Bossier City a just a week earlier, there could have been a greater loss of life. Why? There was racing at the Louisiana Downs racetrack and area motels were almost filled to capacity.
Many more businesses, such as casinos and fast food restaurants are open 24 hours in 2008 than in 1978. There would also likely be an increased amount of traffic on area roadways in our faster-paced society. These two factors suggest the possibility that a violent tornado moving along the same path today has the potential to inflict a greater loss of life and structural damage than in 1978.
Violent tornadoes are rare and comprise less than 3 percent of all tornadoes annually. Events such as this one serve as a reminder that severe weather, including tornadoes, can and does occur any time of year across the Four State Region. Even with advanced technology providing more precise forecasts and warnings, you are urged to prepare in advance by having a safety plan when severe weather threatens your area. Consider purchasing a NOAA Weather Radio All-Hazards to keep you informed of conditions favorable for severe weather any time of year.
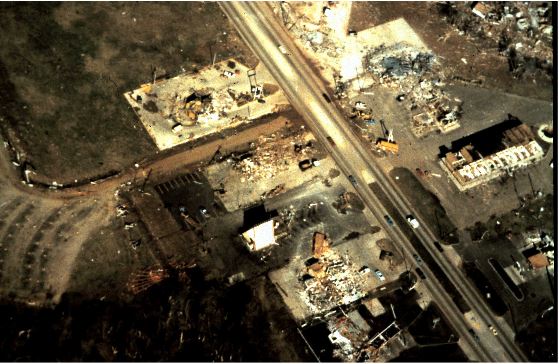
Airline Drive area. The pointed roof of the Whataburger is left untouched. Structures on both sides were smashed by estimated upper F3 to lower F4 winds. Starbucks in now in the approximate location of Whataburger. Photo is courtesy of Ernest Ethridge.
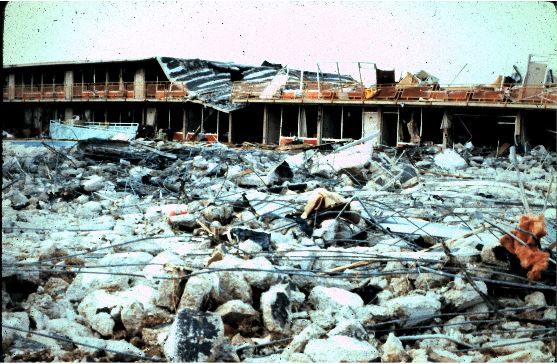
Destruction at the Best Western Bossier Inn. This motel is the present-day Holiday Inn. Photo is courtesy of Ernest Ethridge.
Destruction at the Best Western Bossier Inn. View from the ground. Photo is courtesy of Ernest Ethridge.
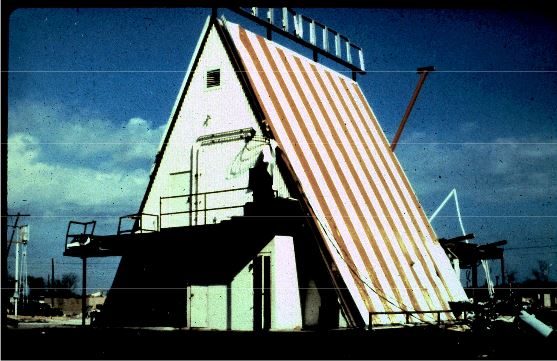
The Whataburger was practically left untouched. Survey indicated that it was located between two suction vortices. Photo is courtesy of Ernest Ethridge.
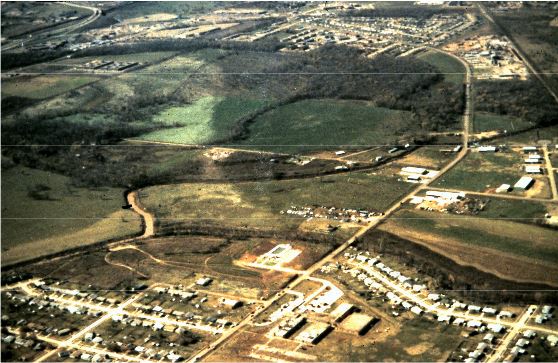
The curved path of the tornado can be seen in their view looking toward Airline Drive from Meadowview Elementary. Photo is courtesy of Ernest Ethridge
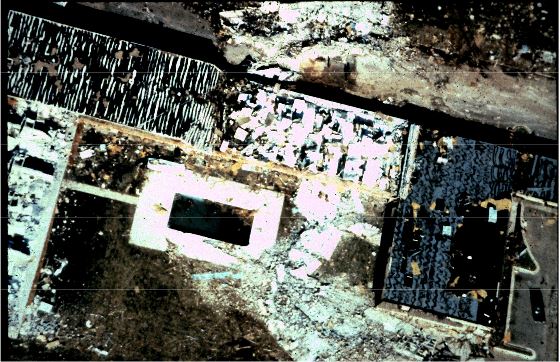
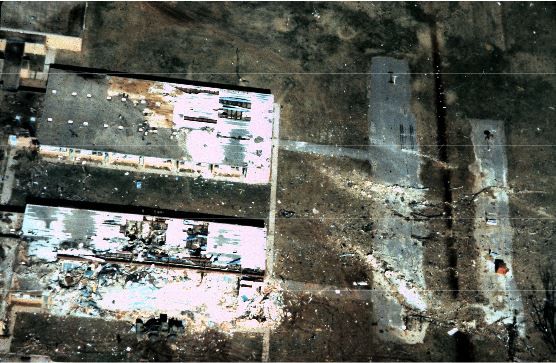
The south wing of Meadowview Elementary School. Photo is courtesy of Ernest Ethridge
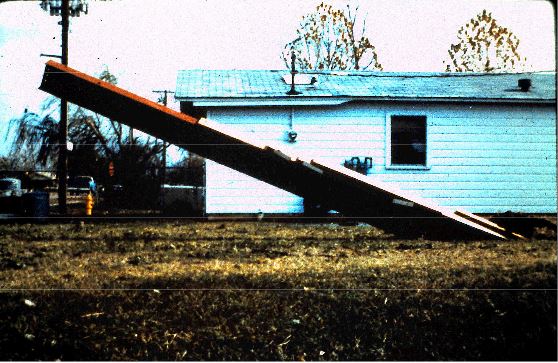
One of several 700-pound I-beams stuck deep into the ground by the tornado. Photo is courtesy of Ernest Ethridge.
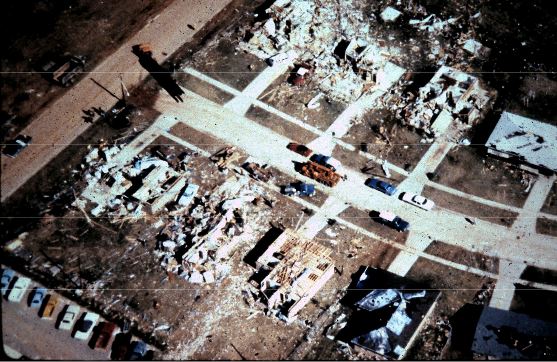
Two girls sleeping in beds in the upper left house were killed by a car which fell onto them. Photo is courtesy of Ernest Ethridge.
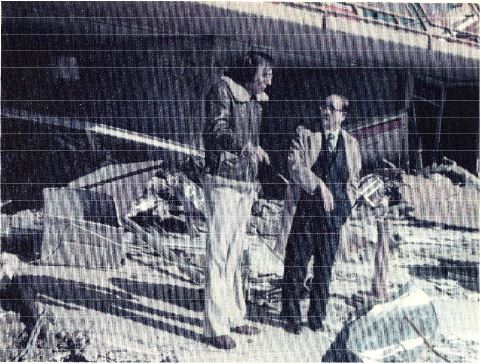
Former Official-in-Charge Ernest Ethridge (left) surveying tornado damage with Dr. Ted Fujita (right). Photo is courtesy of Ernest Ethridge.
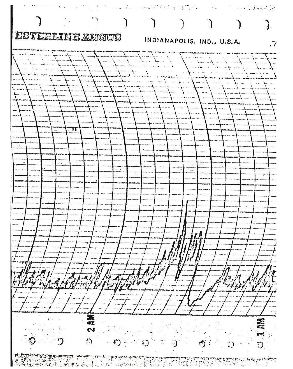
Record of the wind speed as the tornado-producing supercell passed over observing equipment at the National Weather Service in Shreveport. The peak wind speed indicated is between 45 and 50 mph. Courtesy of Ernest Ethridge.
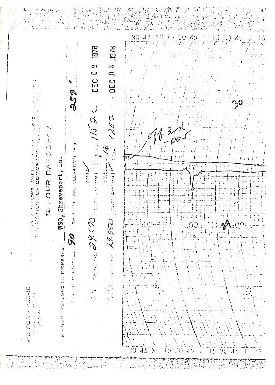
A trace of the atmospheric pressure as the tornado-producing supercell passed over observing equipment at the National Weather in Shreveport. Not the rapid drop in pressure as indicated by the dip in the trace. Courtesy of Ernest Ethridge.
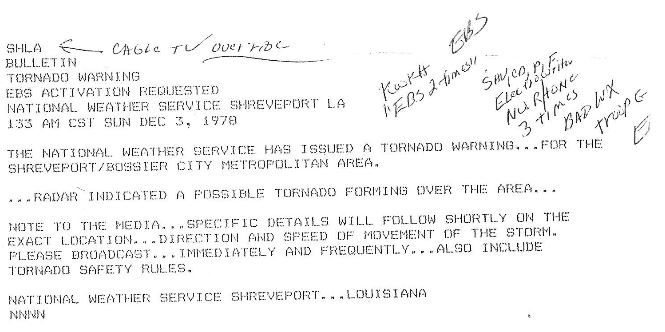
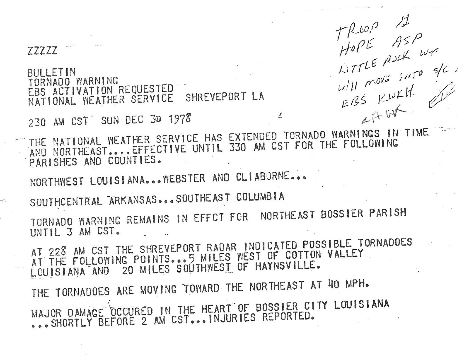
The initial tornado warning issued for the Bossier City tornado at 1:33am. This warning was issued approximately 17 minutes prior to the tornado's touchdown. A tornado warning issued prior to receiving a report of a tornado touchdown was an unusual occurrence prior to the use of Doppler radar. Courtesy of Ernest Ethridge.
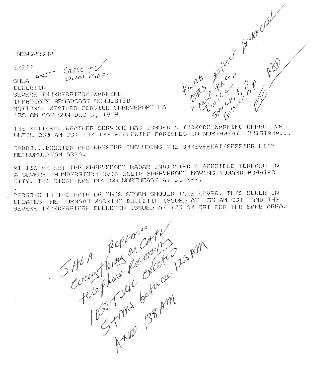
This tornado warning for the Bossier City tornado was issued at 1:38am to provide detailed information on the location and movement of the storm. Even if the first warning was not heard or received, this warning provided 12 minutes of advance notice prior to touchdown. Courtesy of Ernest Ethridge.
Tornado warnings continued to be issued by the National Weather Service in Shreveport as the supercell thunderstorm moved northeast. Courtesy of Ernest Ethridge.
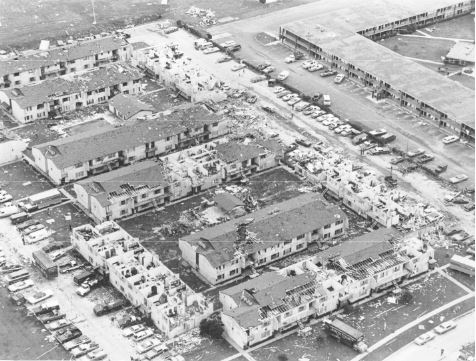
Damage to the Port au Prince Apartments in Bossier City. Courtesy of LSUS Archives--Noel Memorial Library.
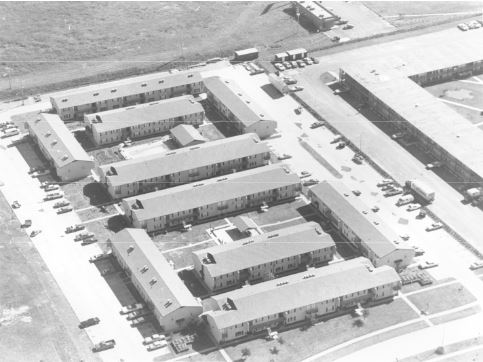
Port au Prince Apartments in Bossier City almost one year after the Bossier City tornado. Courtesy of LSUS Archives--Noel Memorial Library.
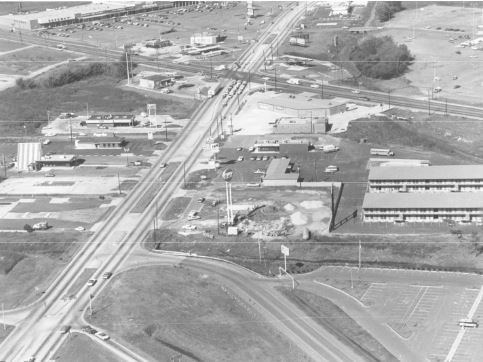
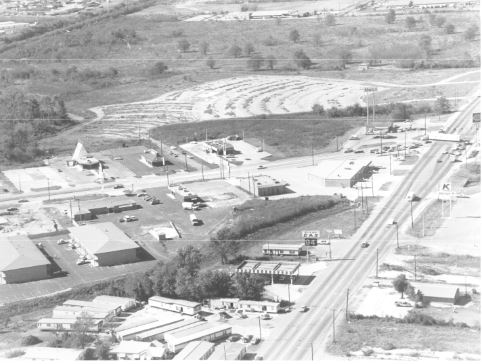
Looking north on Airline Dirve almost one year after the Bossier City tornado. The location of the Pizza Hut has not changed and is seen on the left adjacent to the Whataburger. Courtesy of LSUS Archives--Noel Memorial Library.
Looking west along US-80 (Texas Street) almost one year after the Bossier City tornado. Land behind Whataburger, Pizza Hut, and Wendy's is the location of Pierre Bossier Mall. Courtesy of LSUS Archives--Noel Memorial Library.
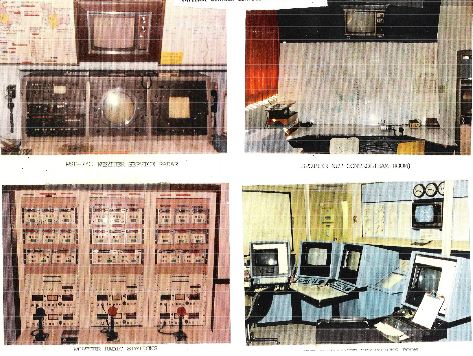
A glimpse at equipment used at the National Weather Service in Shreveport during the time of the Bossier City tornado. Clockwise from the upper left, WSR-74C radar, HAM radio operating area, AFOS computer equipment in the operations area, and NOAA Weather Radio broadcast equipment. Courtesy of Ernest Ehtridge.
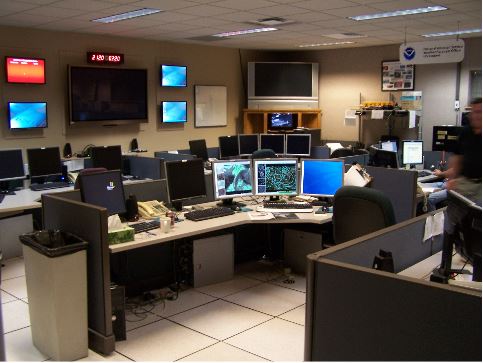
A glimpse at equipment currently used at the National Weather Service in Shreveport. In the foreground is the computer workstation called AWIPS, which allows National Weather Service meteorologists to compose forecasts and warnings.


 Follow us on YouTube