Catastrophic Hurricane Michael Strikes Florida Panhandle
October 10, 2018
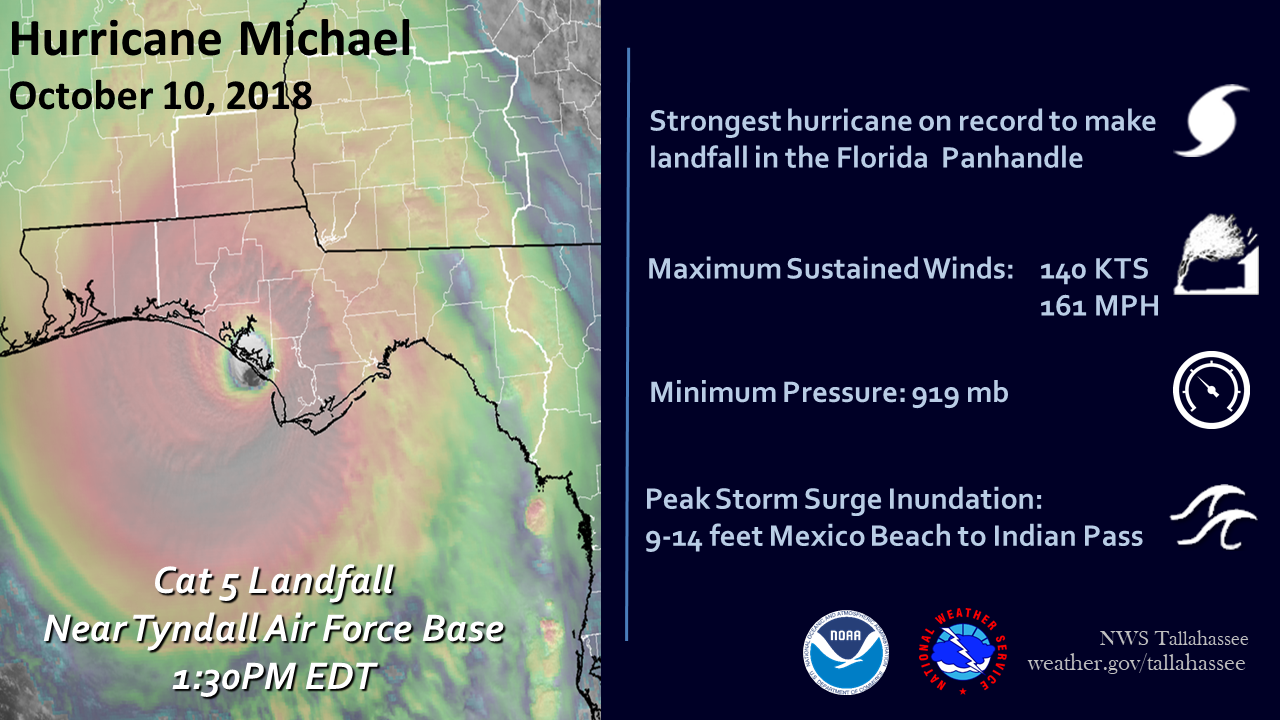
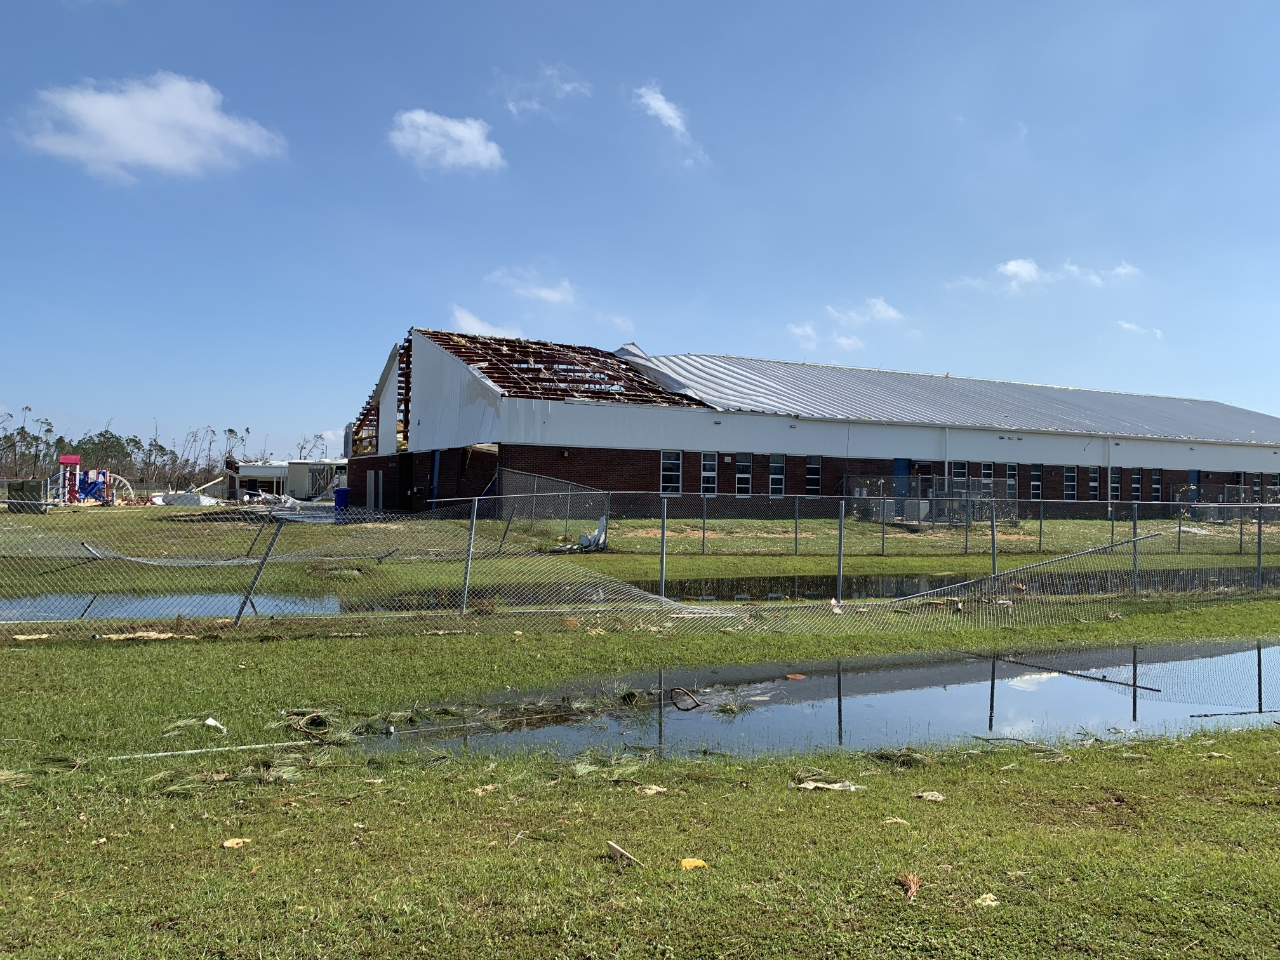
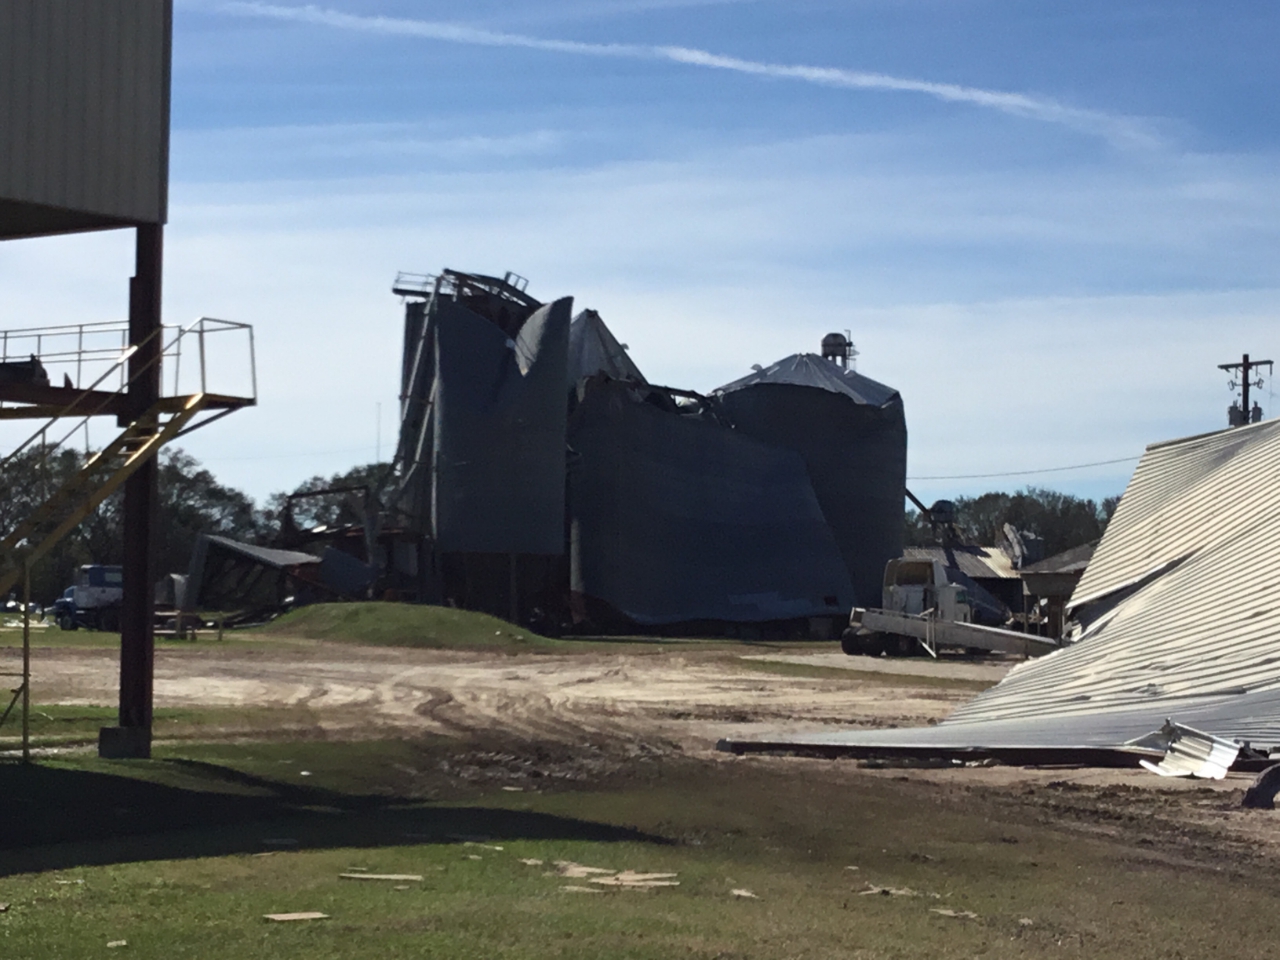
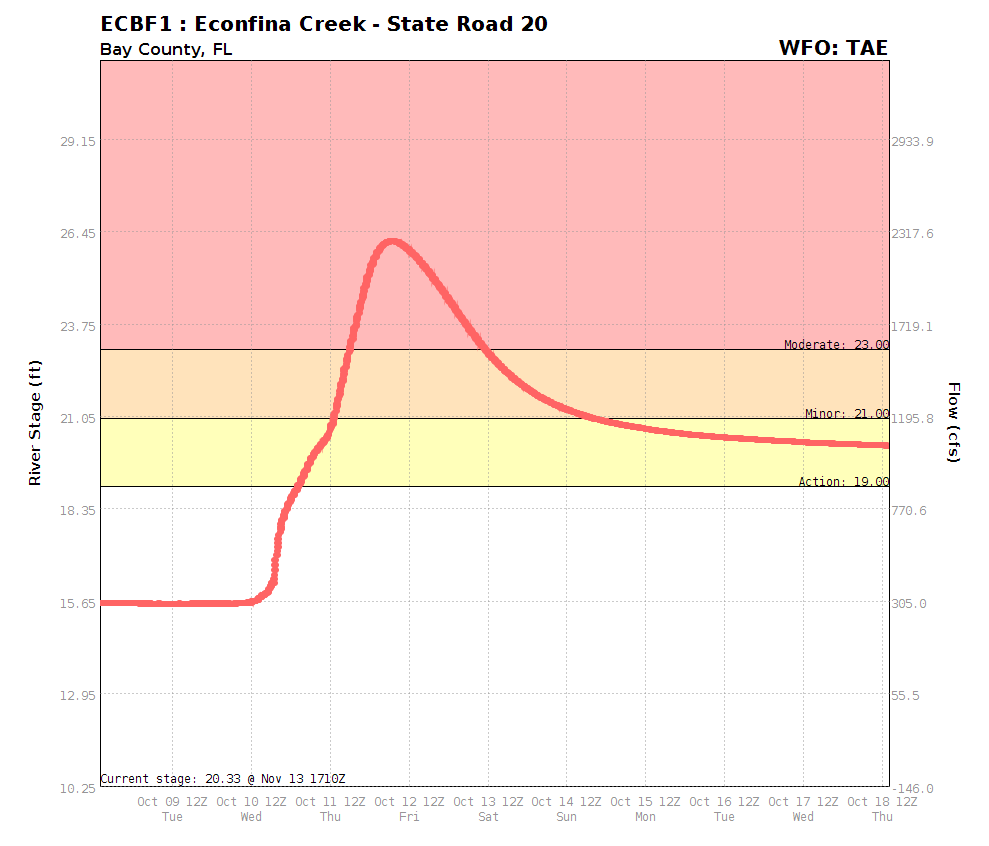
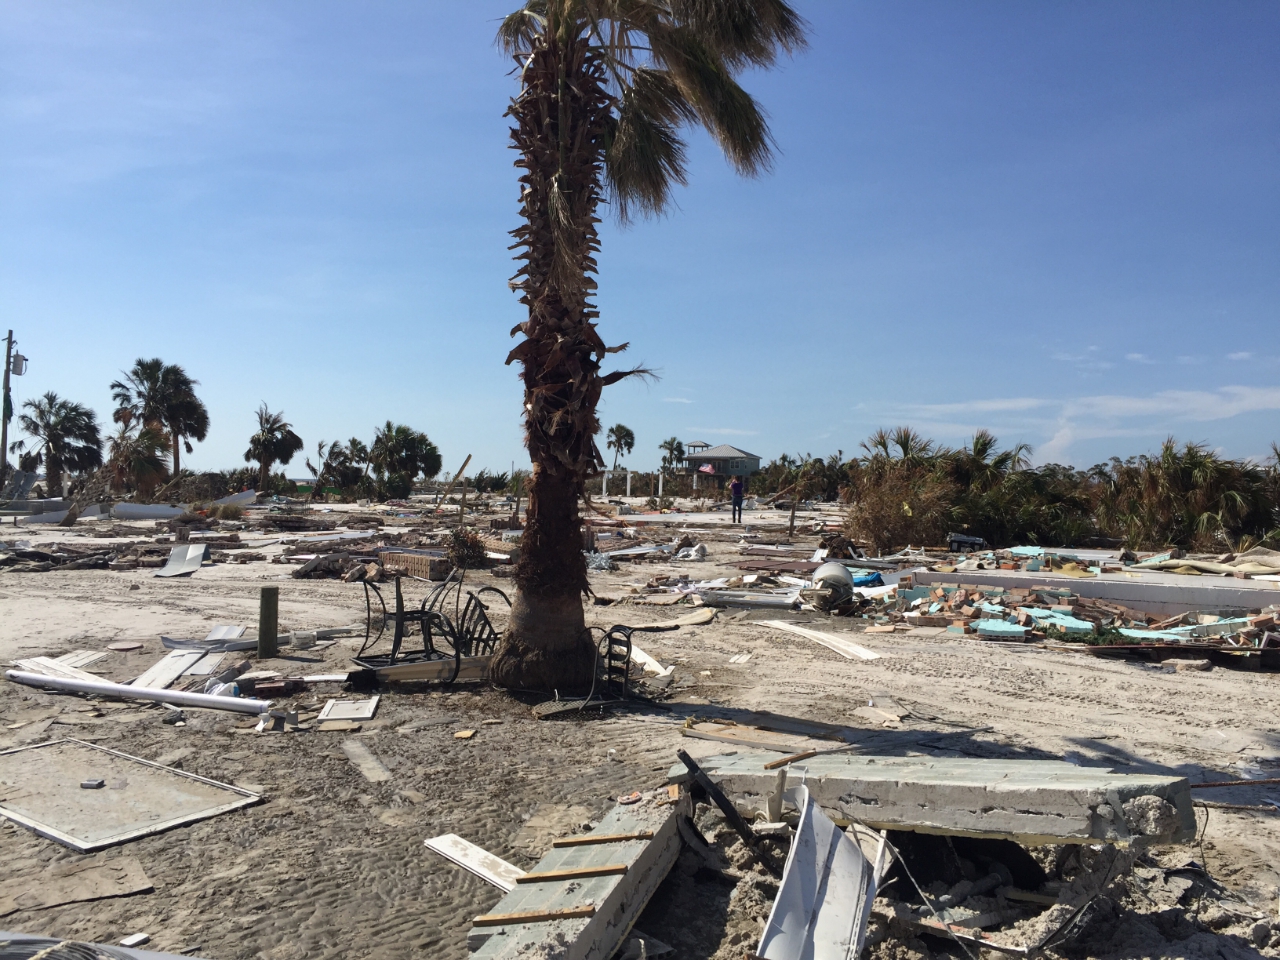
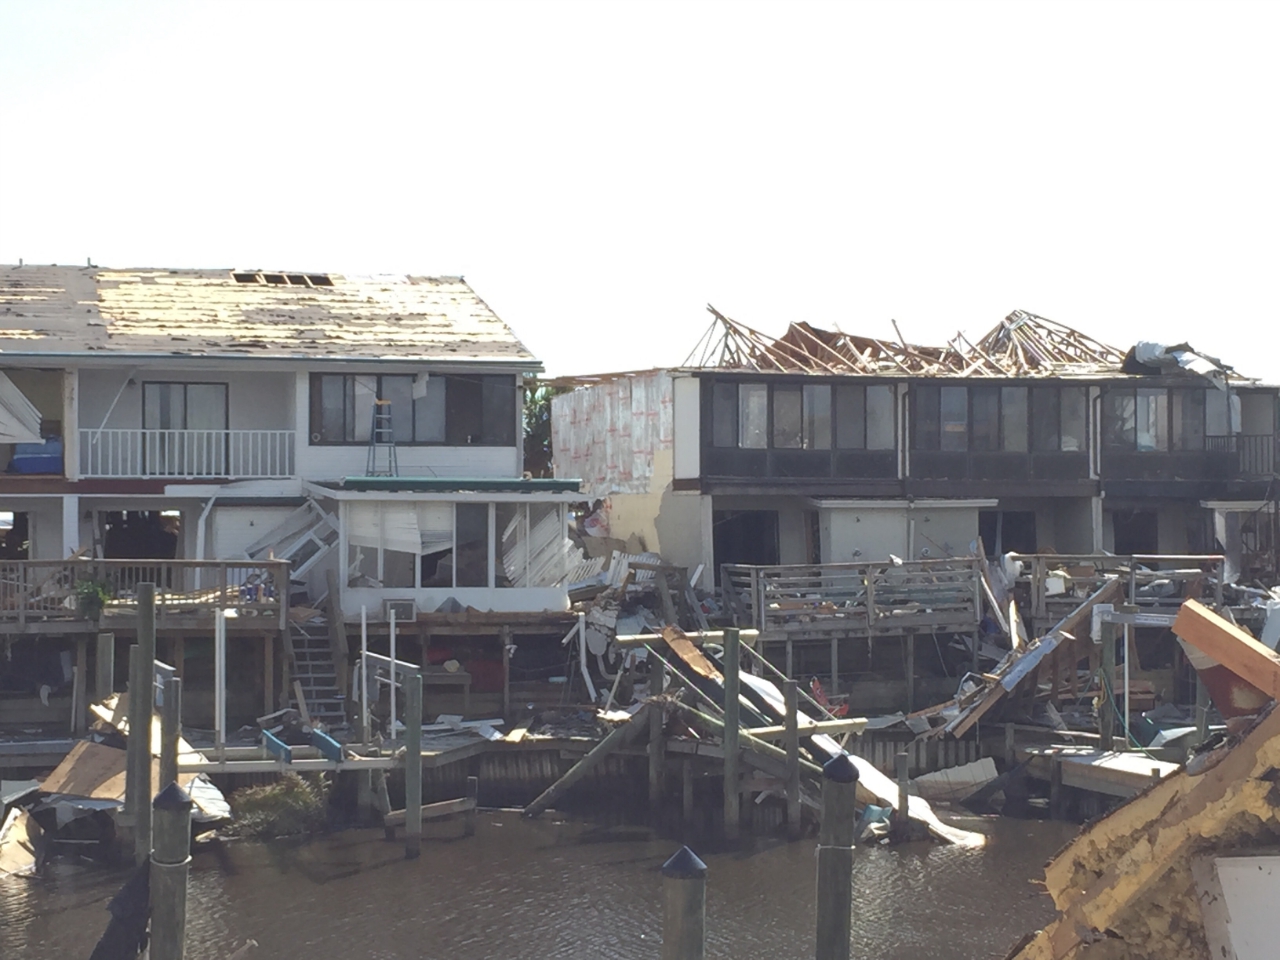
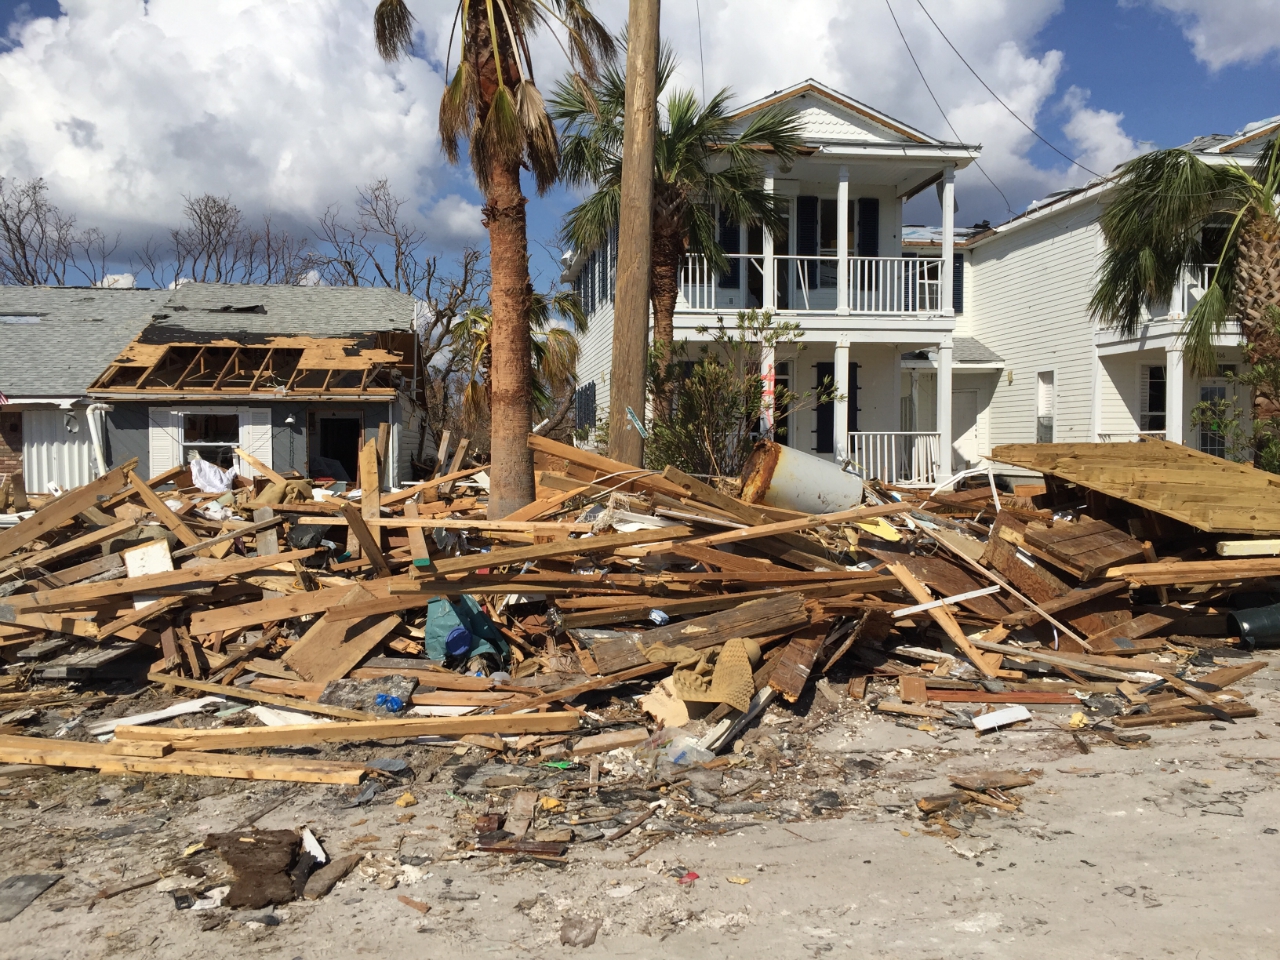
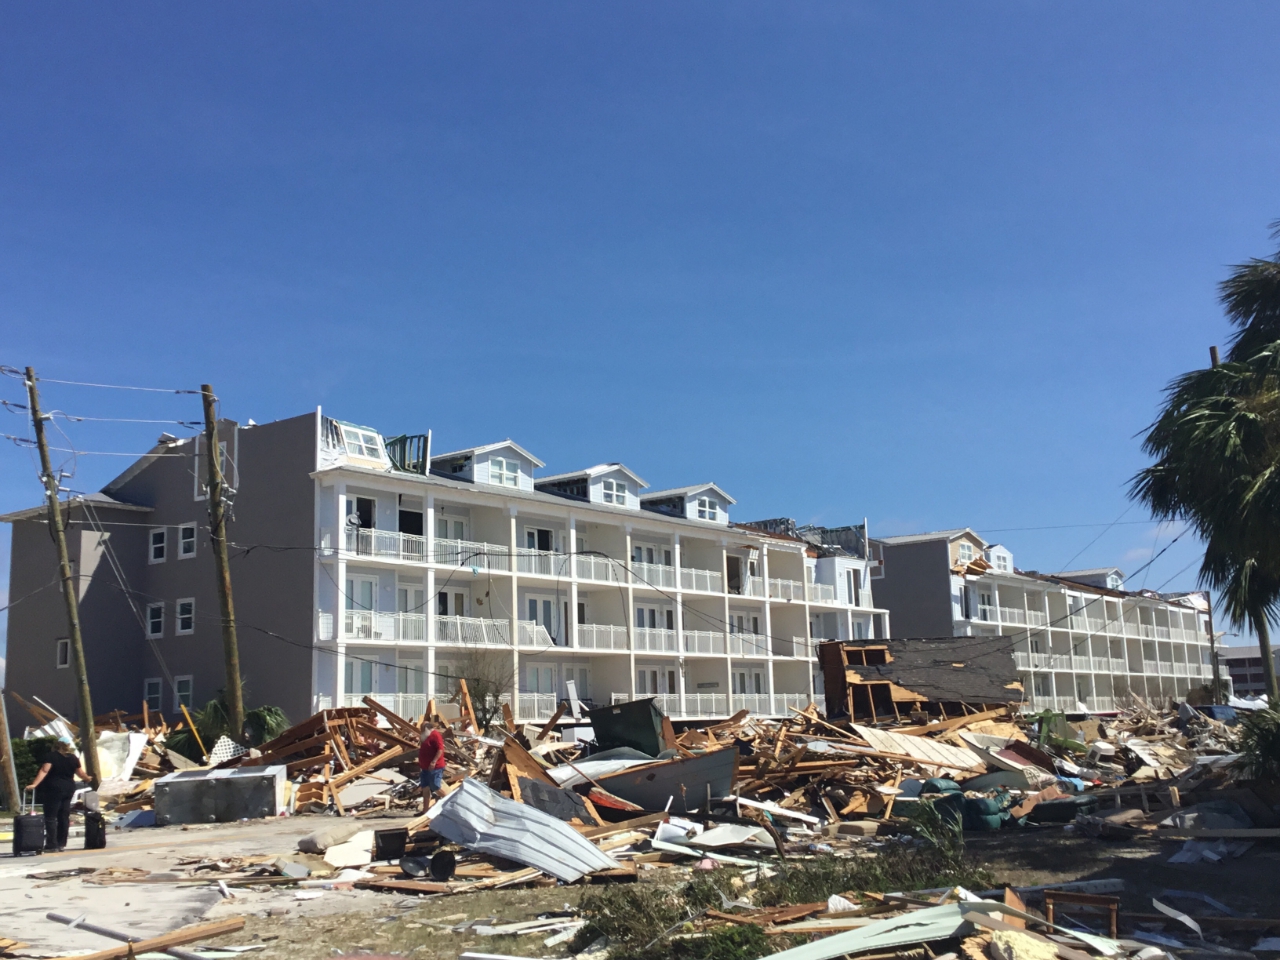
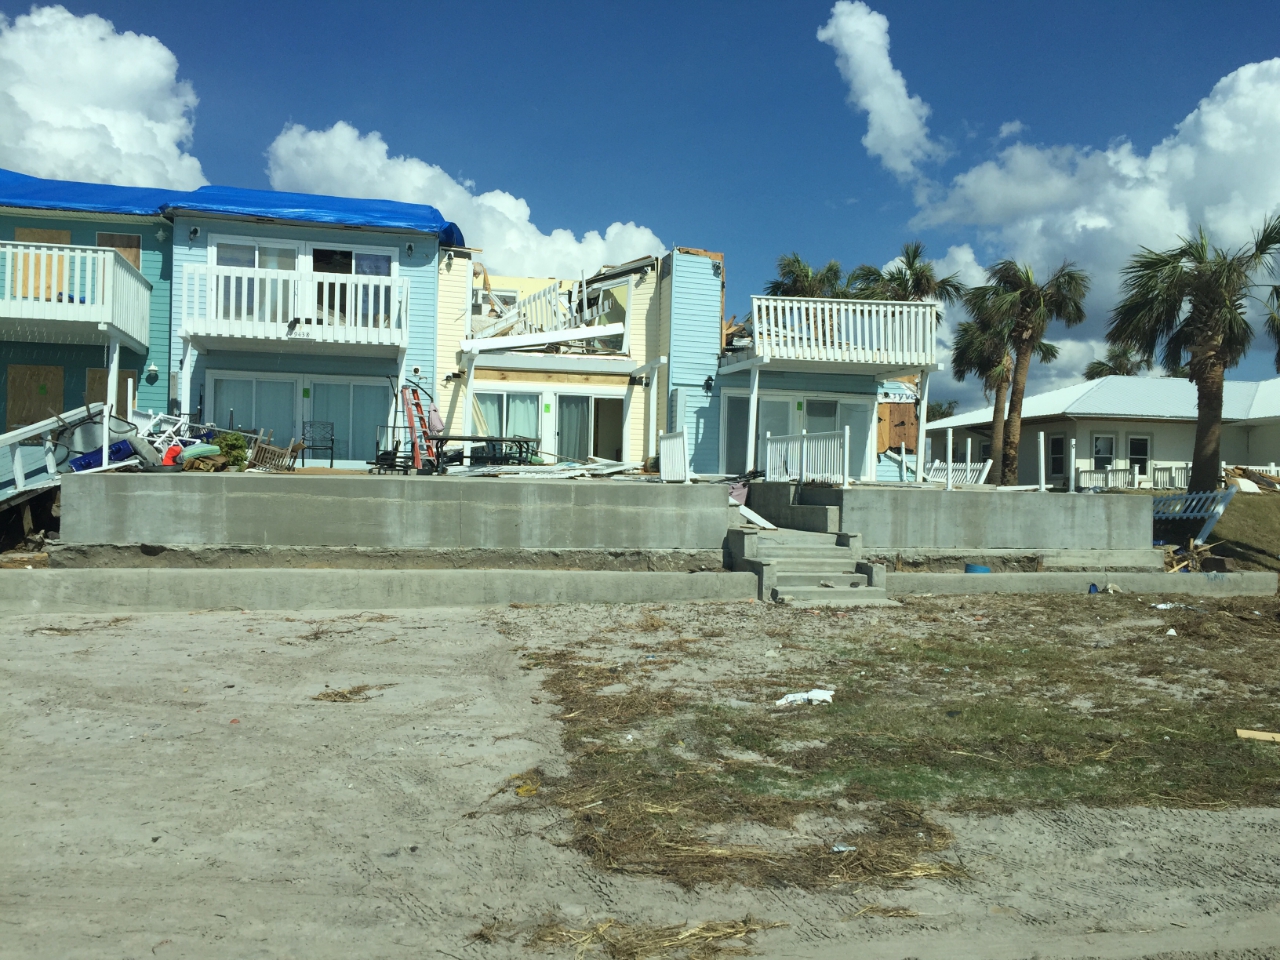
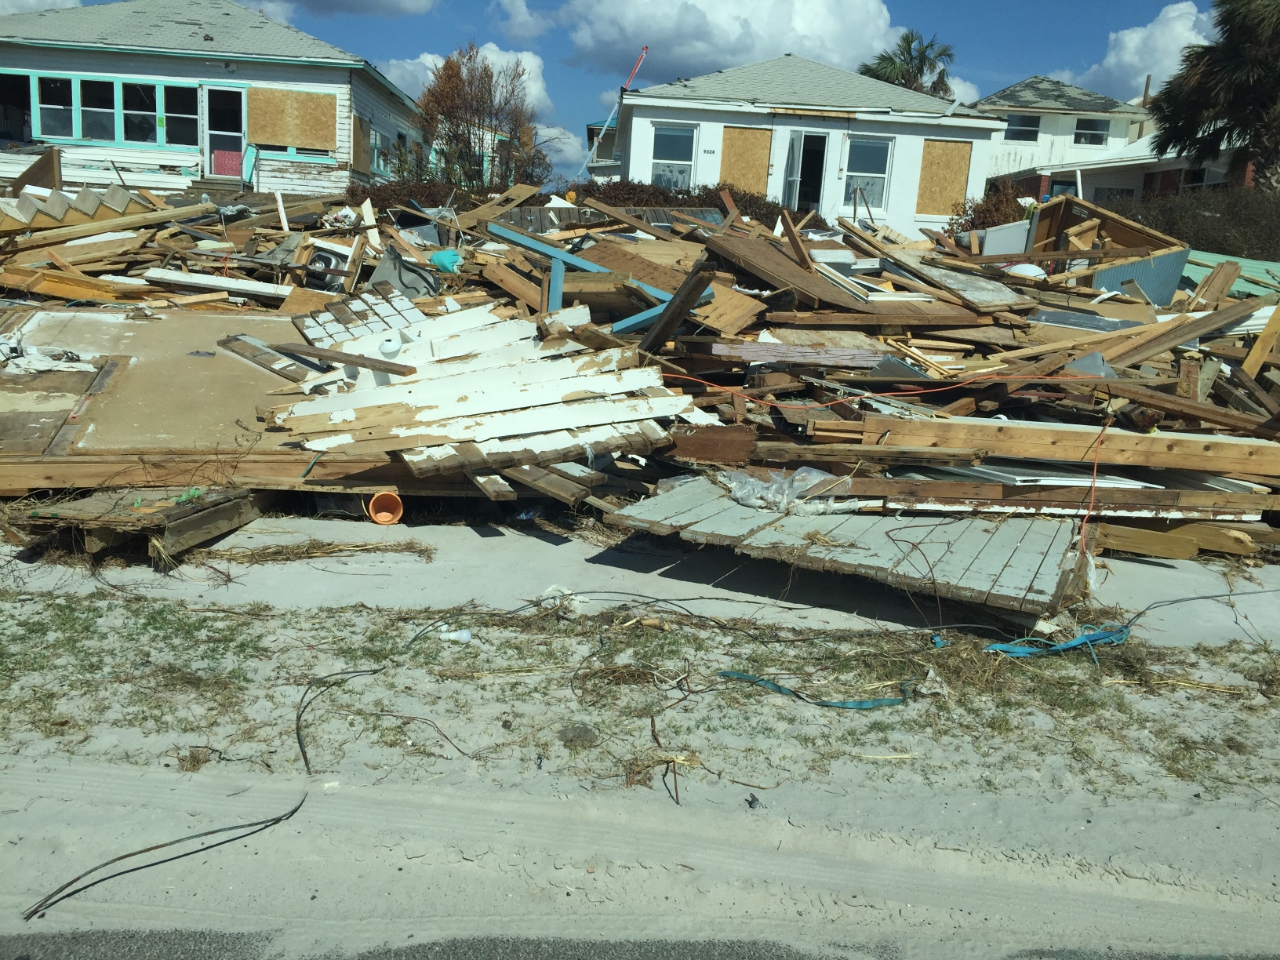
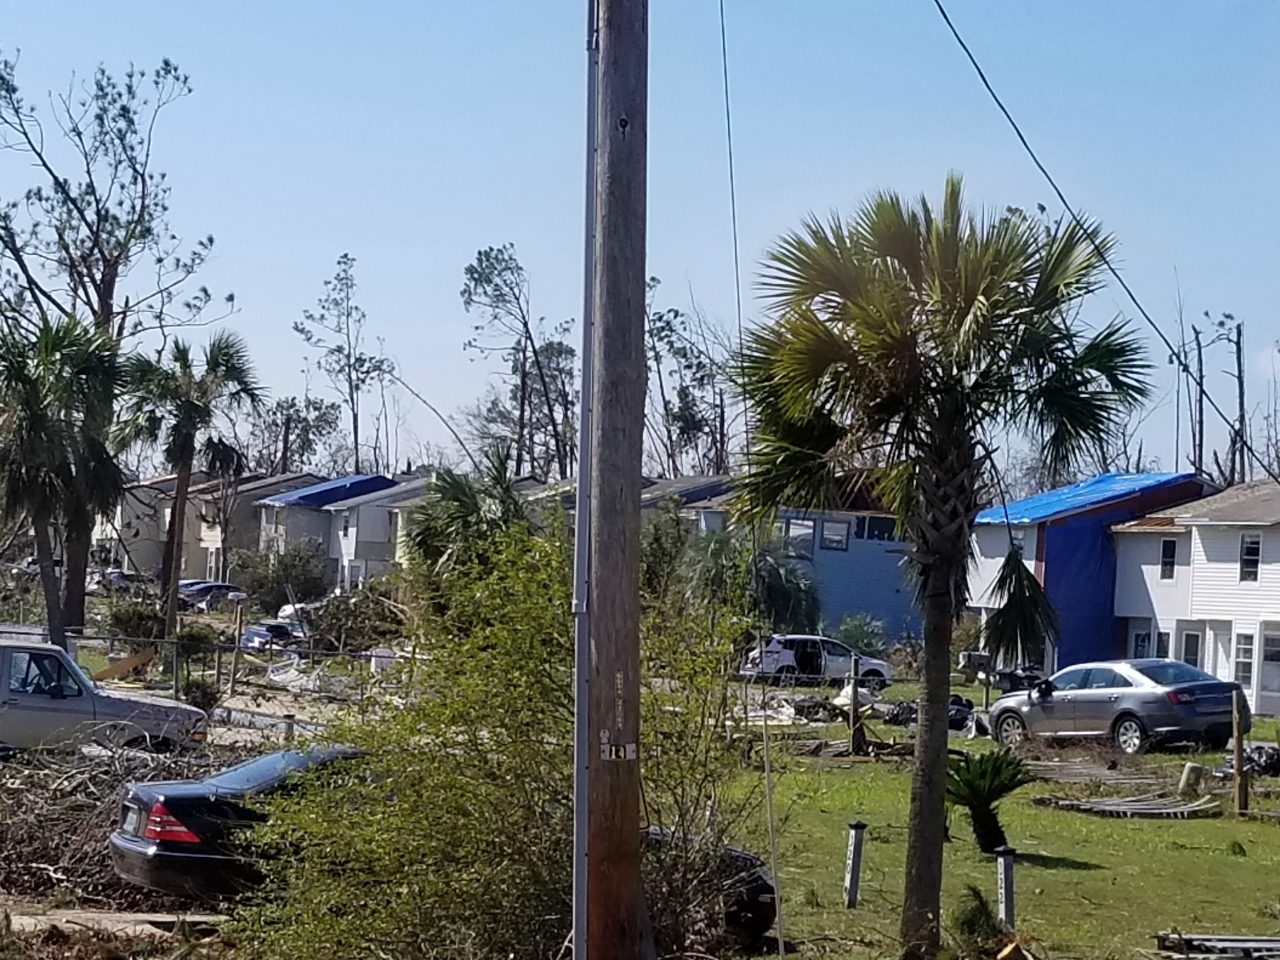
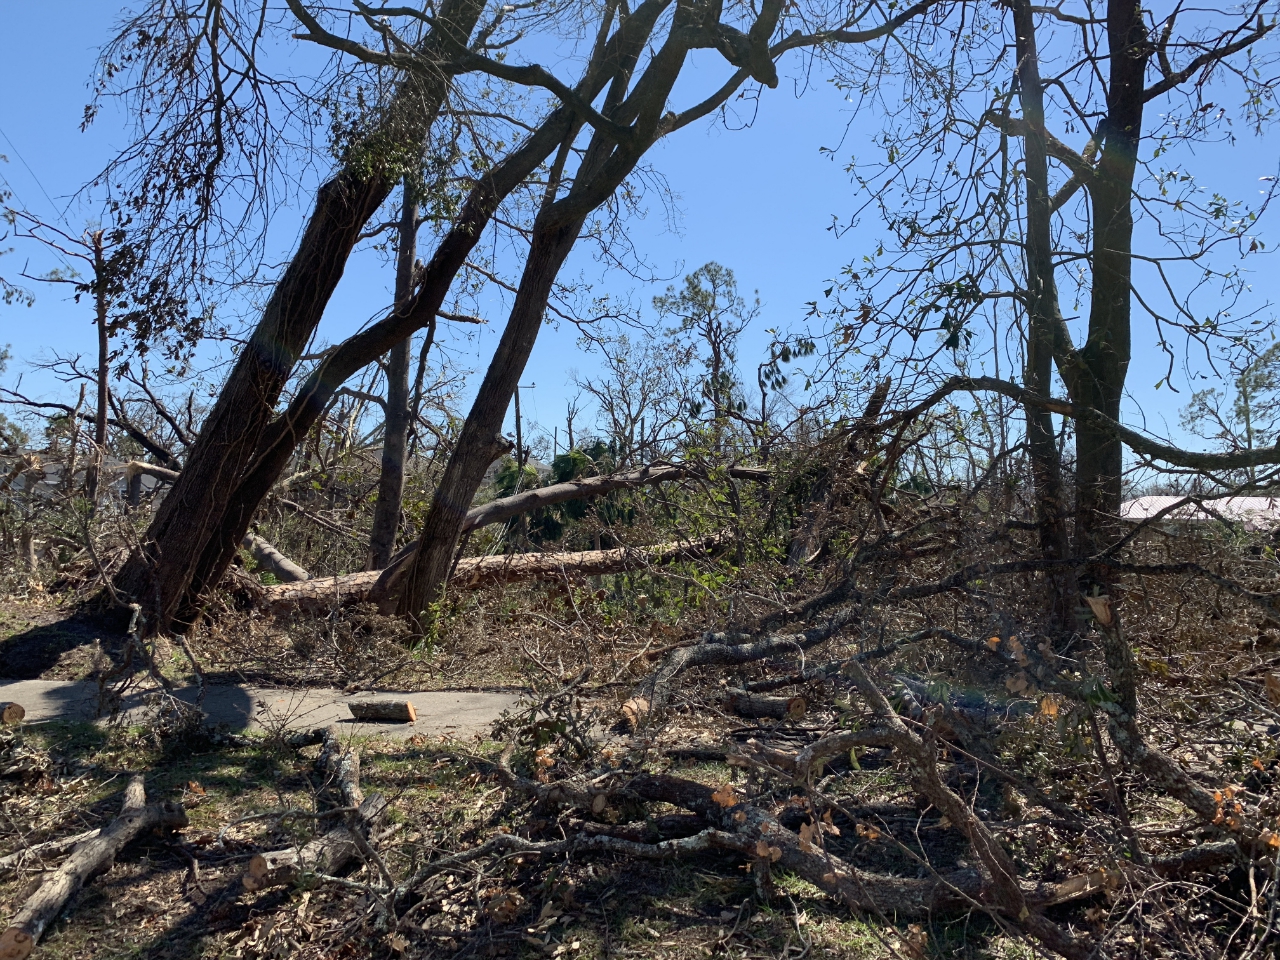
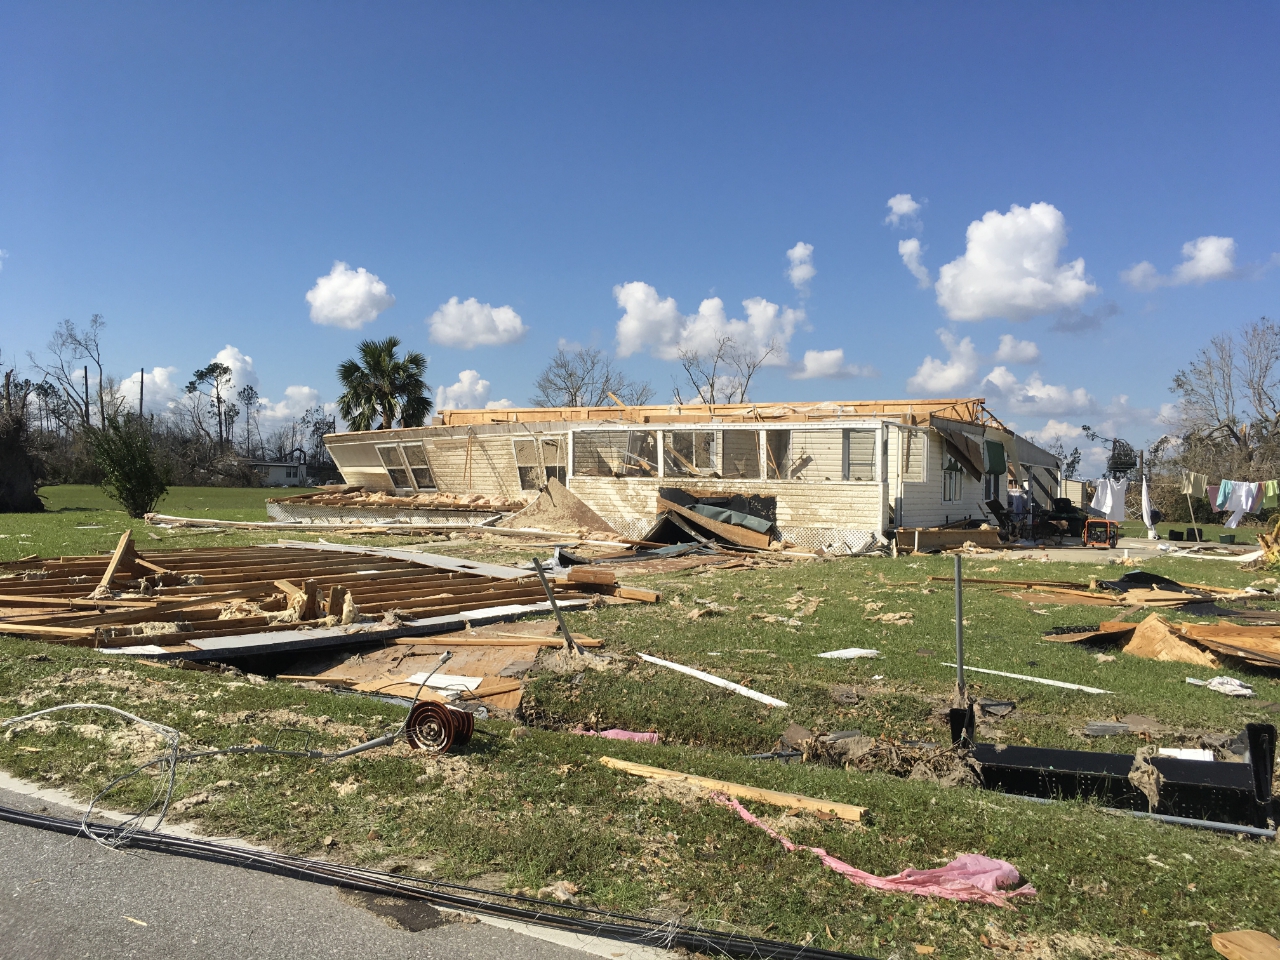
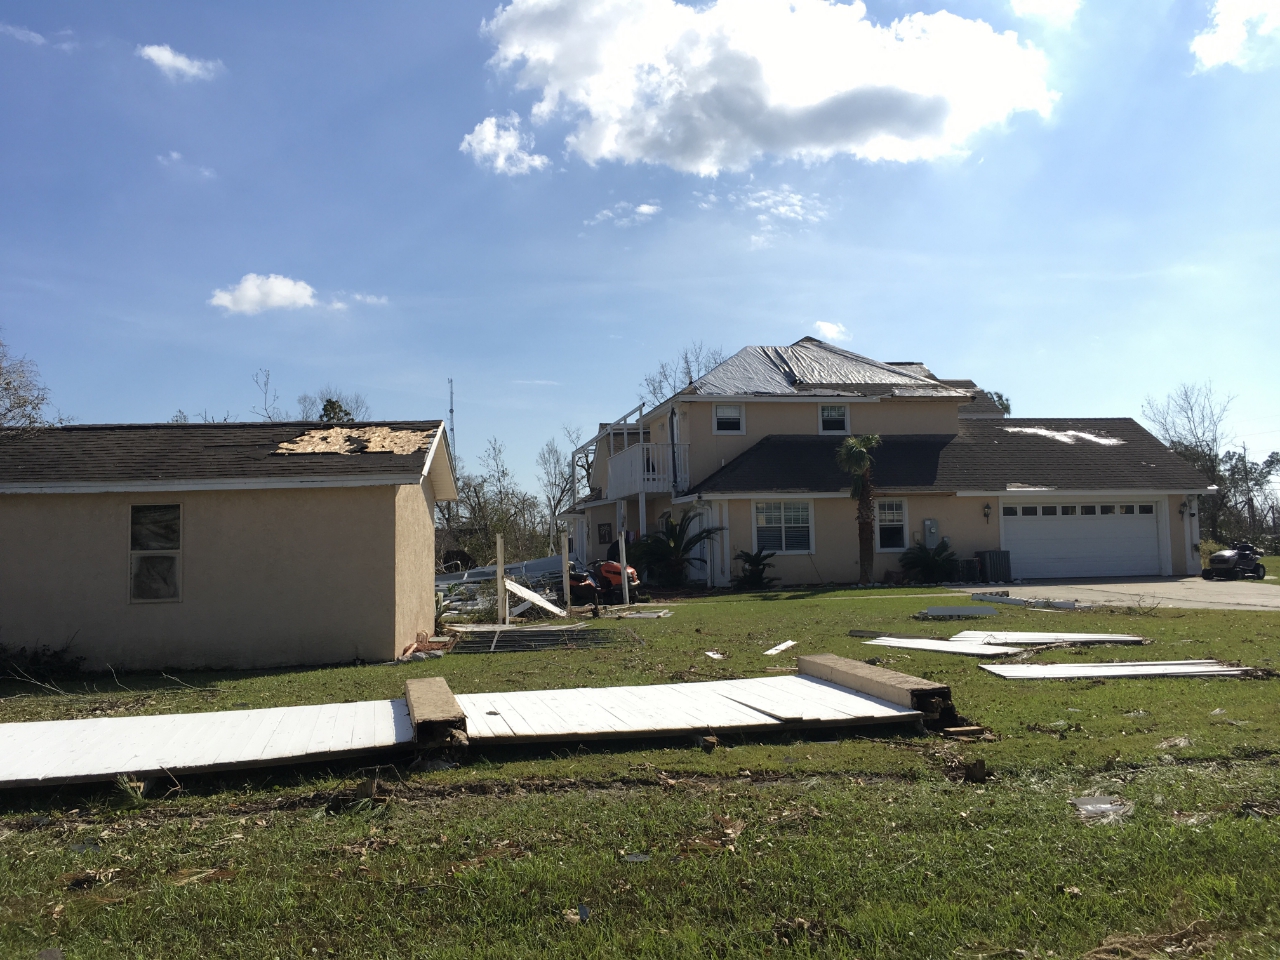
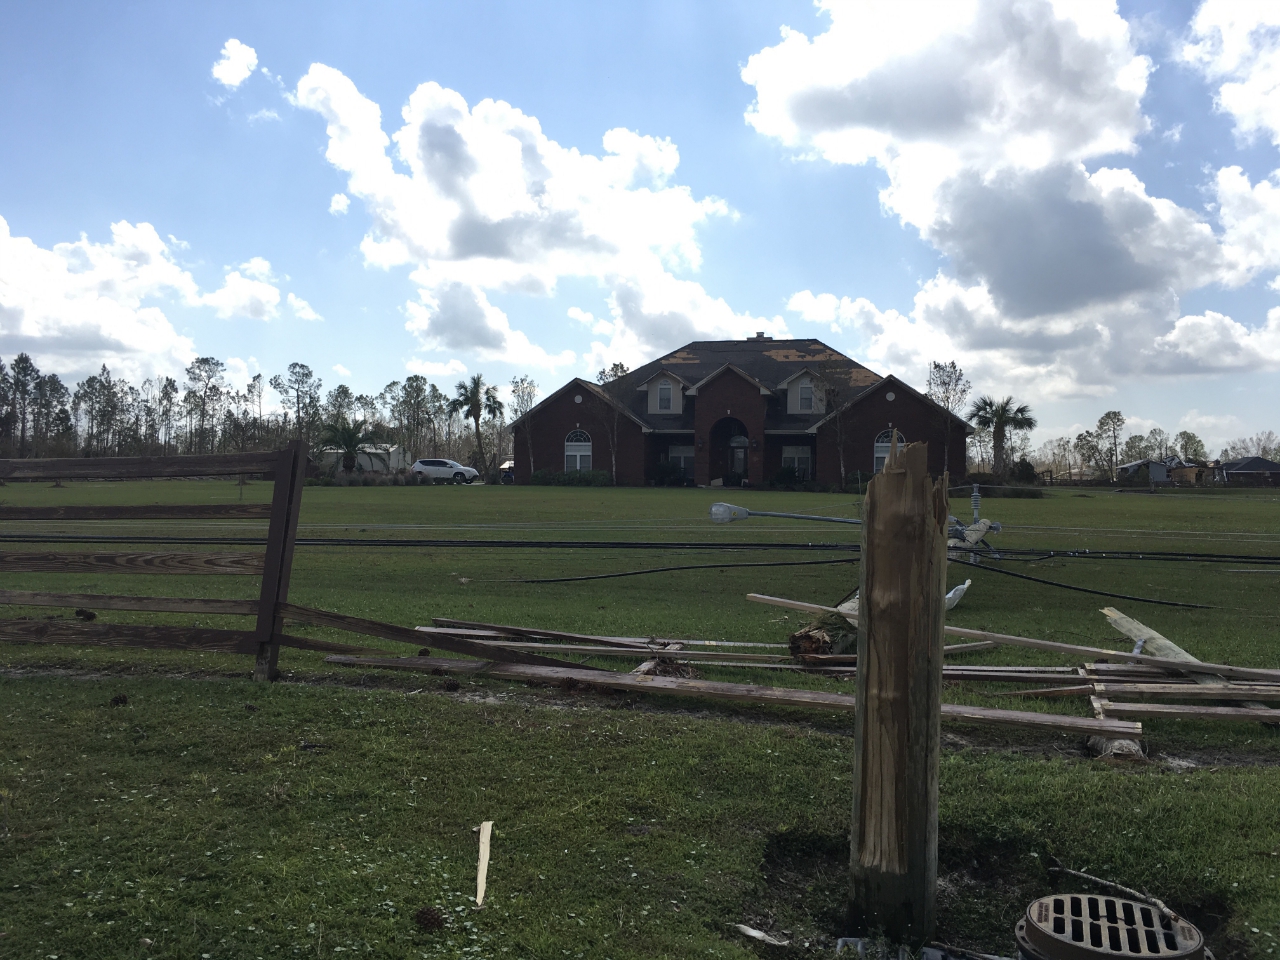
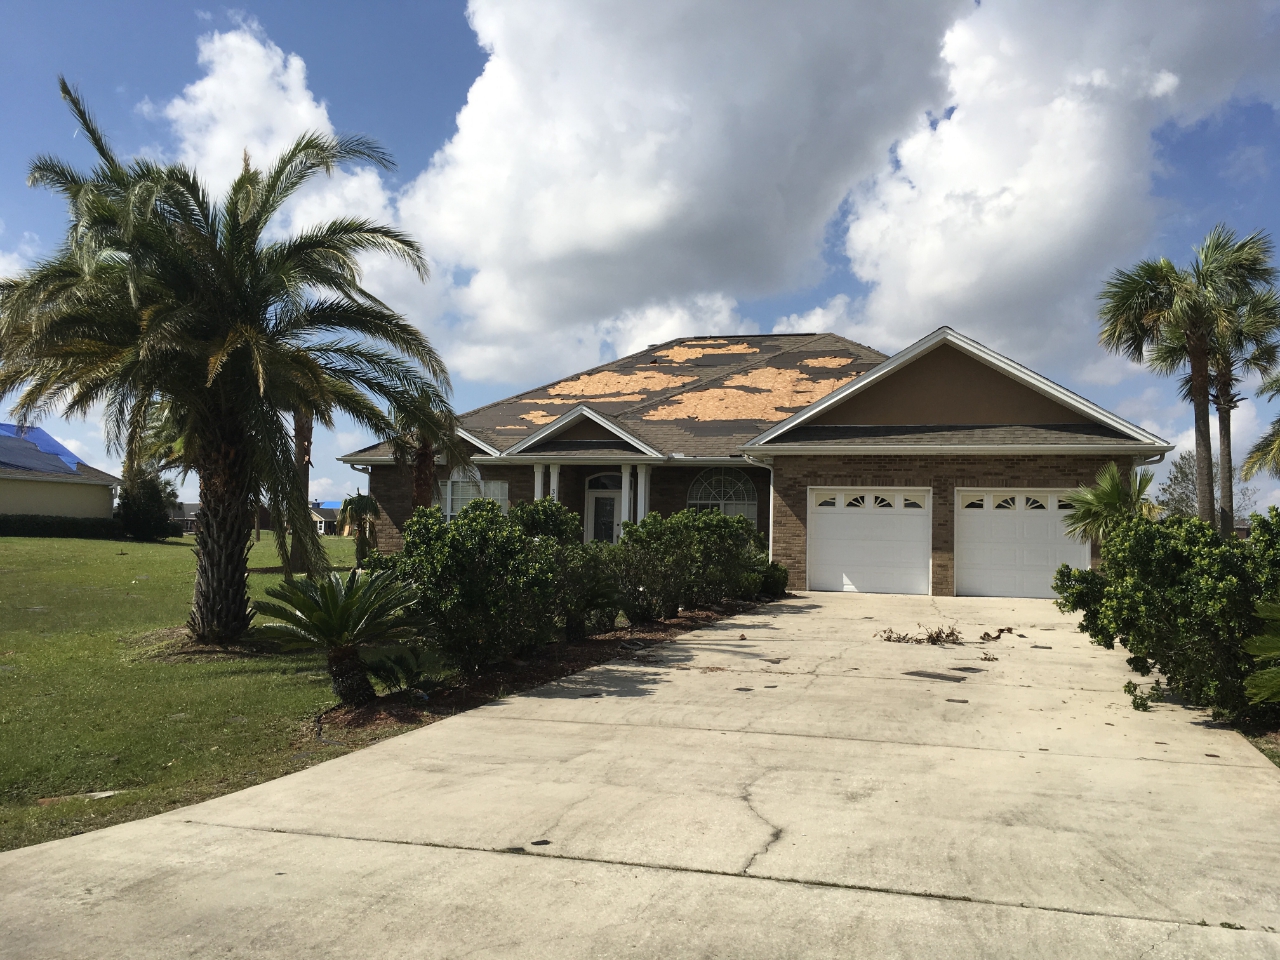
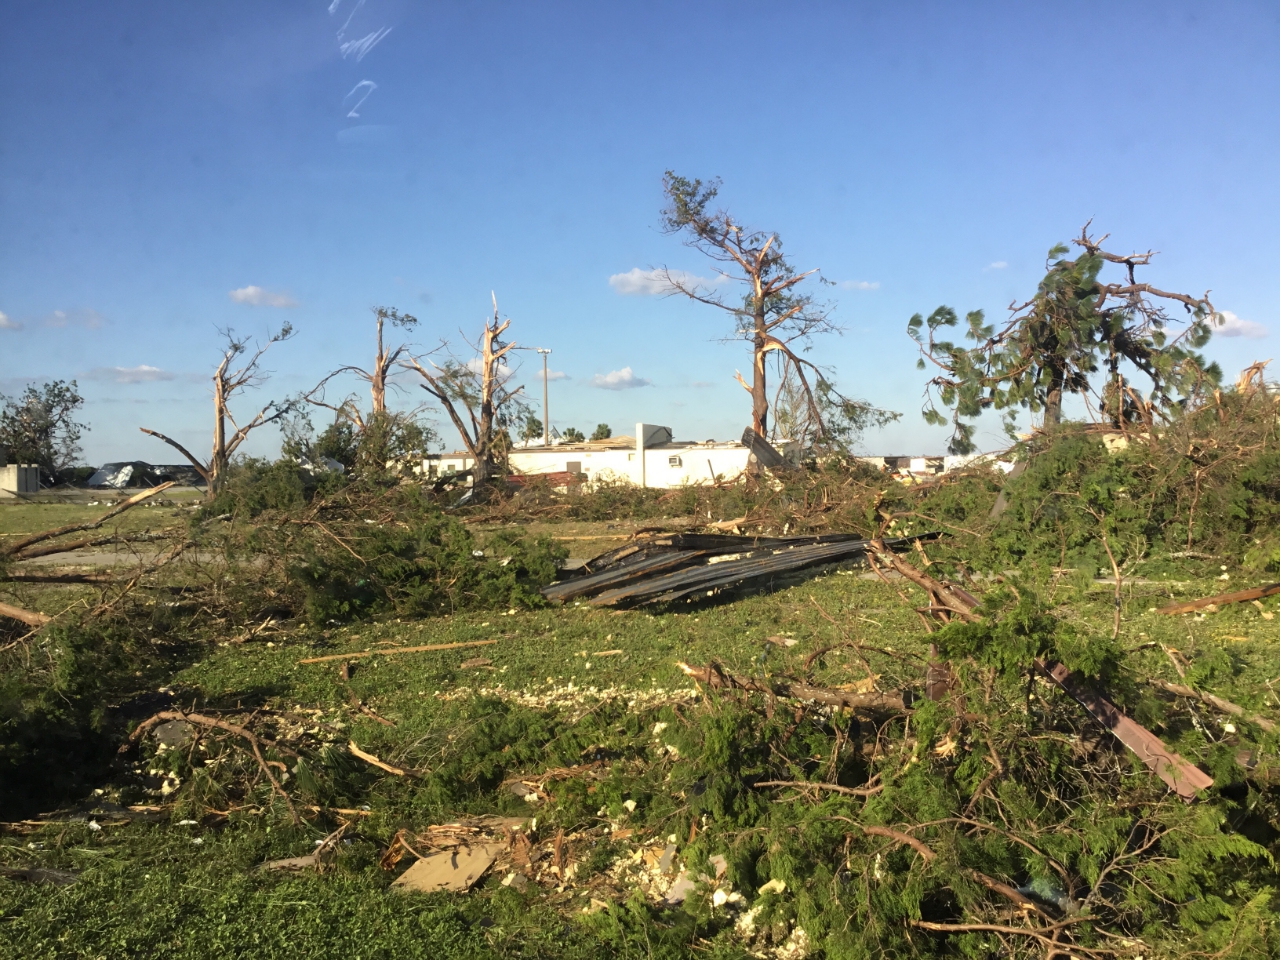
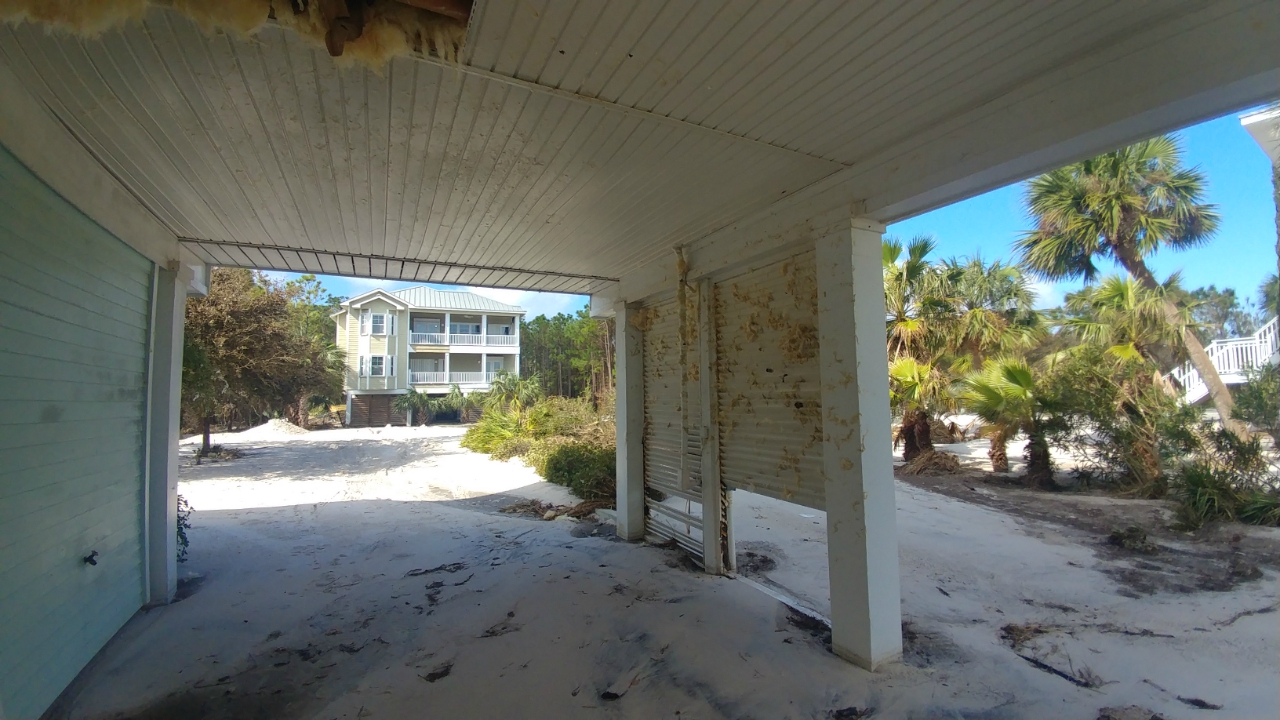
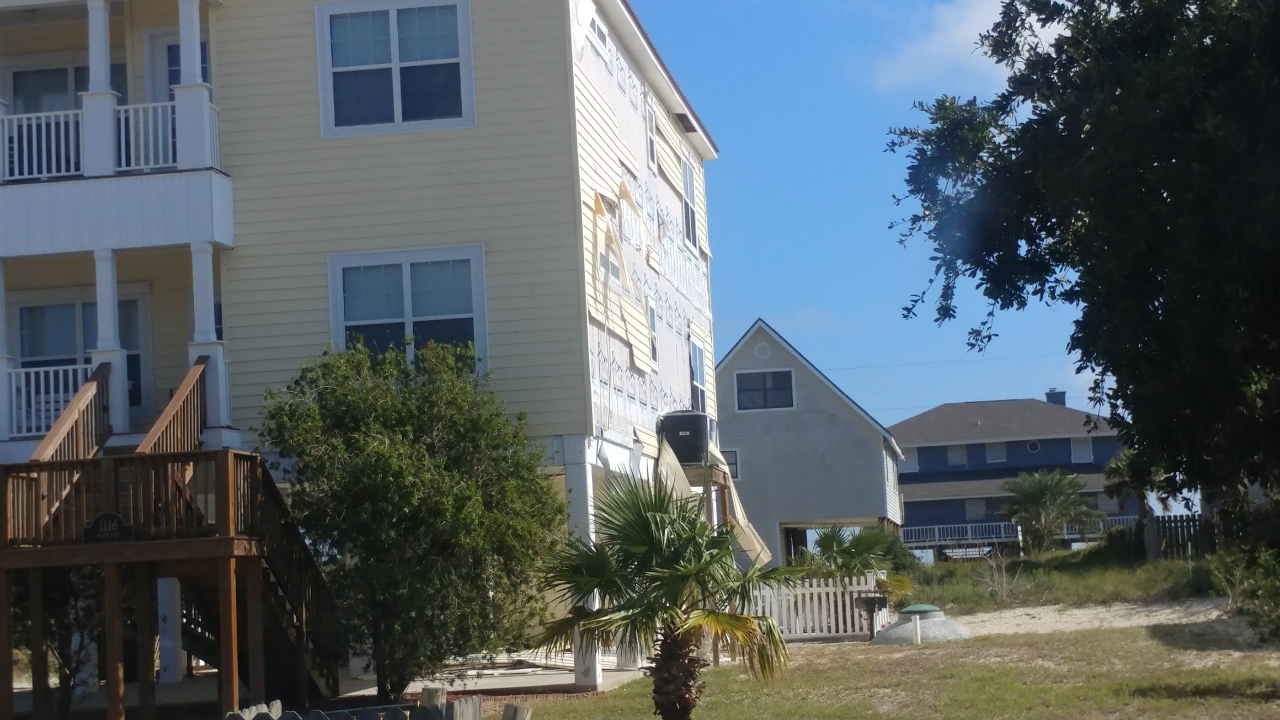
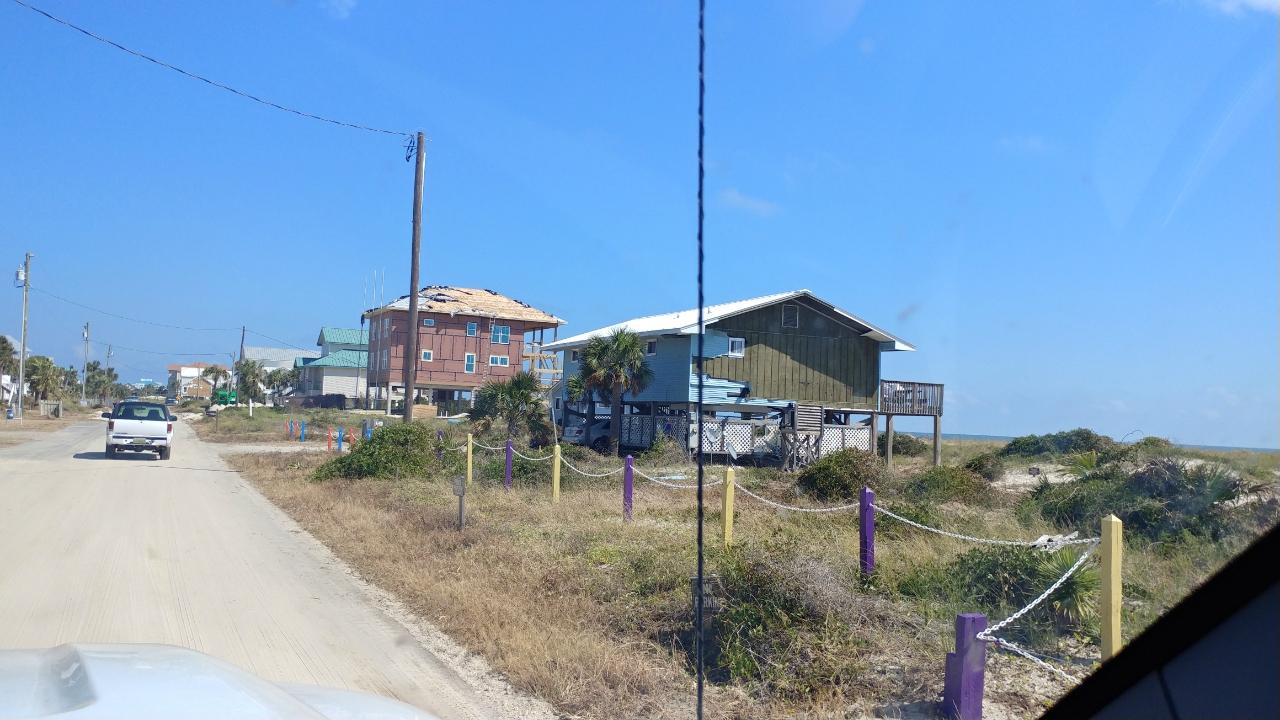
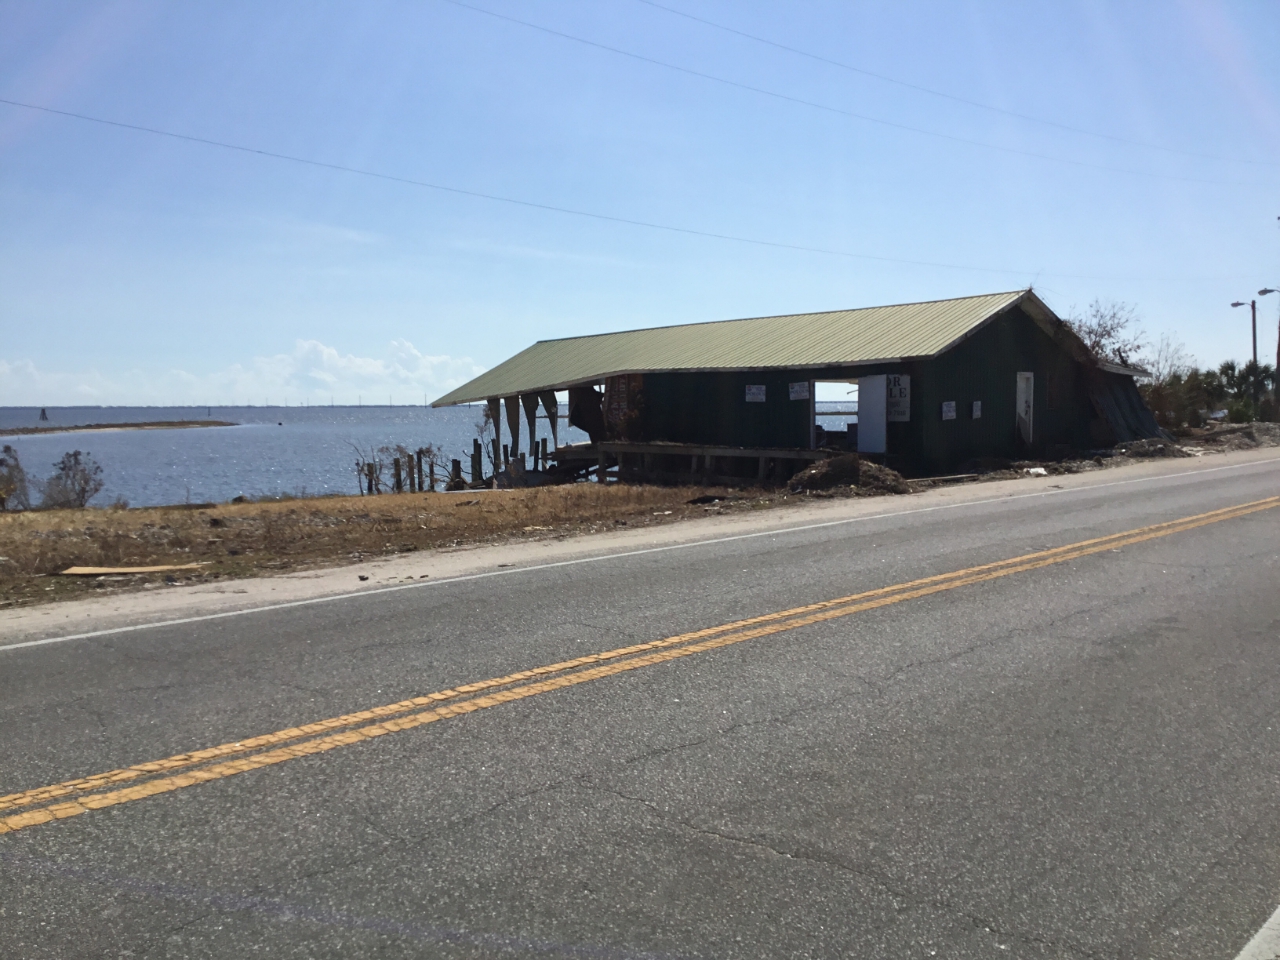
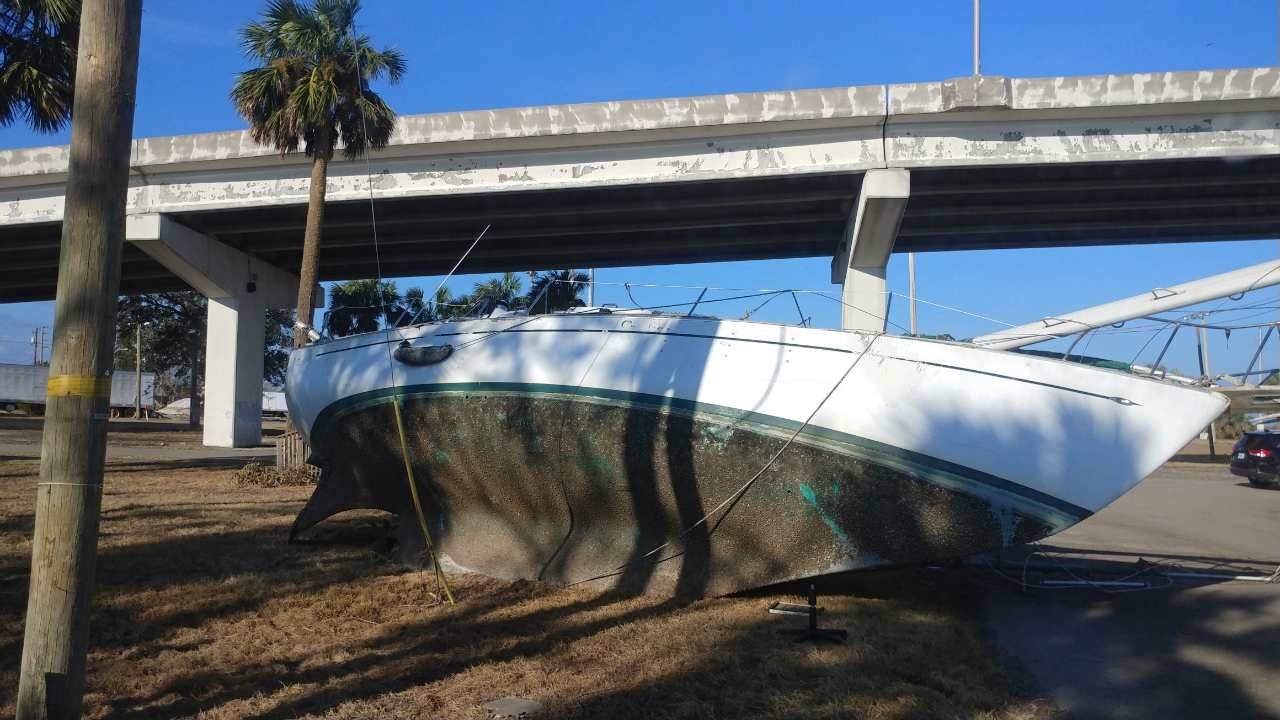
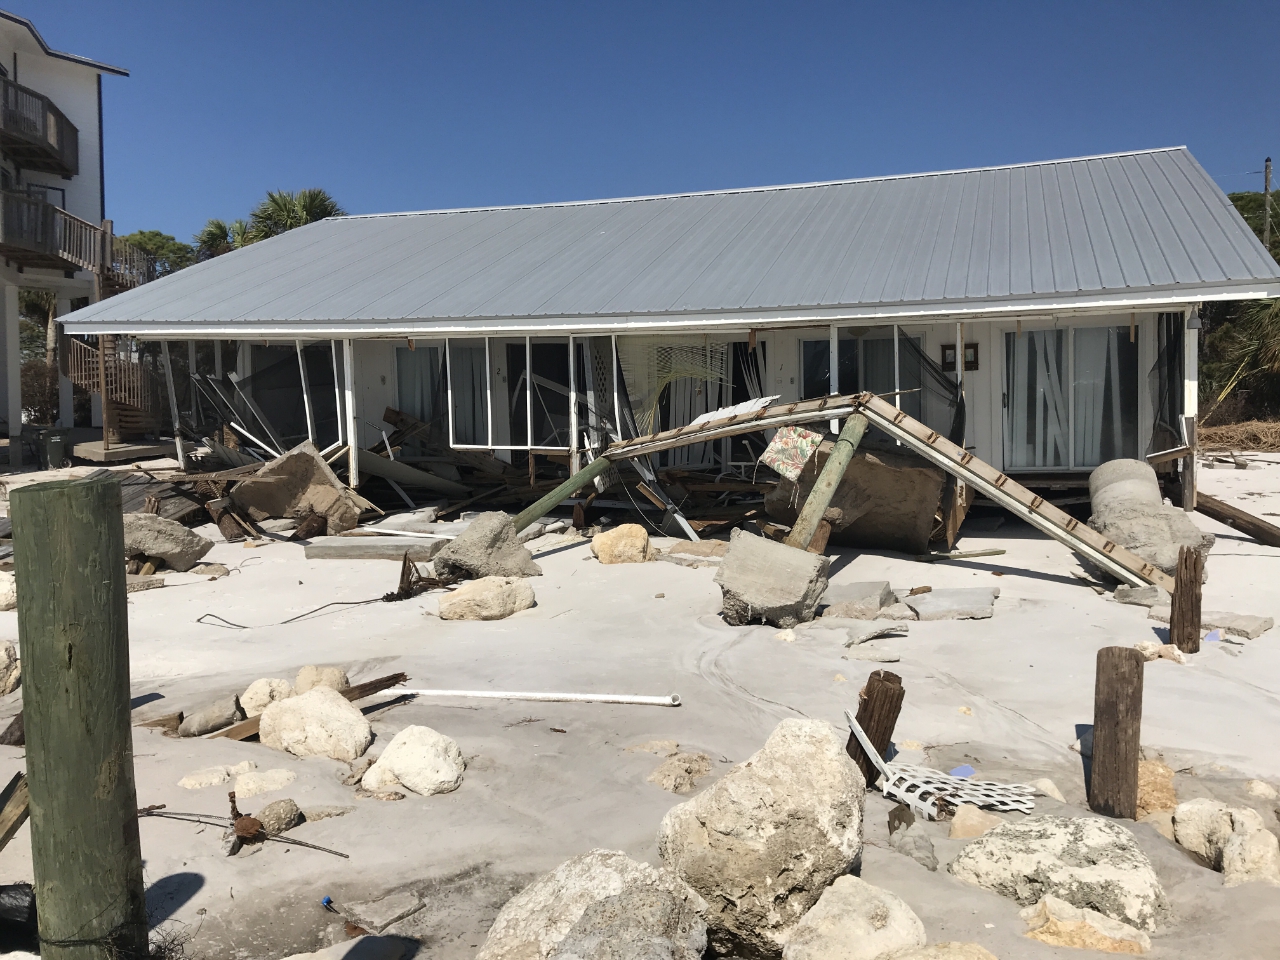
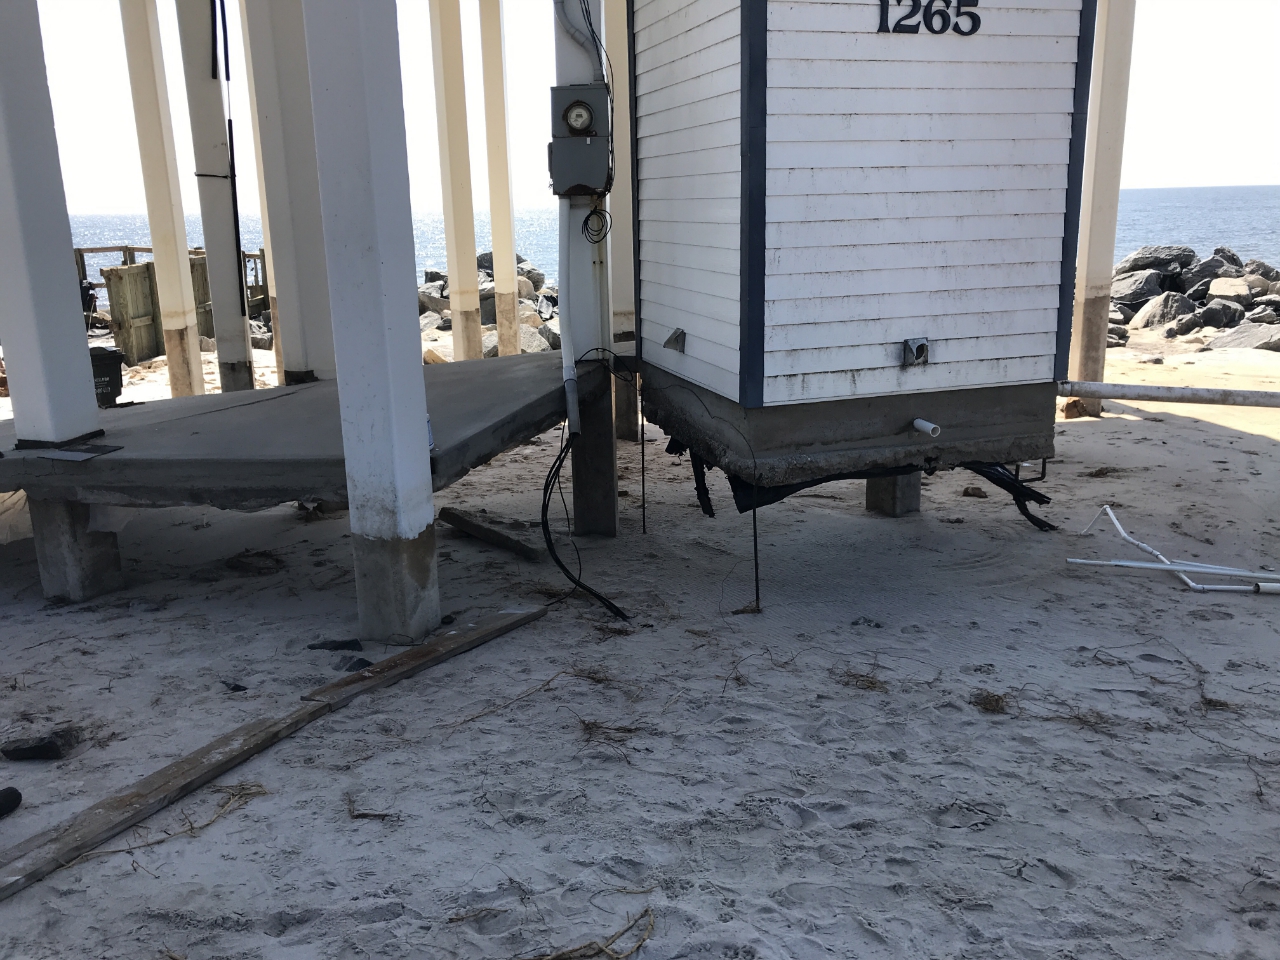
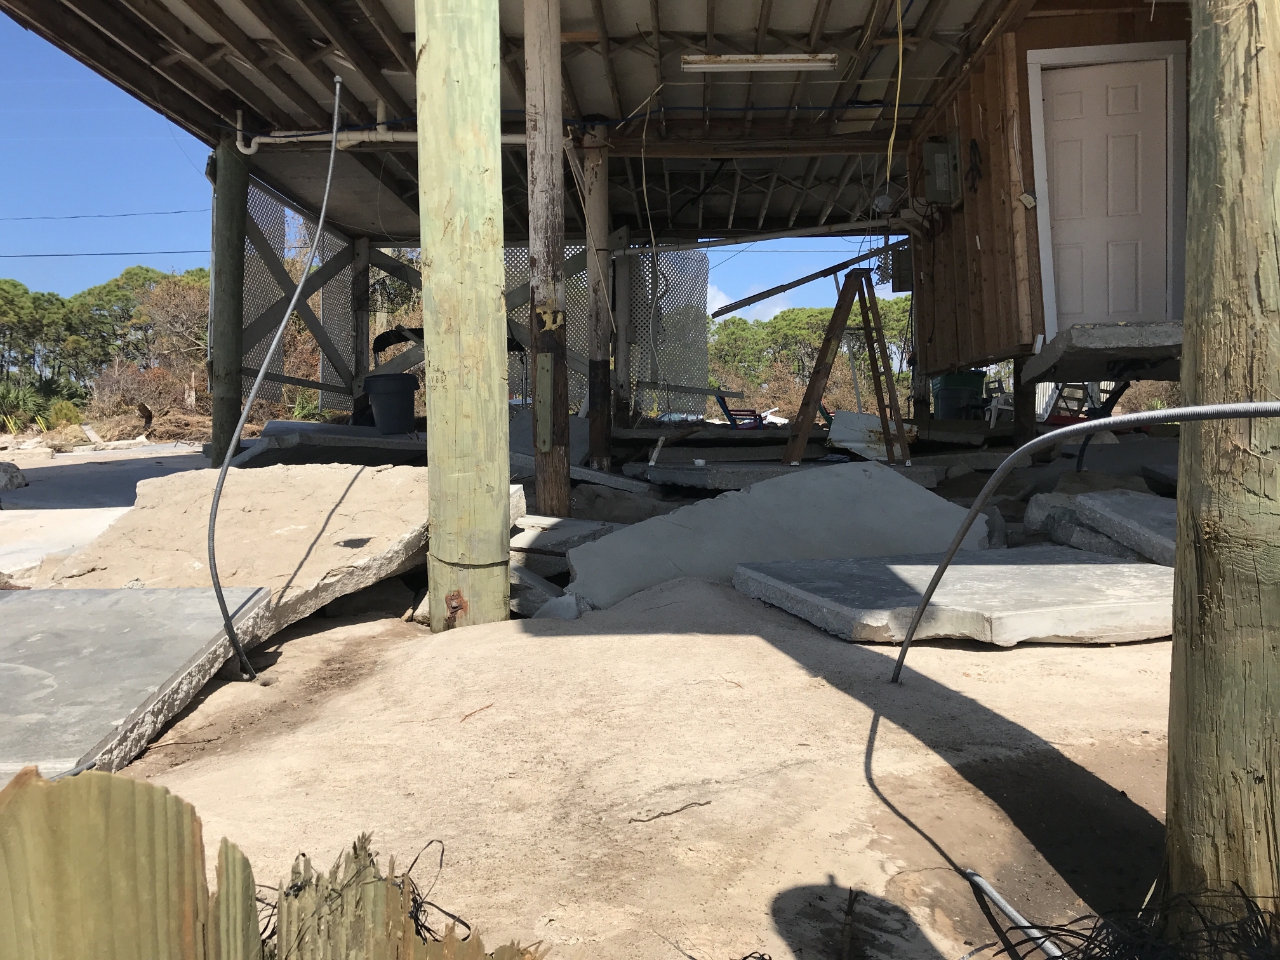
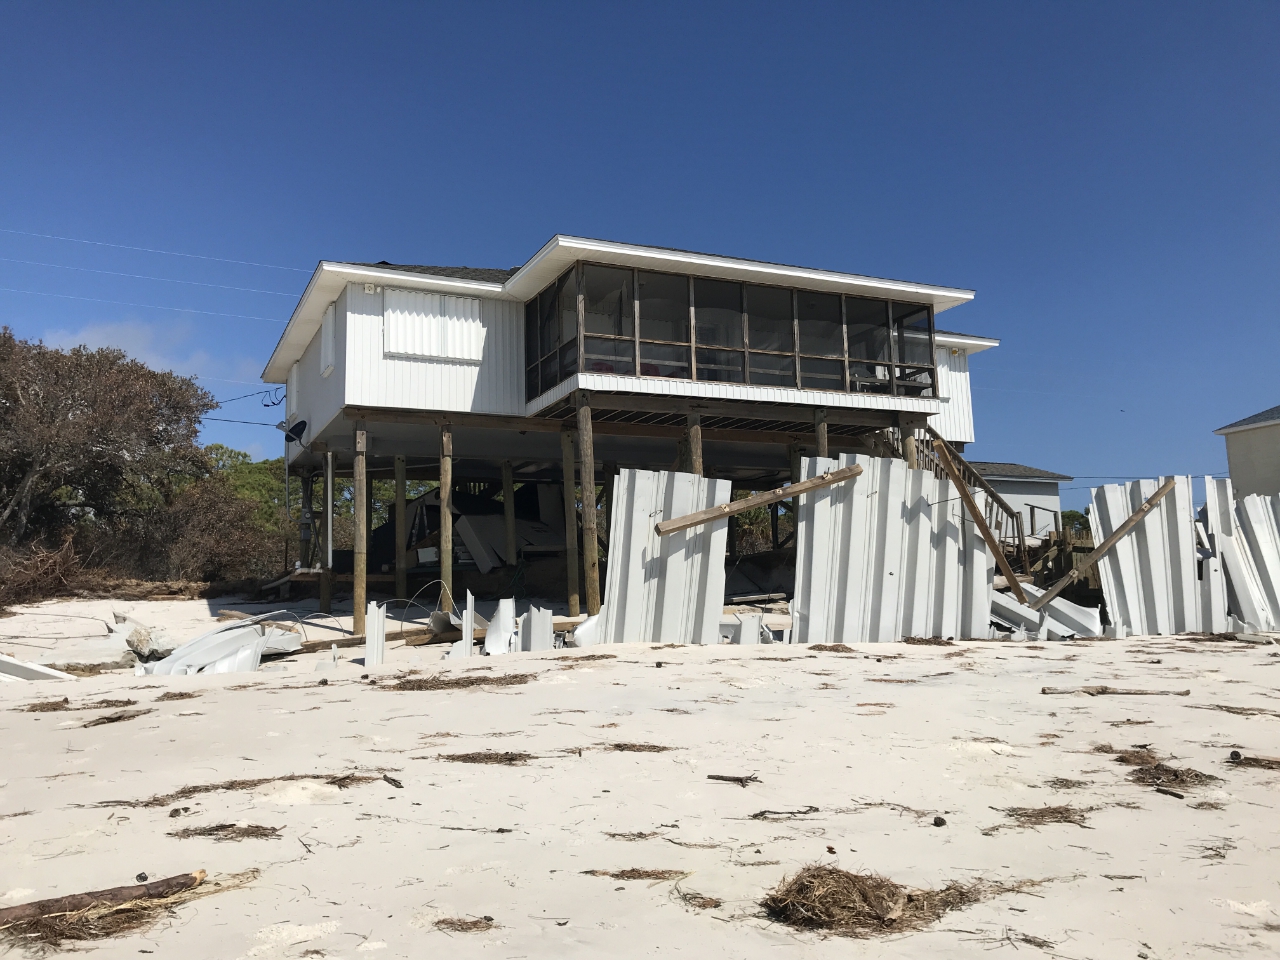
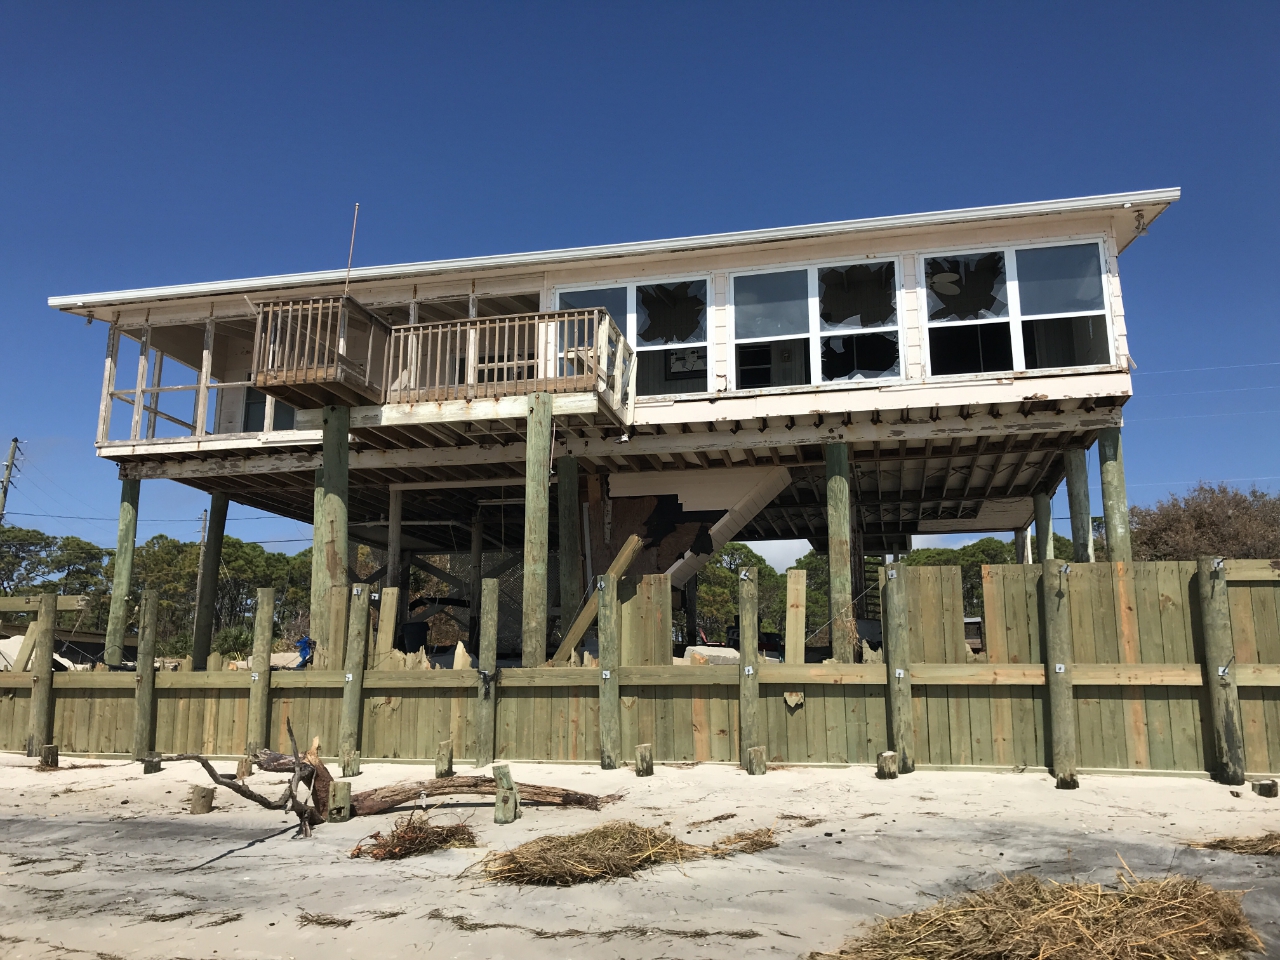
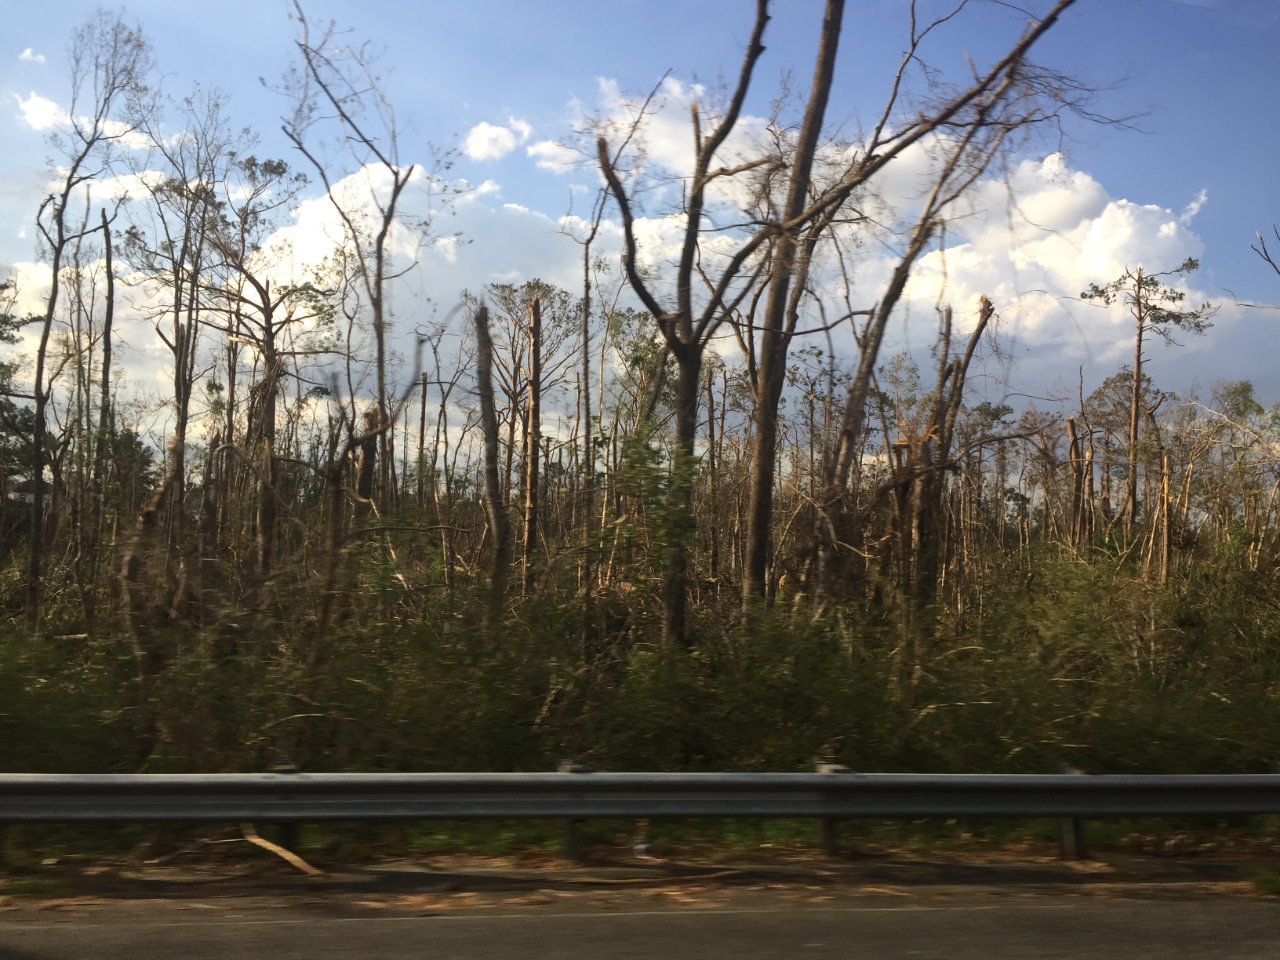
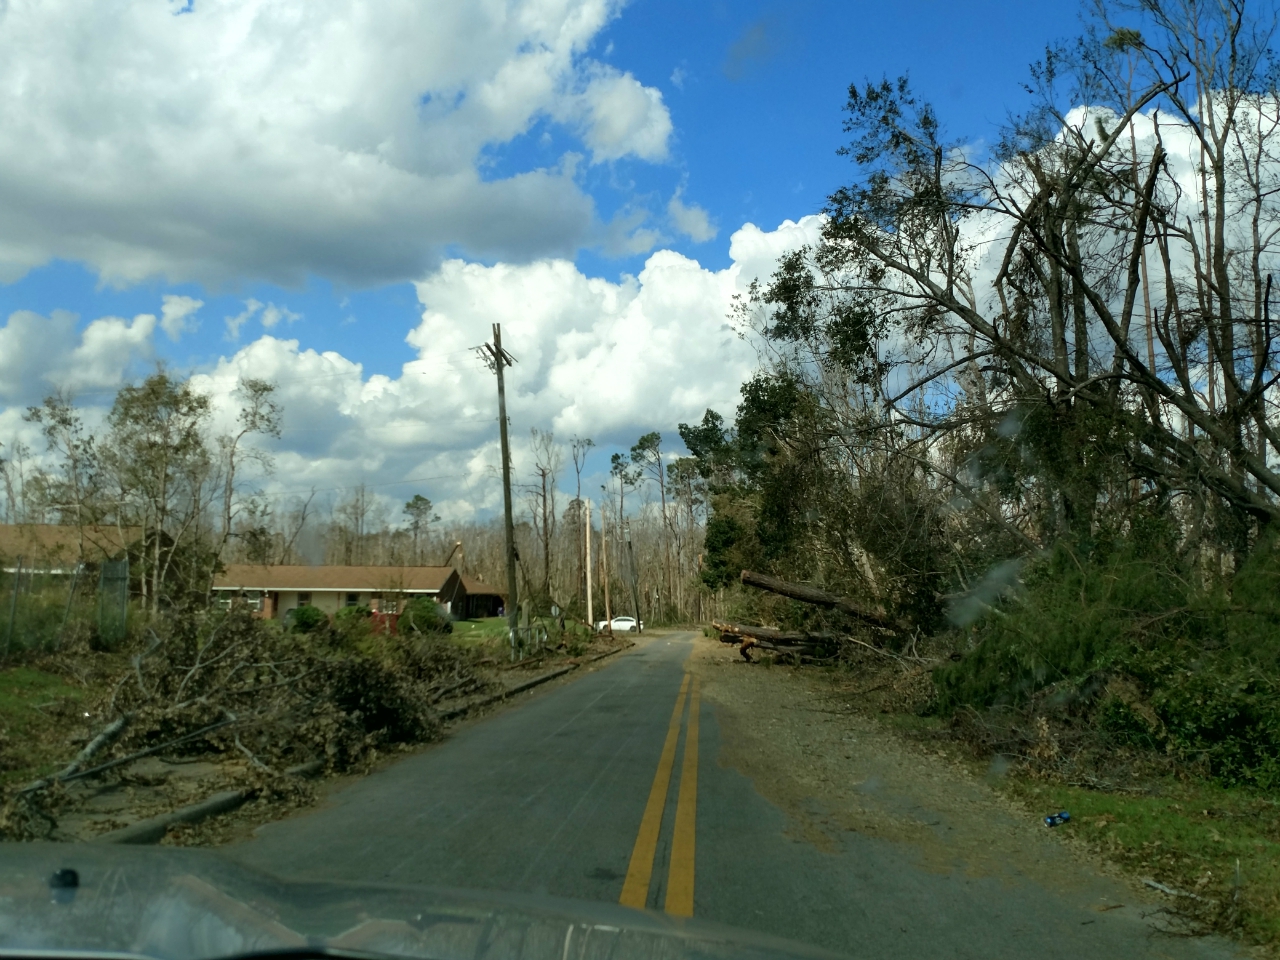
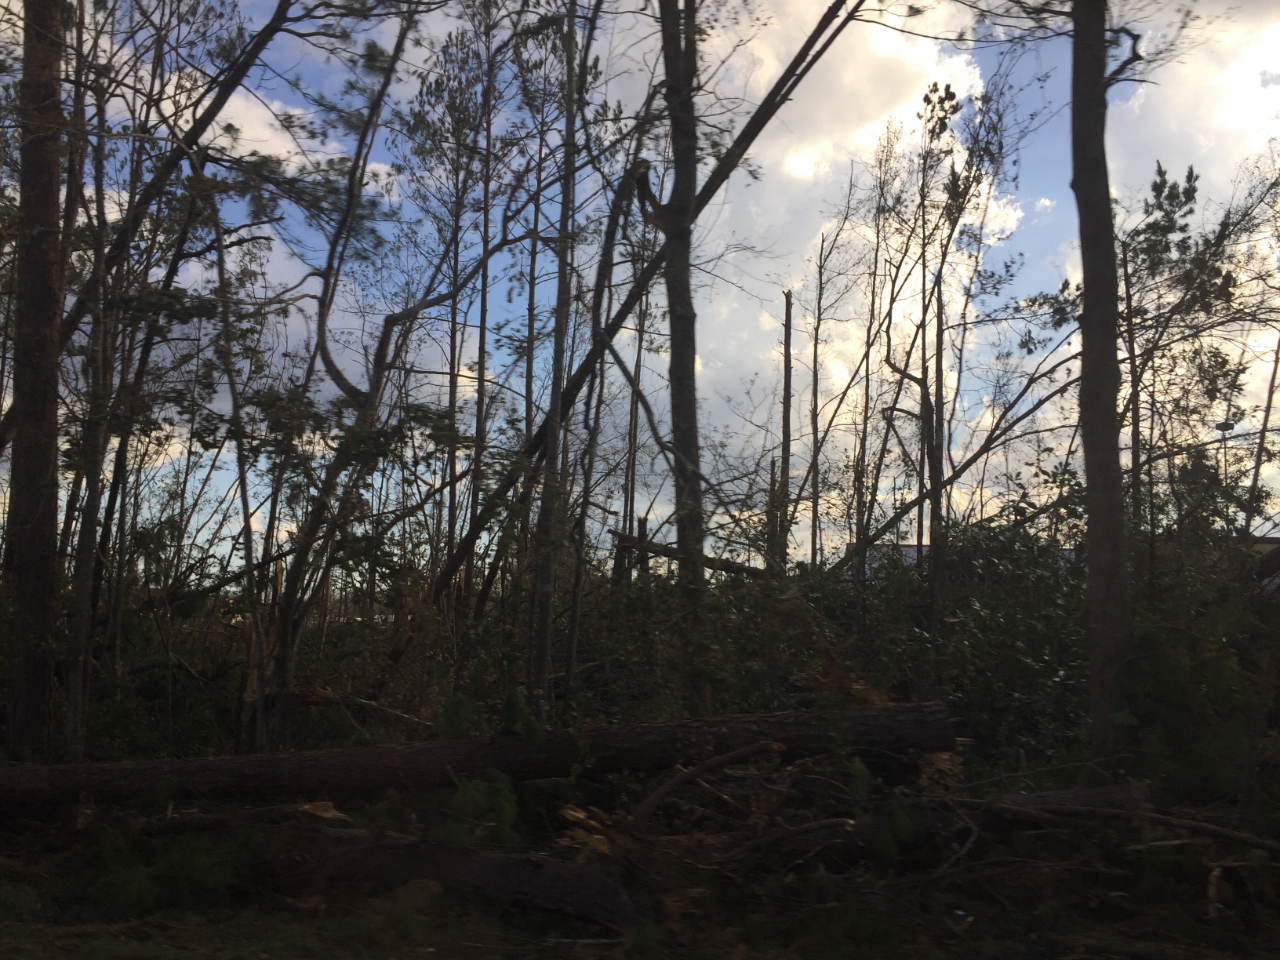
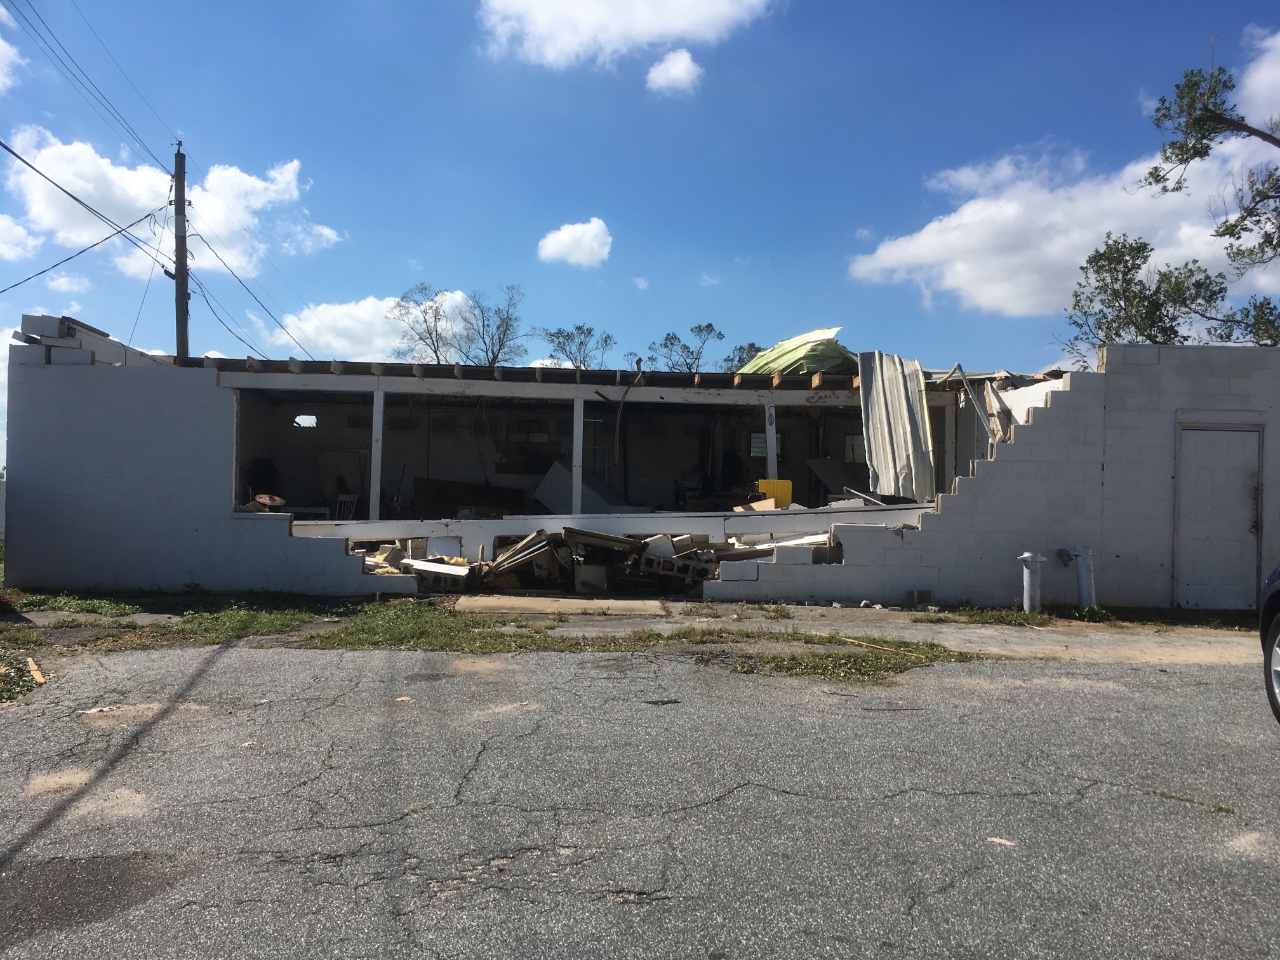
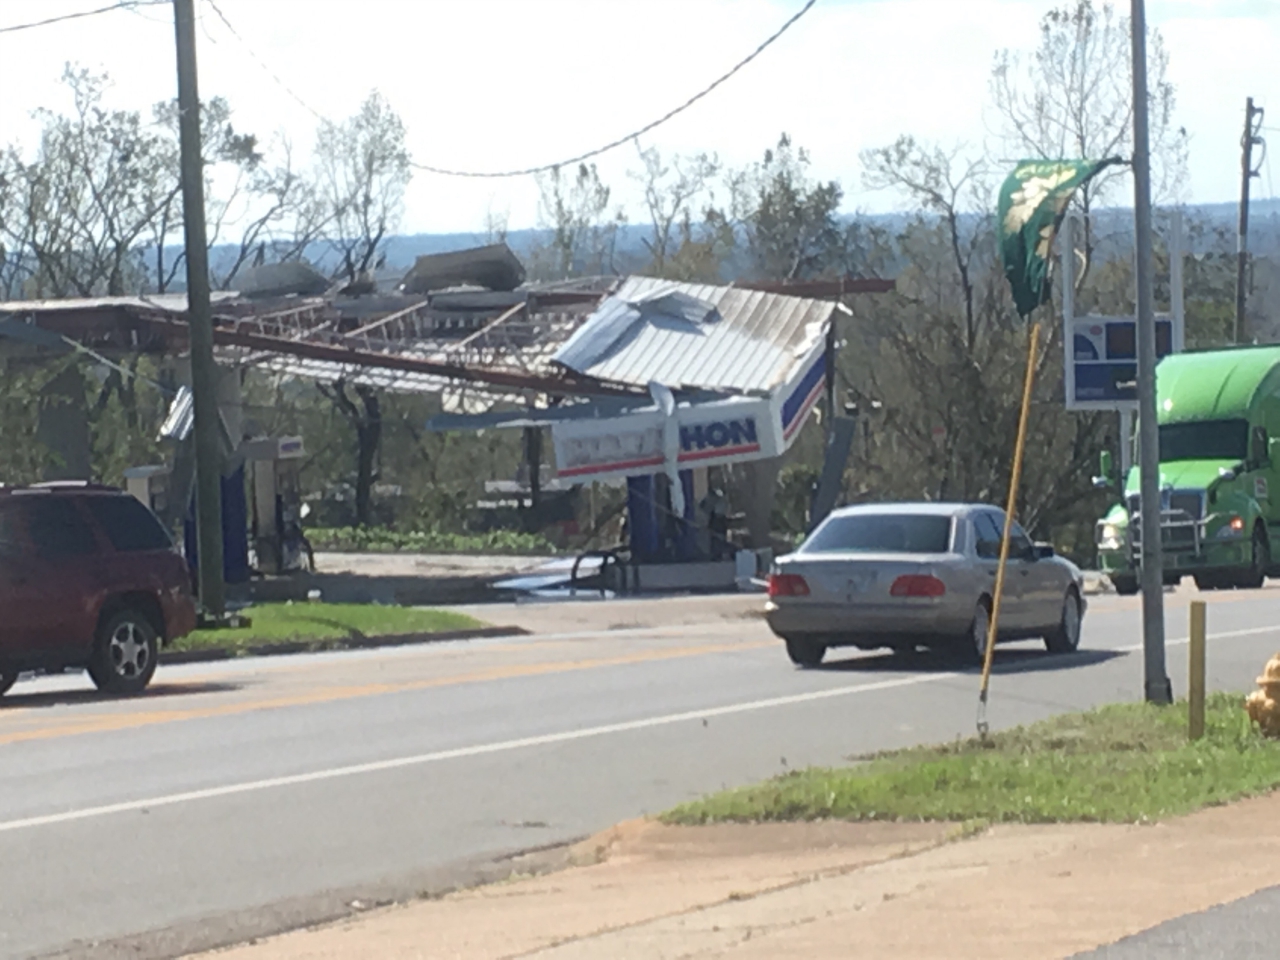
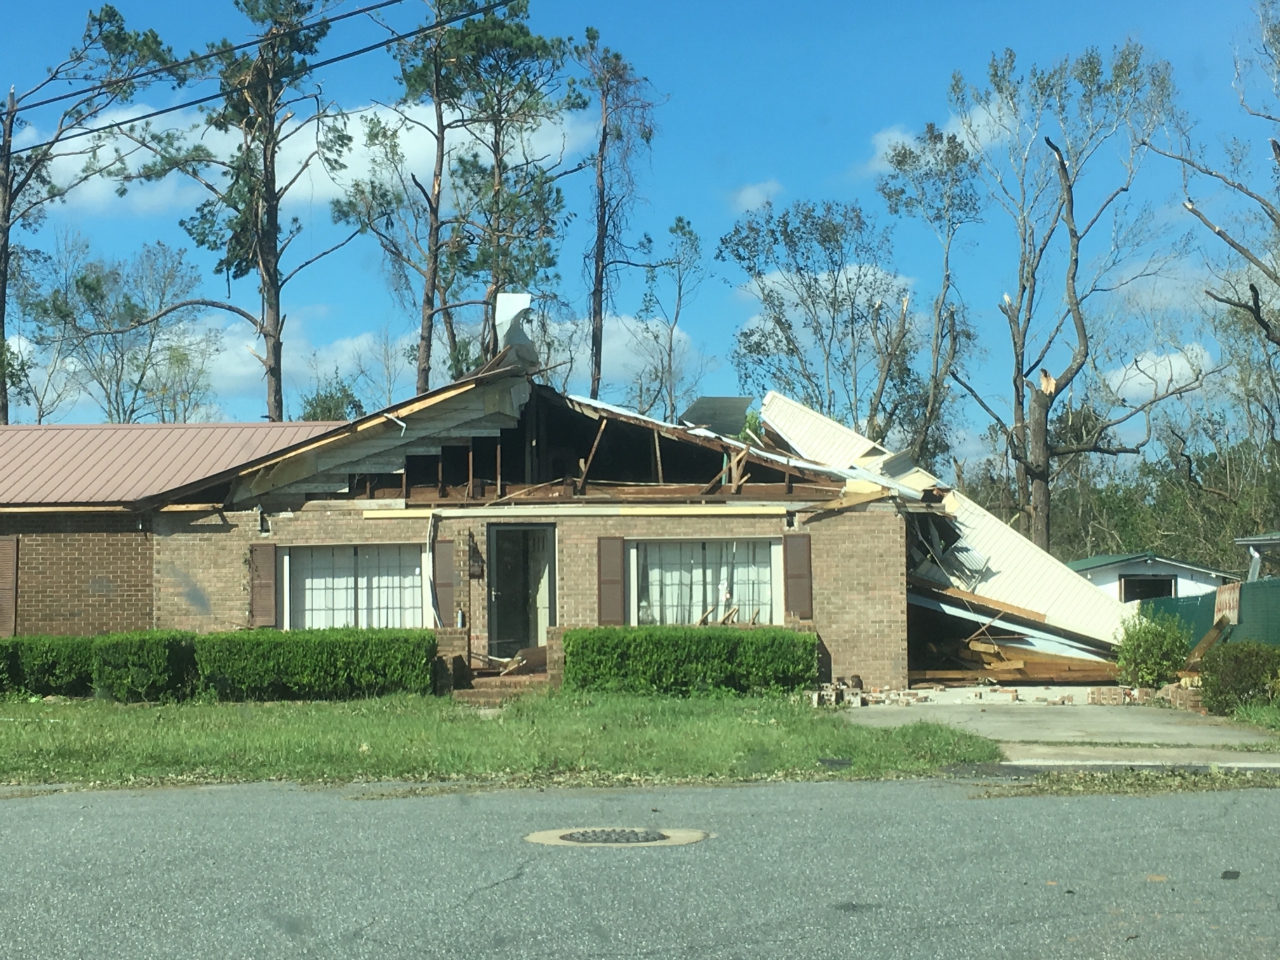
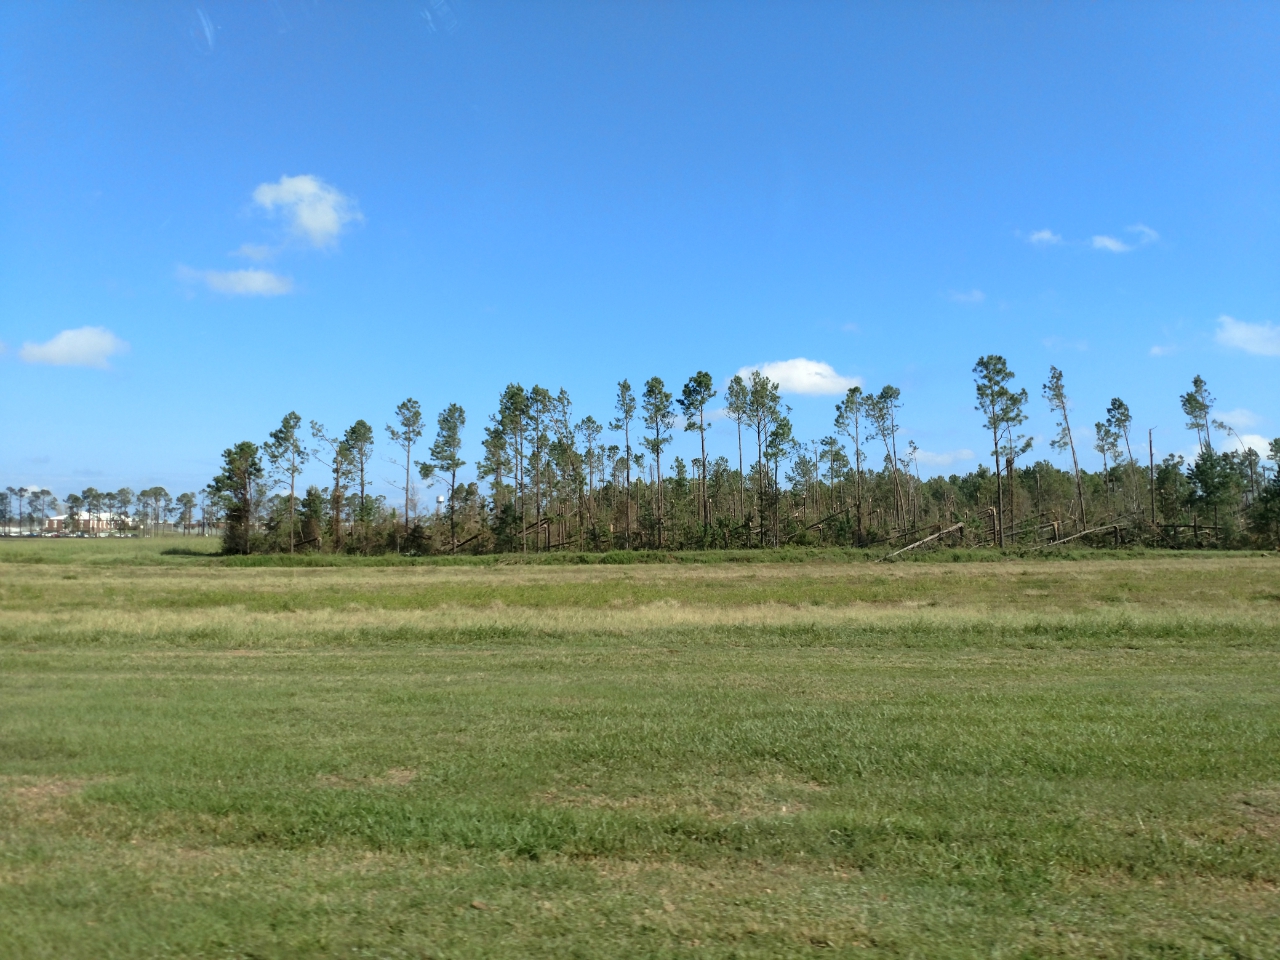
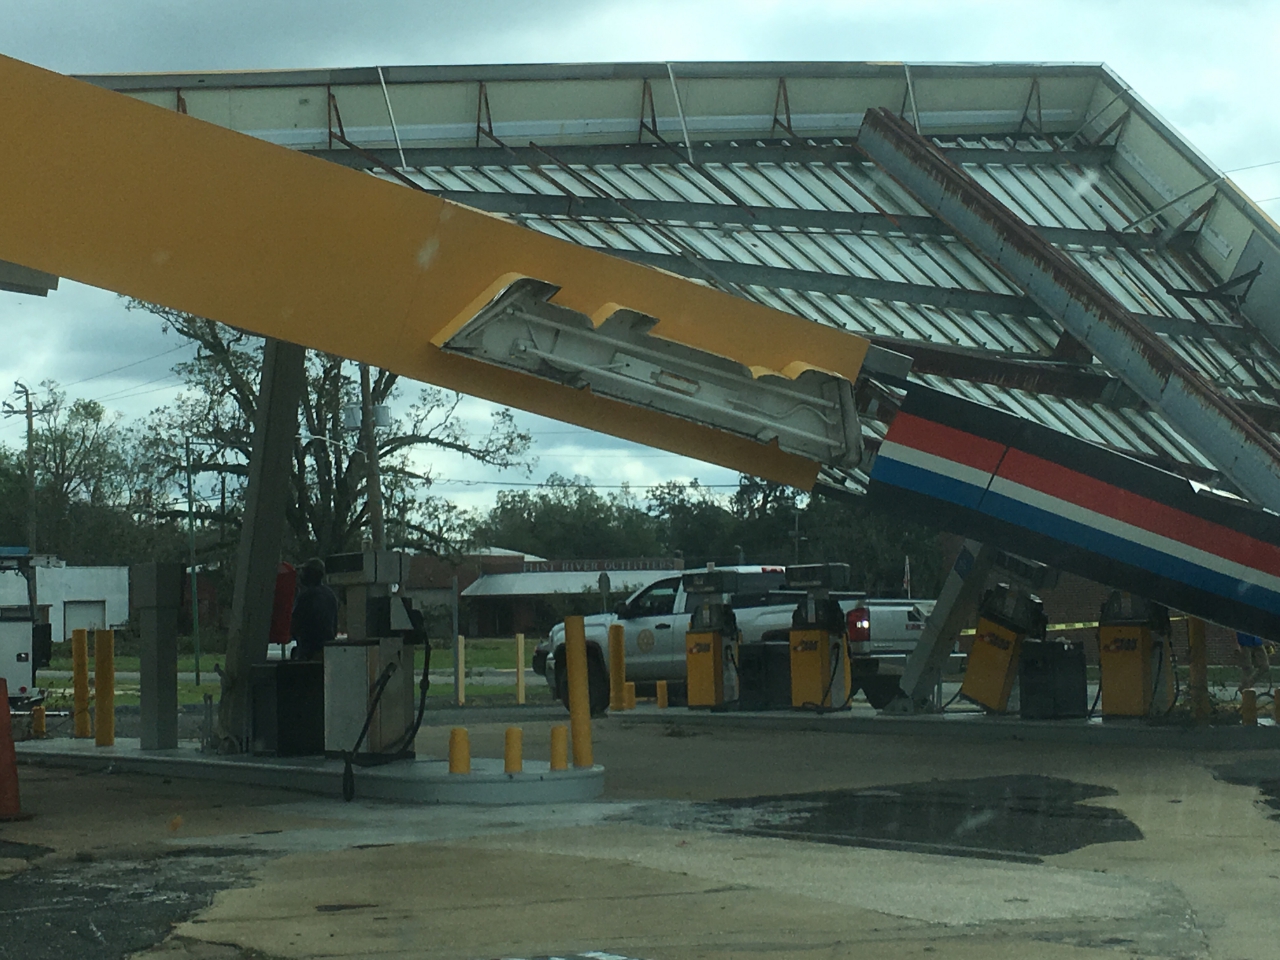
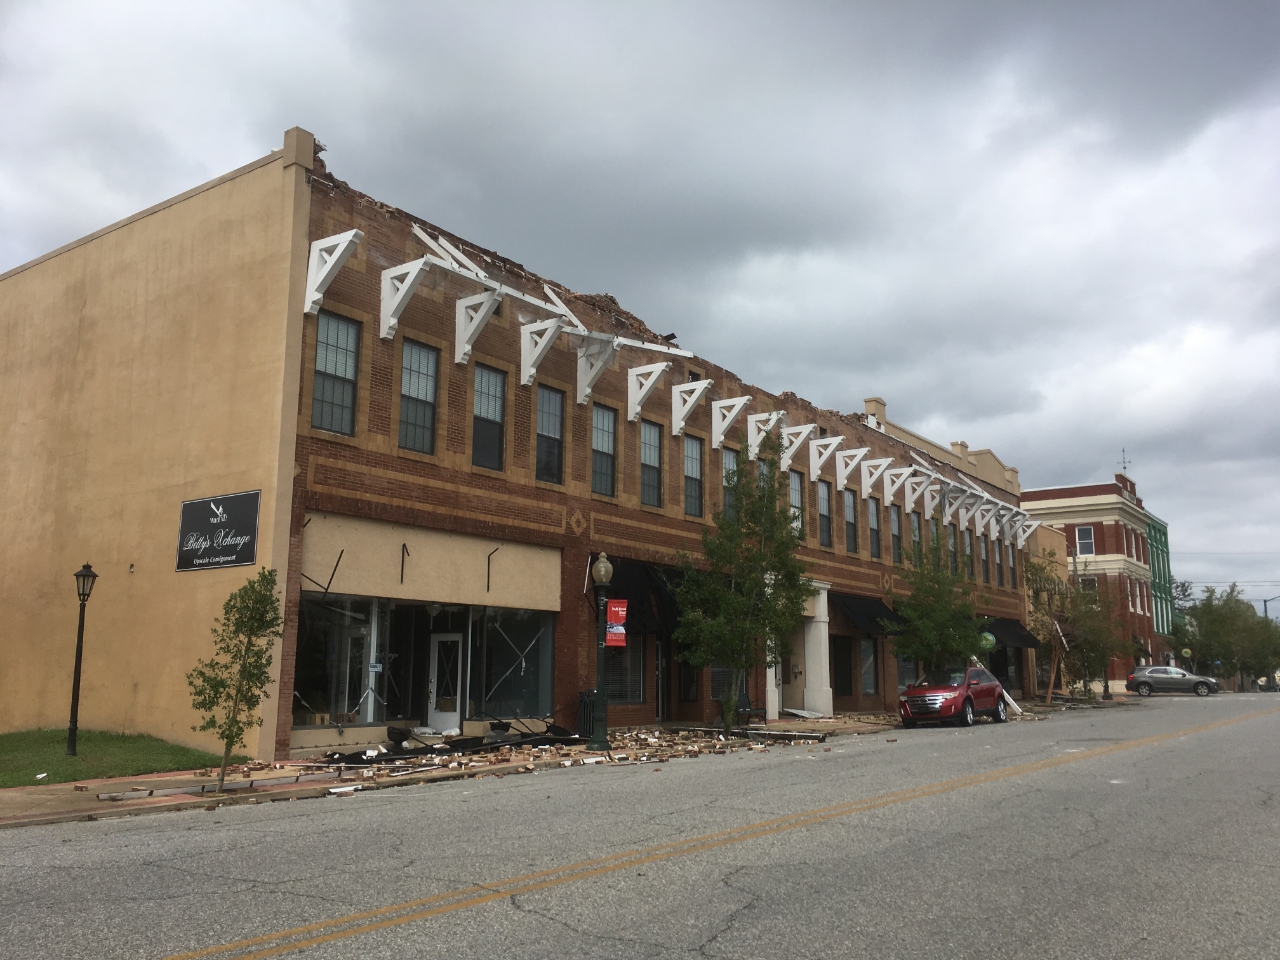
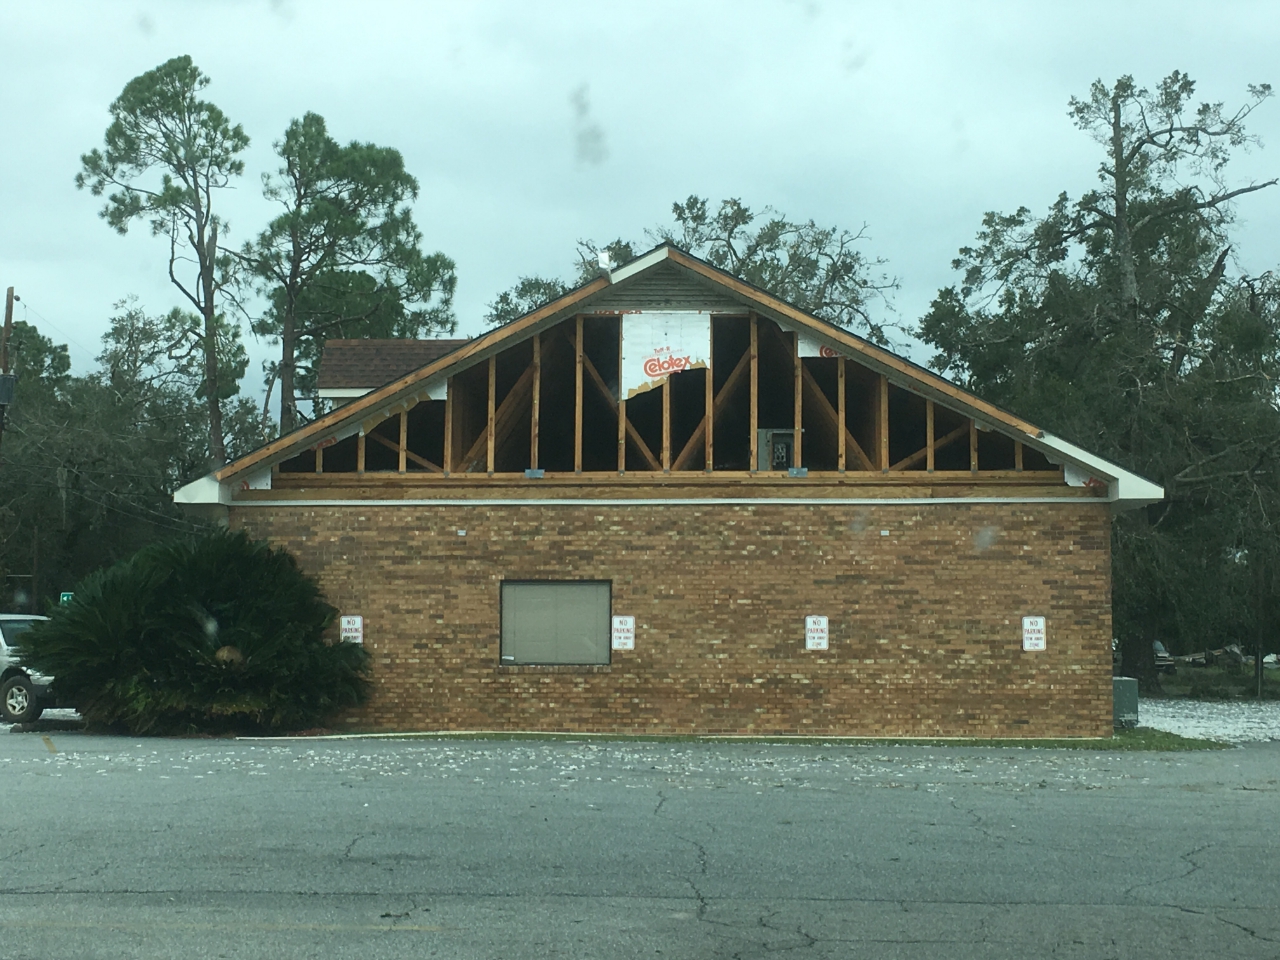
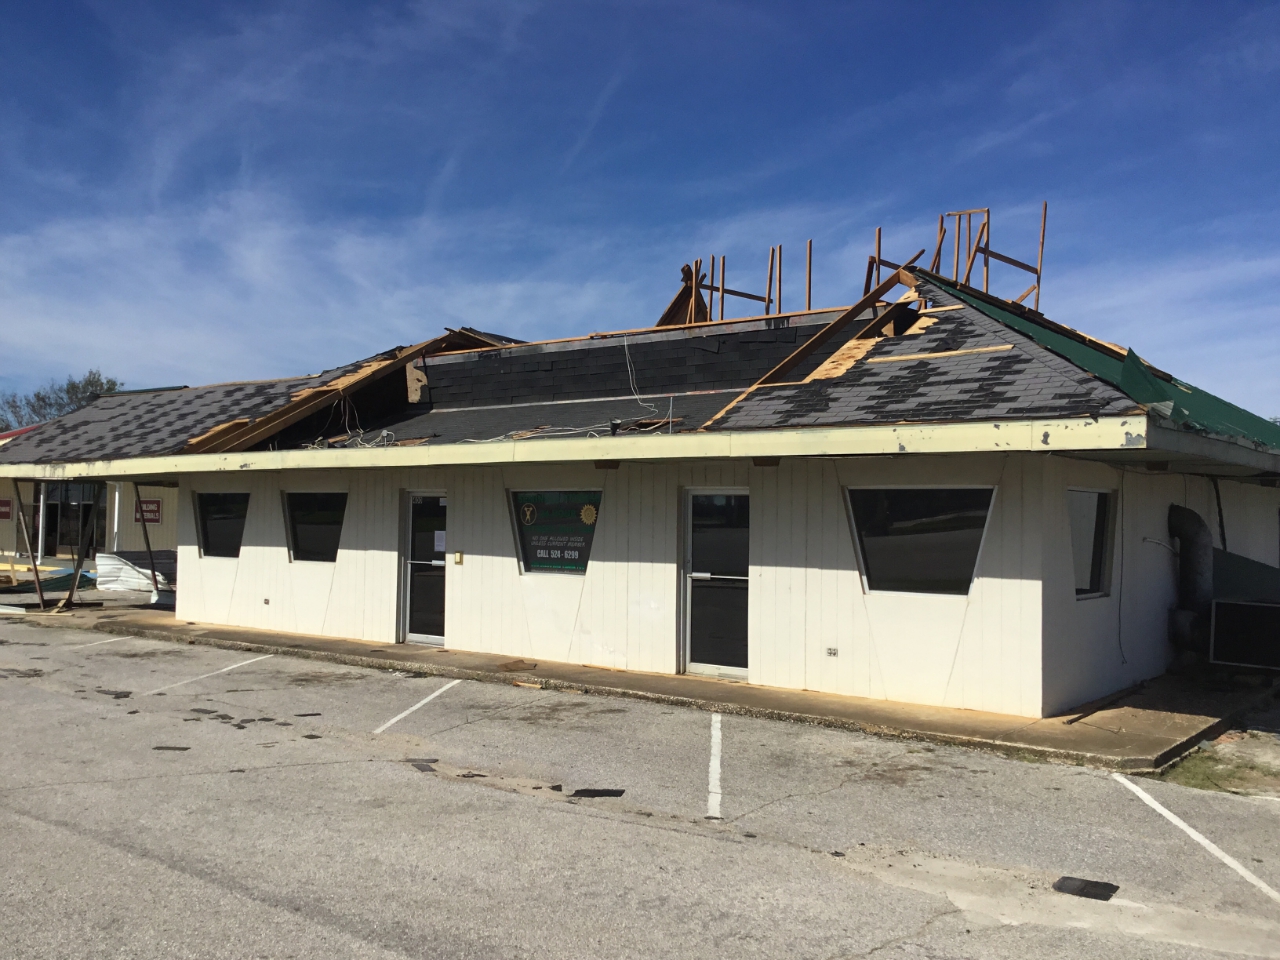
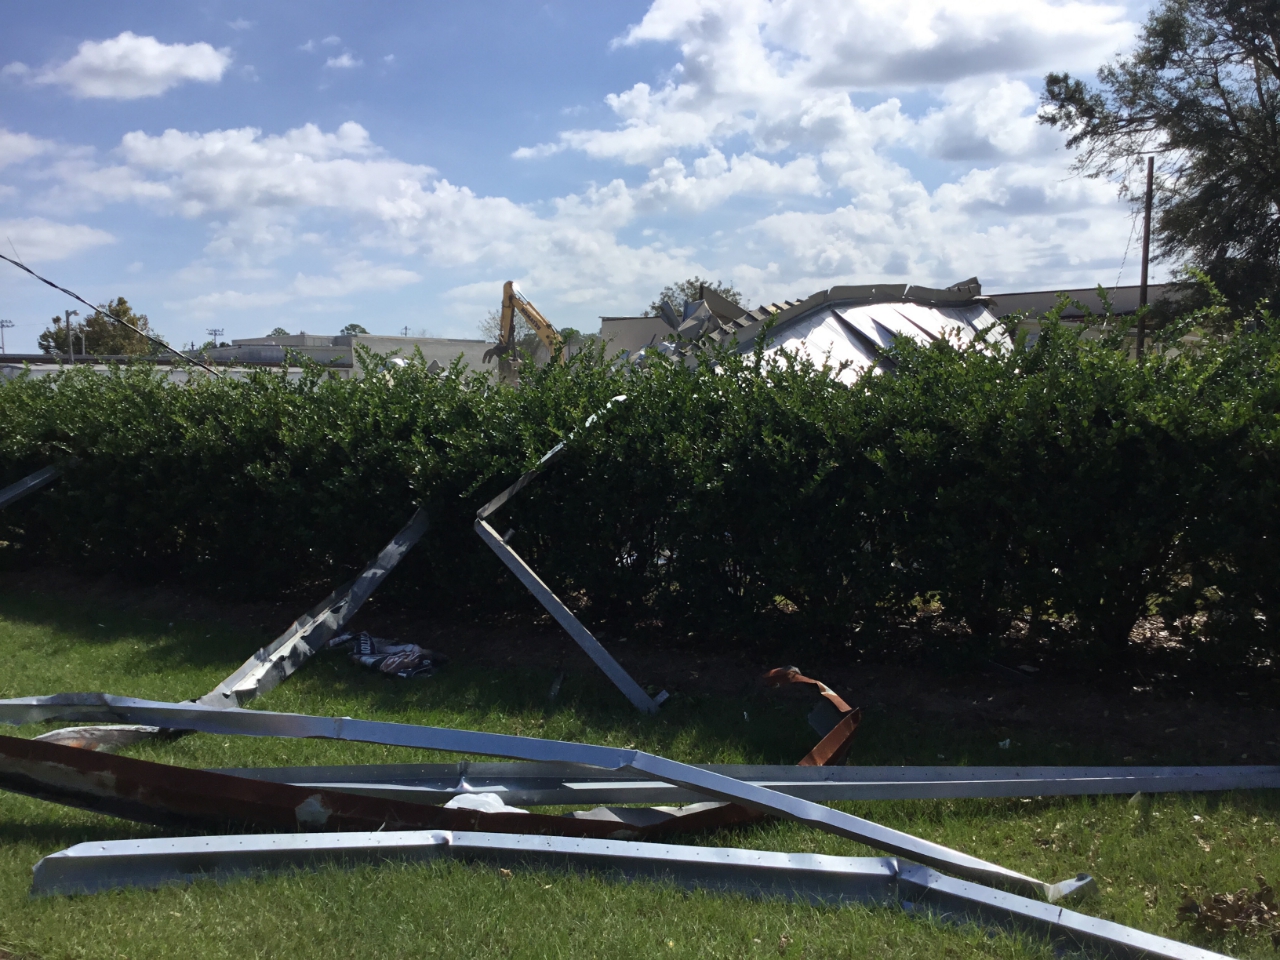
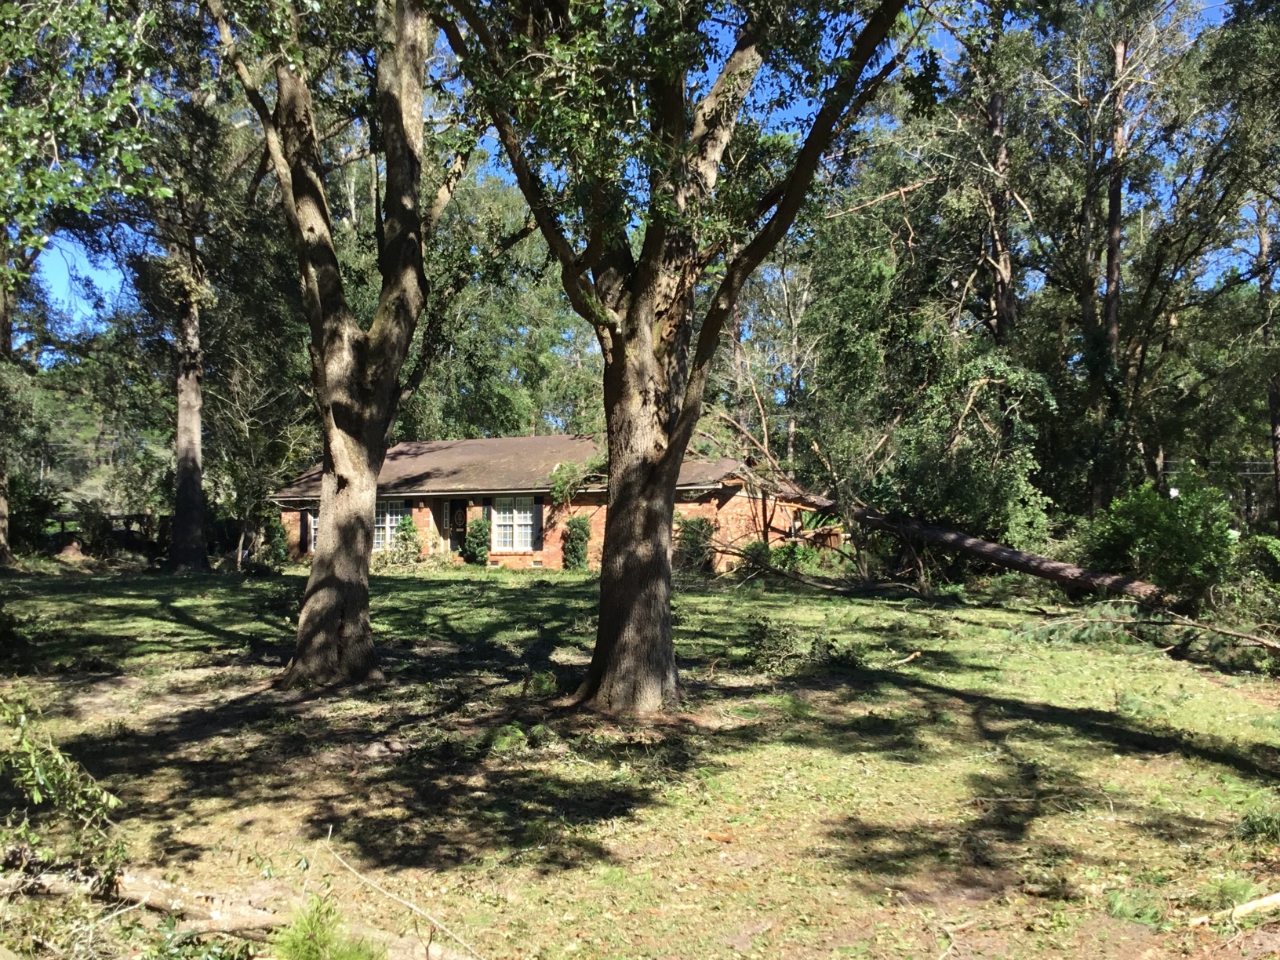
Hurricane Michael made landfall as an unprecedented Category 5 Hurricane in the Florida Panhandle region with maximum sustained wind speeds of 140 knots (161 mph) and a minimum pressure 919 mb. The storm caused catastrophic damage from wind and storm surge, particularly in the Panama City Beach to Mexico Beach to Cape San Blas areas. The widespread damage spread well inland as Hurricane Michael remained at hurricane strength into southwest Georgia. Each tab across the top of this page provides additional details relating to the storm, including a detailed description of the storm's history and impacts to the tri-state area. With such a large impact, some assessments are still ongoing and thus information on this page is preliminary and will be updated as needed. If you were impacted by Hurricane Michael and are in need of assistance please check with FEMA regarding your eligibility. Overview Hurricane Michael started as typical weak October Caribbean tropical system. However, after approximately a week of slow development, the system moved into warm Gulf of Mexico waters and rapidly intensified into a major hurricane as it moved north towards the Florida Panhandle. After a 2-day long intensification period over the eastern Gulf, Michael made landfall (Figure 1) as an unprecedented (for the region) category 5 hurricane (on the Saffir-Simpson Hurricane Wind Scale). Michael made landfall near Tyndall Air Force Base in the Florida Panhandle with maximum sustained wind speed of 140 knots (161 mph) and a minimum pressure 919 mb. Based on minimum pressure, Michael is the fourth most-powerful hurricane to hit the United States, behind the Labor Day Hurricane (1935), Hurricane Camille (1969) and Hurricane Andrew (1992), and the most powerful storm to impact the Florida Panhandle in recorded history. The storm caused catastrophic damage from wind and storm surge, particularly in the Panama City Beach to Mexico Beach to Cape San Blas areas. The widespread catastrophic damage spread well inland as Hurricane Michael remained at category 3 strength into southwest Georgia. Early Life Michael originated from an area of enhanced convection associated with a broad area of low pressure that developed in the southwestern Caribbean (approximately 200 miles north of Panama). At that time, the National Hurricane Center (NHC) characterized the system as disorganized and having little convective activity. Although surface pressure was relatively low compared to the systems environment, highly unfavorable upper-level winds hampered the quick development of this storm. During the next two days, convection associated with the tropical disturbance continued to increase and become better organized. As the system moved northwest into the northwestern Caribbean Sea, it produced torrential rainfall and gusty winds across portions of Central America. By 5:00 pm EDT on 6 October satellite imagery and surface observations indicated the low pressure area had become better defined and the convection more organized. NHC issued it’s first advisory on the system, Potential Tropical Cyclone 14, that would eventually become Hurricane Michael. The forecast indicated the development of this storm into a high-end Tropical Storm before landfall (Figure 2). As the system continued to organize, the threat for a potentially dangerous hurricane landfall somewhere along the northeastern Gulf Coast increased. Most operational models used by the NHC (e.g., GFS, UKMET, HWRF, etc.) were in good agreement that the storm would intensify into possibly a category 1 hurricane or stronger before landfall. As a result, the NWS office in Tallahassee began communicating the elevated threat of this system to the northern Gulf of Mexico Coast. The Area Forecast Discussions (AFD) issued on 6 October included entries such as: “probabilities continue to increase that the Gulf Coast will be impacted with a tropical cyclone mid to late week” and urged folks to make sure their hurricane season preparations are in “good shape”. The degree of confidence of the impacts were already being communicated as well: “there is high confidence that at least a tropical storm will be impacting somewhere along the northern Gulf coast during the middle of the week, and hurricane intensity is within the realm of possibilities.” Despite 20 to 30 knots (23 to 35 mph) of westerly wind shear, radar data from Belize and infrared satellite imagery indicated the system had continued to develop through the rest of the day. By 7 October 5:00 am EDT the system was upgraded a Tropical Depression. ASCAT data revealed that low level circulation was becoming better organized and the system was displaying maximum winds of up to 35 knots (40 mph). Only 8 hours after becoming a depression, the NHC upgraded the system to Tropical Storm Michael. Tropical storm force winds and torrential downpours were affecting portions of coastal east-central Yucatan Peninsula. Michael was showing no signs of weakening as confidence of an impact somewhere along the Florida Big Bend and/or Panhandle increased as seen in Figure 3. Intensification Period On 8 October at 11 AM EDT (two days prior to landfall) the NHC upgraded Michael to category 1 status and issued a Hurricane Watch for the entire Florida Big Bend and Panhandle coastline. From this point on, Michael was on a fast-track to becoming a major hurricane as it headed generally north across the eastern Gulf of Mexico. Favorable conditions including anomalously warm sea-surface temperatures, weakening environmental shear, and abundant atmospheric moisture all played a major role during its quick intensification. In less than 48 hours Michael deepened from a Category 1 to a high-end Category 4 on 10 October at 2 AM EDT. Table 1 summarizes the quick spin-up of the storm during this time. Two large-scale atmospheric features paved the way for this system as it moved towards the Panhandle. Early on, a large ridge of high pressure which was located over much of the Eastern seaboard created a southerly to southeasterly flow which forced Michael in a general NWN to NW direction. By 9 October (~24 hours prior to landfall) a large-scale mid-latitude trough of low pressure nosed its way east across the Continental U.S. The southwesterly flow around the eastern edge of the trough eventually steered Michael northeast and towards the Panama City / Mexico Beach area. In general, the system moved at a steady 11 mph across the Gulf of Mexico. The shift in Michael's path from a northwesterly to northeasterly direction can be depicted in Figure 4. As mentioned earlier, this storm fell nothing short of extraordinary when it came to intensification. Throughout the day on 8 October, Michael continued to become more organized on satellite imagery. This was in part due to the weakening of an upper-level shortwave trough which was located just northwest of the storm. As the trough weakened, vertical wind shear values began to decrease and allowed the storm to become more vertically stacked. With virtually no other environmental factors impeding the development of this system Michael underwent rapid intensification. Possibly the biggest environmental factor favoring its rapid intensification were the very warm Gulf waters ahead of the storm. A month before the formation of Michael, Florida experienced its warmest September (statewide average) on record as determined by the National Center for Environmental Information. Consequently, sea surface temperatures (SSTs) reached anomalously warm values of around 2 – 4 ⁰F (1 – 2 ⁰C) above average. This left Michael with an important energy reservoir to tap into as it moved across the Gulf of Mexico. Anomalously warm SSTs ahead of Michael's path are depicted in Figure 5. Another environmental factor that potentially helped Michael intensify rapidly may be attributed to the upper level trough that steered the storm NW just before landfall. Usually, mid-latitude systems such as troughs bring very unfavorable environmental conditions for tropical cyclones (i.e., strong upper-level shear). However, research has shown that in particular cases these systems can provide upper-level divergence. This divergence aloft acts as a means of ventilation which favors air to exit and flow away from the top of a hurricane. This in turn favors a convective feedback processes which help storms deepen and intensify. Figure 6 depicts the rapid intensification of Michael as it approached landfall. Organization of the eyewall and clearing within the eye are representative of storm intensification. Landfall Michael made landfall along the Florida Panhandle near Tyndall Air Force Base (AFB) around 1:30 pm EDT (12:30 pm CDT) on Wednesday, October 10, 2018 as a category 5 hurricane, with maximum sustained wind speeds of 140 knots (161 mph) and a minimum central pressure of 919 millibars (mb) . Both Air Force Reserve Hurricane Hunter Aircraft and NWS WSR-88D radar data showed that Michael was still intensifying upon landfall. The Hurricane Hunters estimated a 700mb (approximately 8,000 feet) flight-level peak wind of 152 kts (when wind speeds are adjusted from flight-level to surface-level, this is around 137 knots) on their final pass through the storm at 1:23 pm EDT (12:23 pm CDT). At the surface, a peak wind gust of 139 mph was measured at Tyndall AFB before the sensor failed. In response to these strong winds, the NWS office in Tallahassee issued its first ever Extreme Wind Warning (EWW), a warning that is very rarely used within the NWS. The warning was issued at 11:11 am EDT and encompassed the entirety of Gulf County, Southern Bay County, and Southwestern Franklin County. Shortly after, three more EWWs were issued as the storm progressed inland. Even counties such as Seminole in Georgia and Houston in Alabama had EWWs. EWWs so far inland were warranted given that Michael remained a strong hurricane as it tracked inland. The eye crossed into Seminole County, GA, around 6:00 pm EDT as a category 3 hurricane, traveling forward at 13 mph with maximum sustained wind speeds of 115 mph. It weakened to a Category 2 hurricane by 7:00 pm EDT as it traveled across southern Georgia, with maximum sustained wind speeds of 100 mph. Michael became a tropical storm around 12:00 am EDT on October 11, with the eye located over central Georgia. With the catastrophic winds tracking well inland, the strong winds were observed well into Georgia. Donaldsonville, GA which is located approximately 80 mi from the location of landfall, experienced a gust of 115 mph. It is very rare to see storms maintain their intensity this well so far inland. Hurricane Michael was truly a unique event. Since 1851, and prior to Hurricane Michael, only nine major hurricanes have made landfall over the Florida Panhandle (Figure 10). Michael, as it stands now, is the most powerful storm to impact the Florida Panhandle in recorded history. Storm Surge Hurricane Michael brought catastrophic storm surge to the Florida Panhandle and Big Bend areas. One of the hardest hit locations was from Mexico Beach to Indian Pass where 9 to 14 feet of peak storm surge inundation was observed. In addition, wave action caused even higher total water values and this resulted in waves destroying the second story of multiple buildings in Mexico Beach. At St. Joseph Peninsula State Park on Cape San Blas, the storm surge cut through the peninsula, creating two inlets, resulting in portions of the park no longer being accessible by vehicle. These new inlets truly demonstrate the power of storm surge. While preliminary peak storm surge inundation was slightly less east of Indian Pass, values were still life-threatening and caused significant damage. Along the coast, portions of U.S. 98 and Alligator Drive were washed out and had to be patched/repaved. In Carrabelle, water was high enough to enter a restaurant, resulting in damage to furniture. In addition, numerous homes along the coast were destroyed or damaged as water slammed against the structures. Wind In addition to the life-threatening storm surge, structural damage was extensive, particularly across the Florida Panhandle. Preliminary data assessments indicate almost 50,000 structures were affected across the Florida Panhandle, western Big Bend, southwest Georgia and southeast Alabama. Of these, more than 3,000 structures were destroyed. Homes and businesses were not the only structures impacted. The Hurricane Michael Preliminary Virtual Assessment Team (P-VAT) report from the Structural Extreme Event Reconnaissance Network indicated that two hospitals in Bay County, Bay Medical Sacred Heart and Gulf Coast Regional Medical Center also sustained significant damage. One hospital had glass crack and cladding stripped off the building while the other hospital had issues with power and water. Tyndall Air Force Base (AFB), that experienced the eye of Hurricane Michael, experienced catastrophic damage with every building on base experiencing some roof damage. A nearby elementary school had a portion of its roof ripped off. During the height of the storm, before the transmission stopped, a sensor at Tyndall AFB measured a gust to 139 mph. The wind damage was not confined to the coastline, but extended well inland. In Marianna, businesses lost their roofs and the exterior wall of some buildings collapsed as the roof was lost. In Donalsonville, GA, where a 115mph gust was measured, roof damage was also observed and at least one silo was flipped over. Even in Albany, GA, signs were blown down and roofs were peeled off buildings. In addition to extensive structural damage, hurricane force winds caused widespread power outages across a large portion of the tri-state region. Nearly 100% of customers across a large portion of the Florida Panhandle lost power, with some of these outages lasting weeks. These widespread power outages extended into southwest Georgia with 100% of customers losing power all the way up to Lee County, GA! The catastrophic winds also resulted in damage to the timber and agricultural communities across Florida and Georgia. According to the Florida Forest Service, in Florida, timber damage costs estimates were over $1.2 billion dollars with almost 3 million acres of forested land damaged. In addition to damage costs, replanting in the more severely damaged areas could be an addition $240 million. This damage also has impacts to the wildfire potential with additional forest fuels from downed trees. More on the timber impacts in Florida can be found in the Florida Forest Service report. The catastrophic timber loss was not confined to Florida, but in fact, extended into Georgia where across the state of Georgia, 2,368,226 acres of forestland was impacted by Hurricane Michael. The estimated value of this land is $762,683,909. Catastrophic damage was mainly confined to Seminole, Decatur and Miller Counties with severe damage extending into Dougherty and Terrell Counties. More on the timber impacts in Georgia can be found from the Georgia Forestry Commission. Inland Flooding Inland flooding associated with Hurricane Michael across the tri-state region was limited as the hurricane quickly tracked across the area. A maximum rainfall total of 6.84 inches was observed near Crossroads, GA (Quitman County) with the second highest amount for the region recorded in Calhoun County, FL with 6.66 inches. With these higher rainfall amounts isolated, only a few areas of inland flooding were observed. In Bay County, record flooding was observed on the Econfina Creek at State Road 20 with 26.17 feet (NAVD88). This resulted in the SR-20 bridge being overtopped. In addition, in Calhoun County, FL, moderate flooding occurred on the Chipola River near Altha. A few homes were impacted downstream from the gauge and significant damage was sustained to the fish camps along the river. Tornadoes There were no recorded tornadoes across the Florida Panhandle, Big Bend, southwest Georgia or southeast Alabama associated with Hurricane Michael. Fatalities Eight direct fatalities were reported in the tri-state area, 7 in Florida and 1 in Georgia. Five of these deaths were due to storm surge and three were attributed to wind. In addition, there were 43 indirect deaths associated with Hurricane Michael. Post-Tropical Cyclone Report The Post-Tropical Cyclone Report for Hurricane Michael is available here. This report provides details regarding the impacts of Hurricane Michael. Radar Imagery Radar imagery courtesy of Brian McNoldy, University of Miami, Rosenstiel School Satellite Imagery 360 Degree Views of Mexico Beach Imagery courtesy of FSU Center for Disaster Risk Policy Video Footage Structural Extreme Event Reconnaissance Network Reports (StEER)
Overview
Storm History
Impacts
Social Media
Pictures
Additional Info
Statistics from Hurricane Michael
Visible Satellite Loop of Hurricane Michael
Courtesy of Rick Kohrs (UW/SEEC)
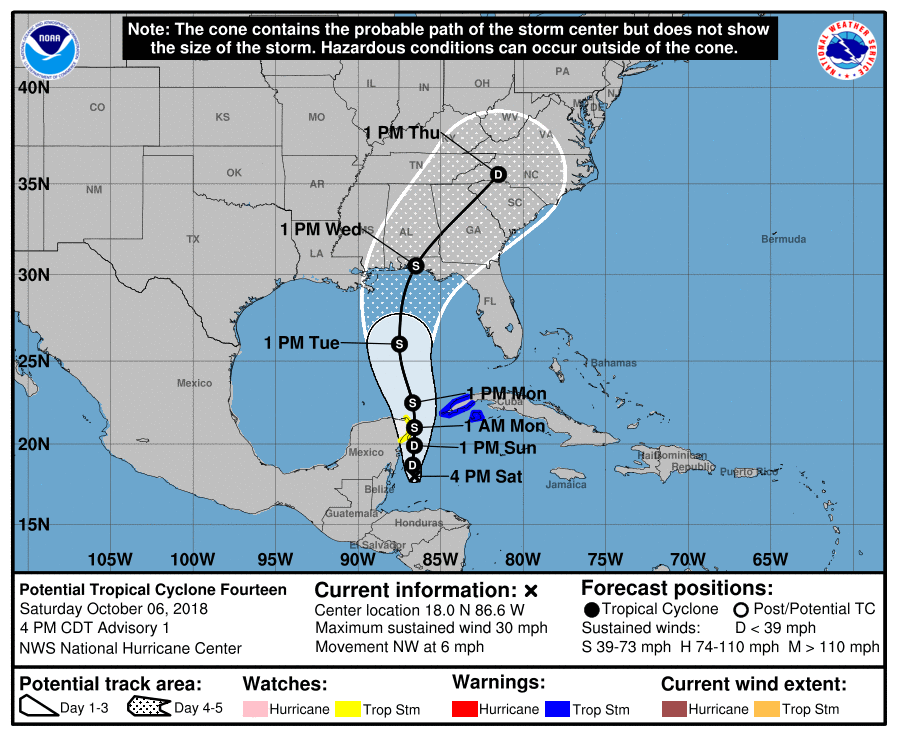
Figure 2: Track forecast as indicated from the first advisory issued on Hurricane Michael
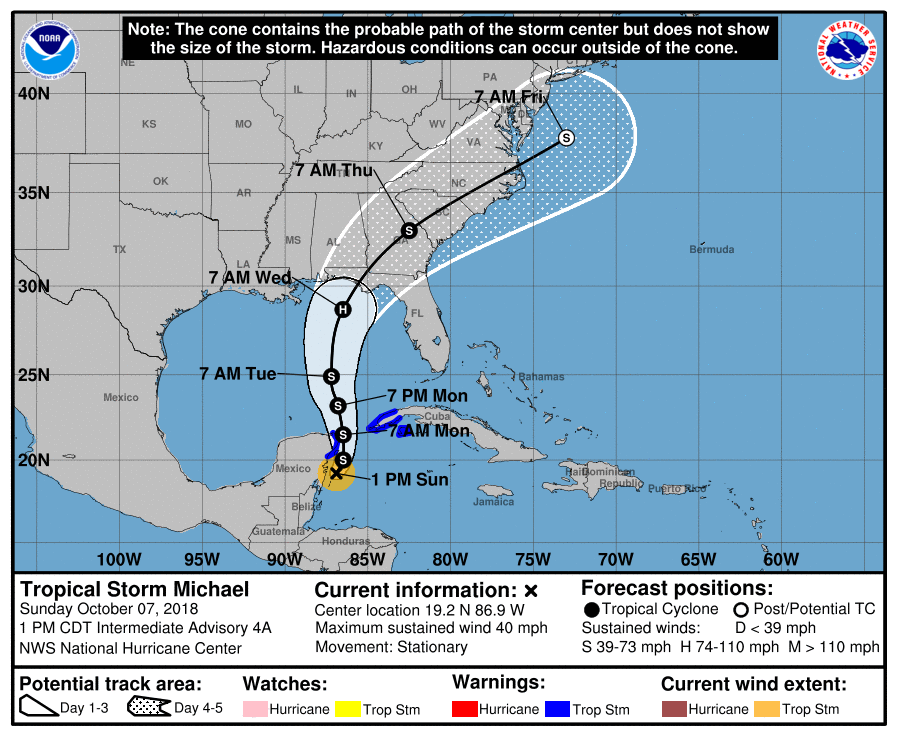
Figure 3: Track forecast issued at 2pm 7 October as Michael became a Tropical Storm
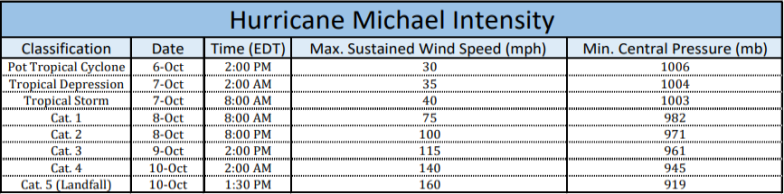
Table 1: Hurricane Michael intensification chart
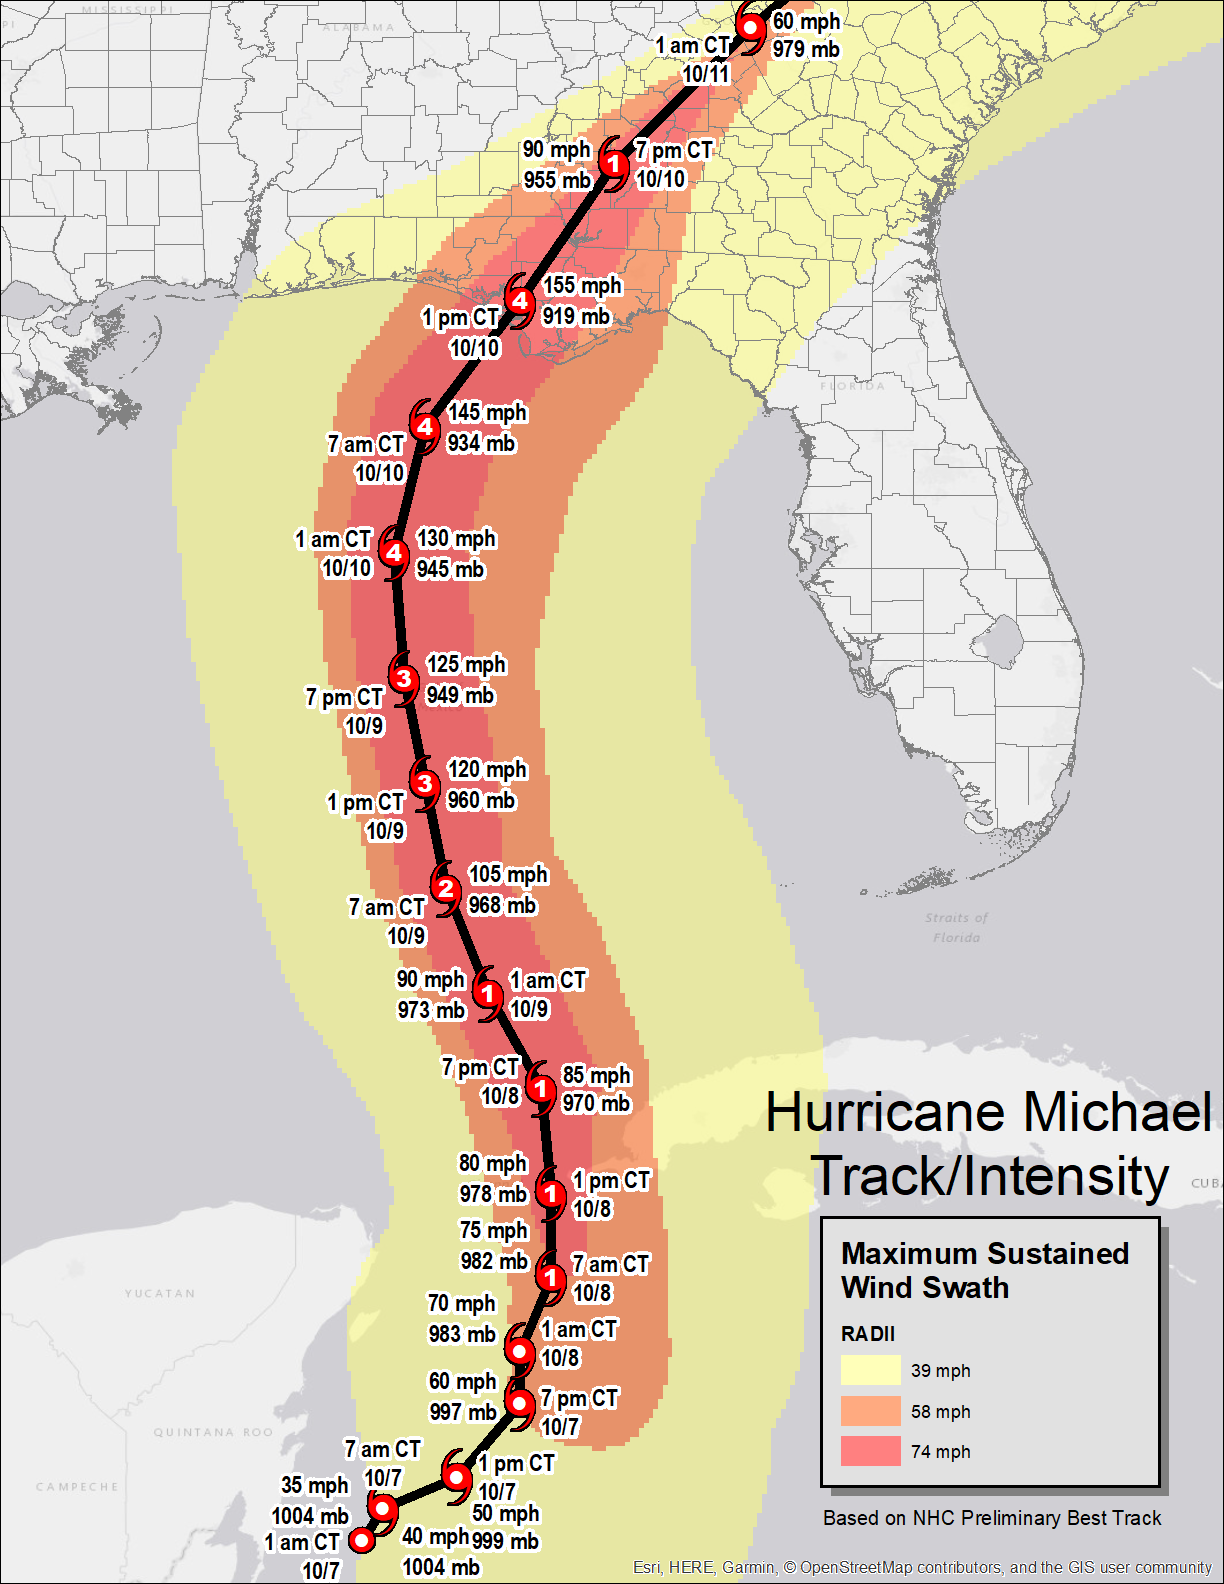
Figure 4: Preliminary track and intensity of Hurricane Michael
Figure 5: 8 October 2018 sea surface temperature anomalies as measured by NOAA NESDIS satellite
Figure 6: Infrared satellite imagery of Hurricane Michael as it tracks towards the Florida Panhandle
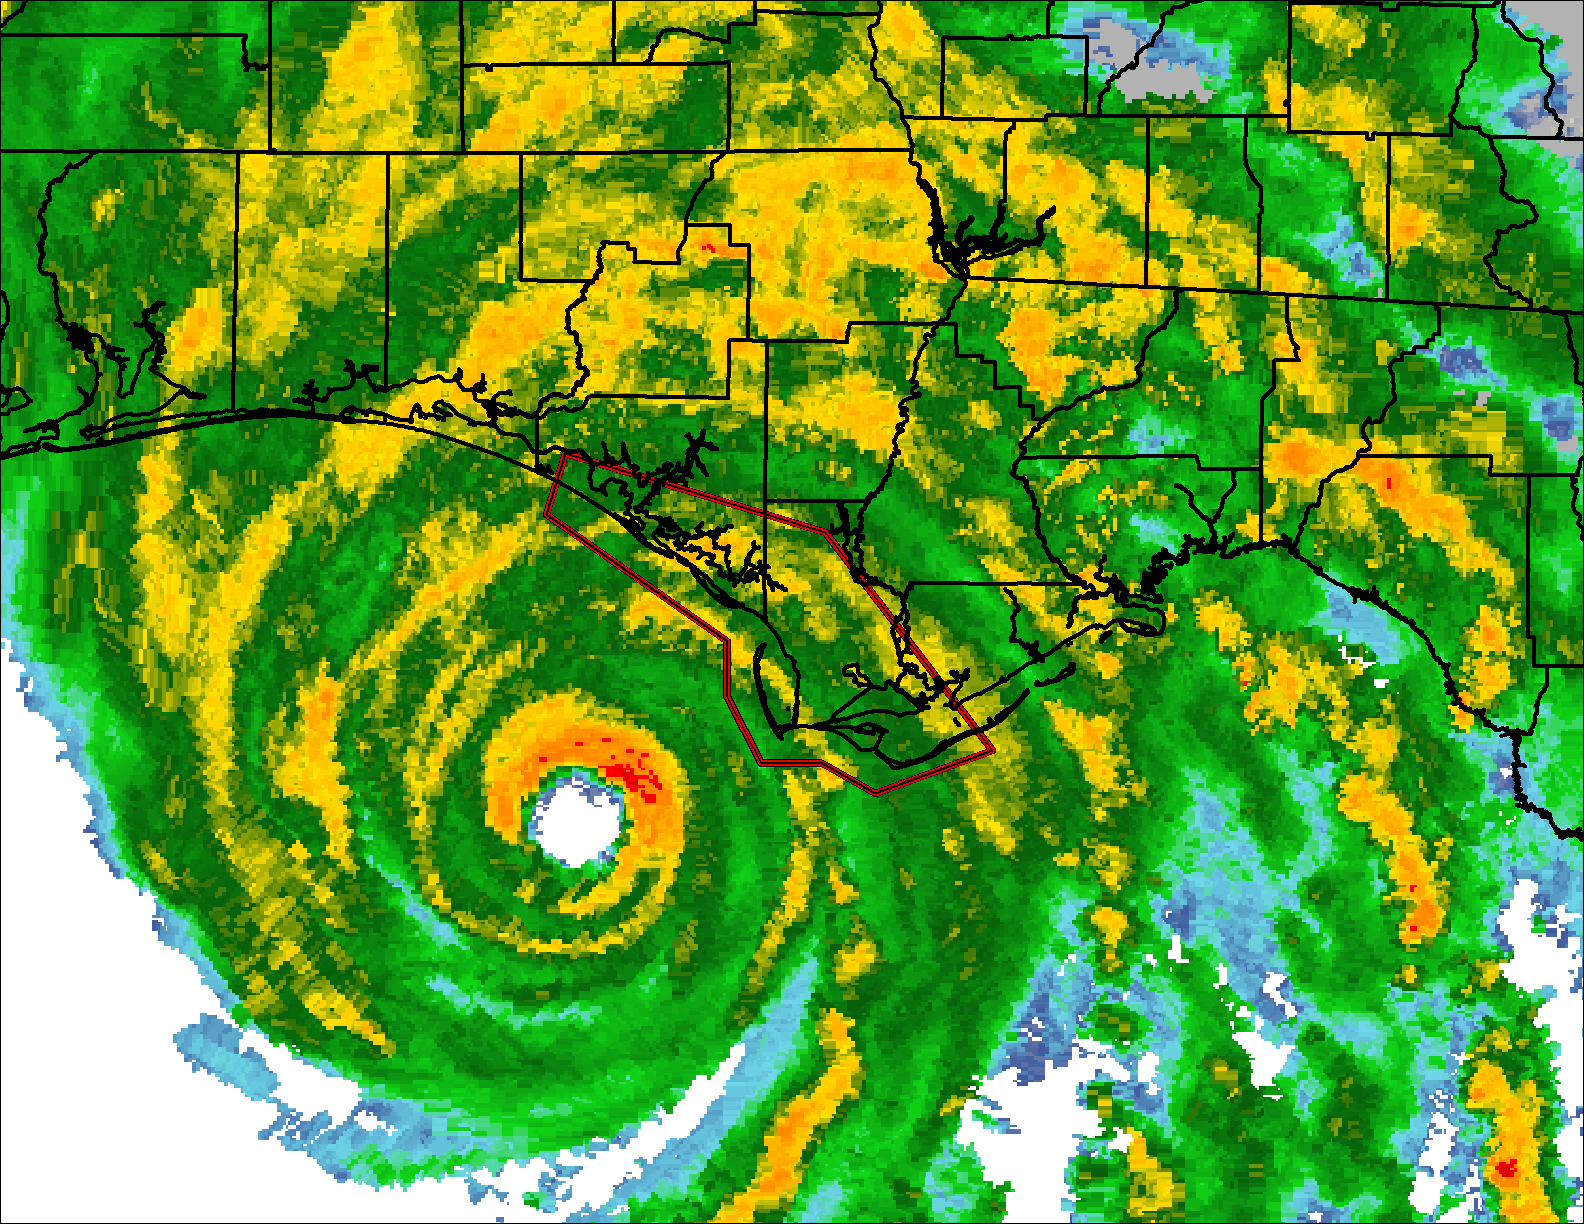
Figure 7: Visible satellite imagery of Hurricane Michael as the storm makes landfall near Mexico Beach, FL
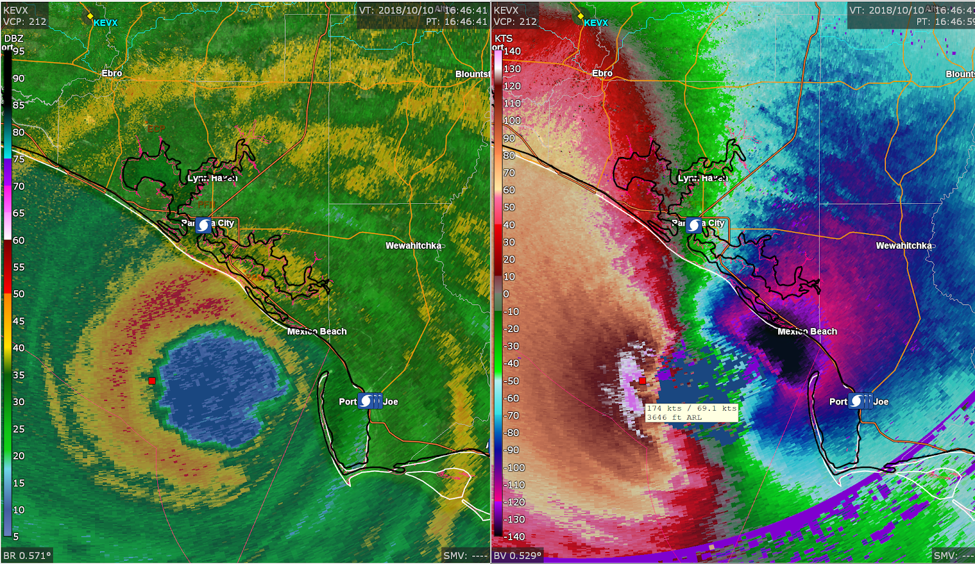
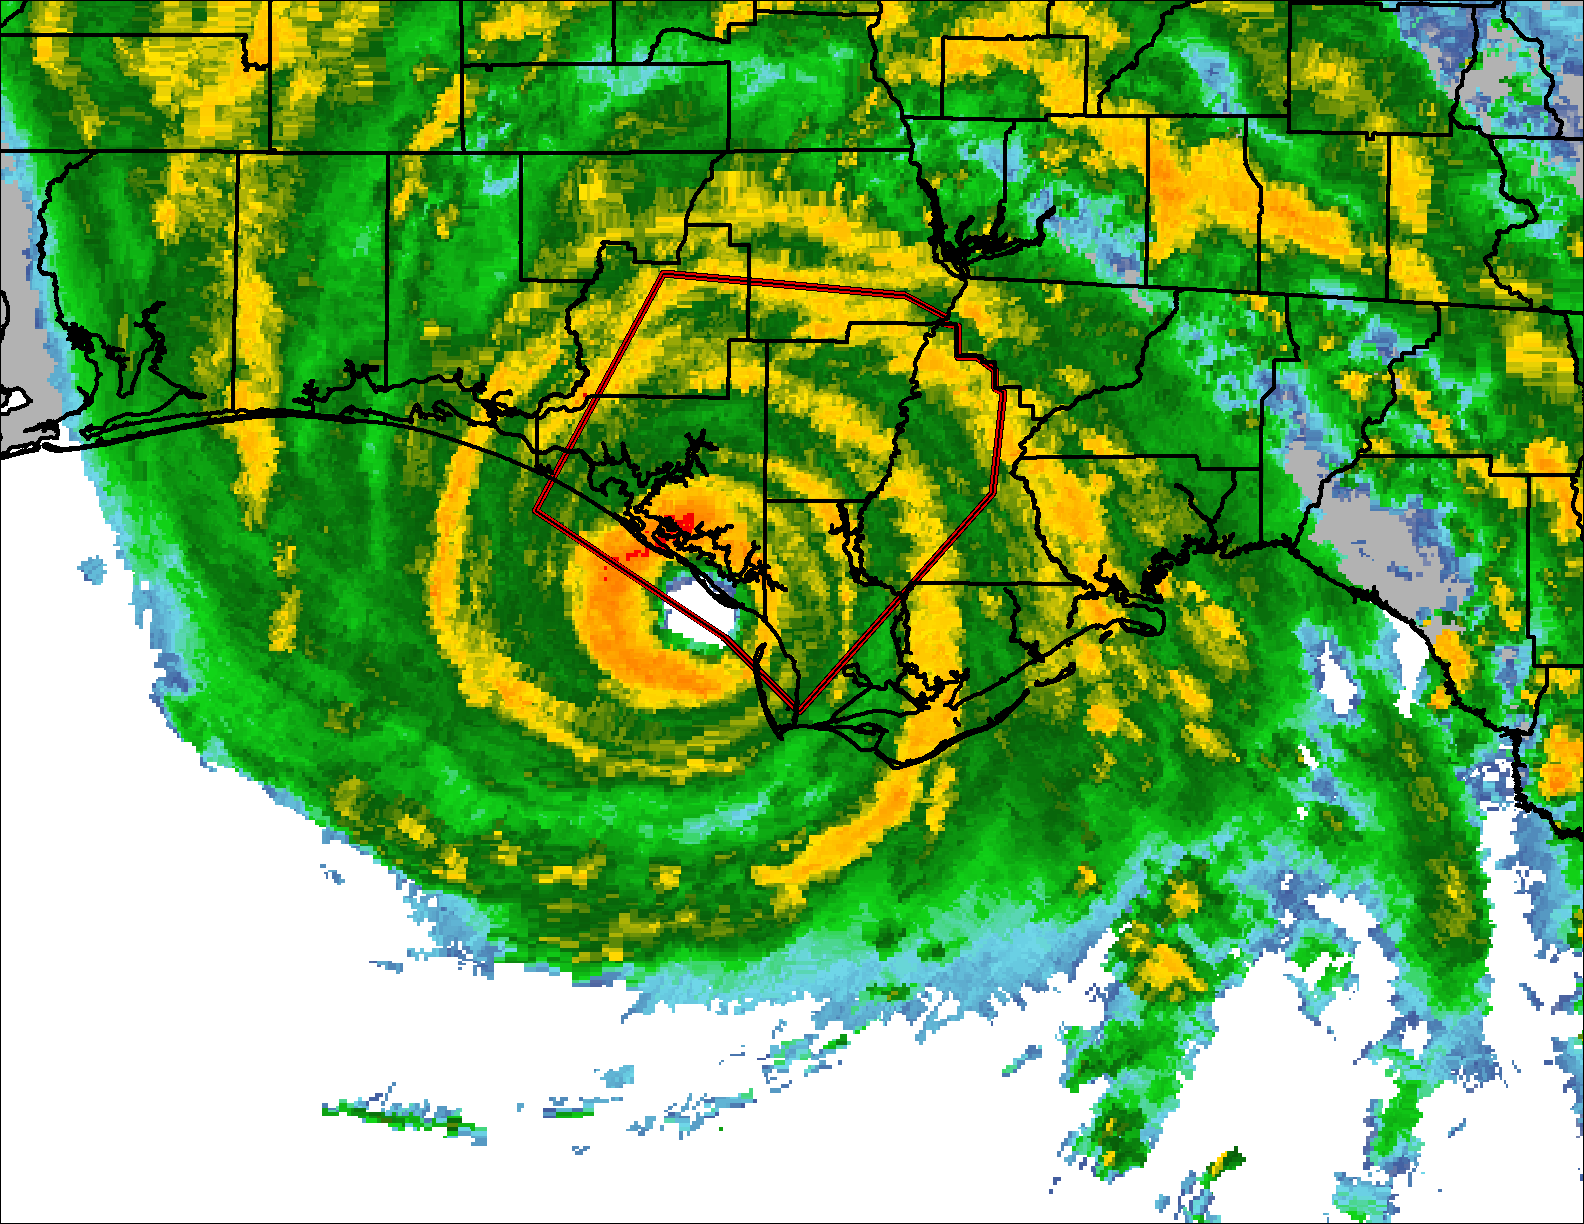
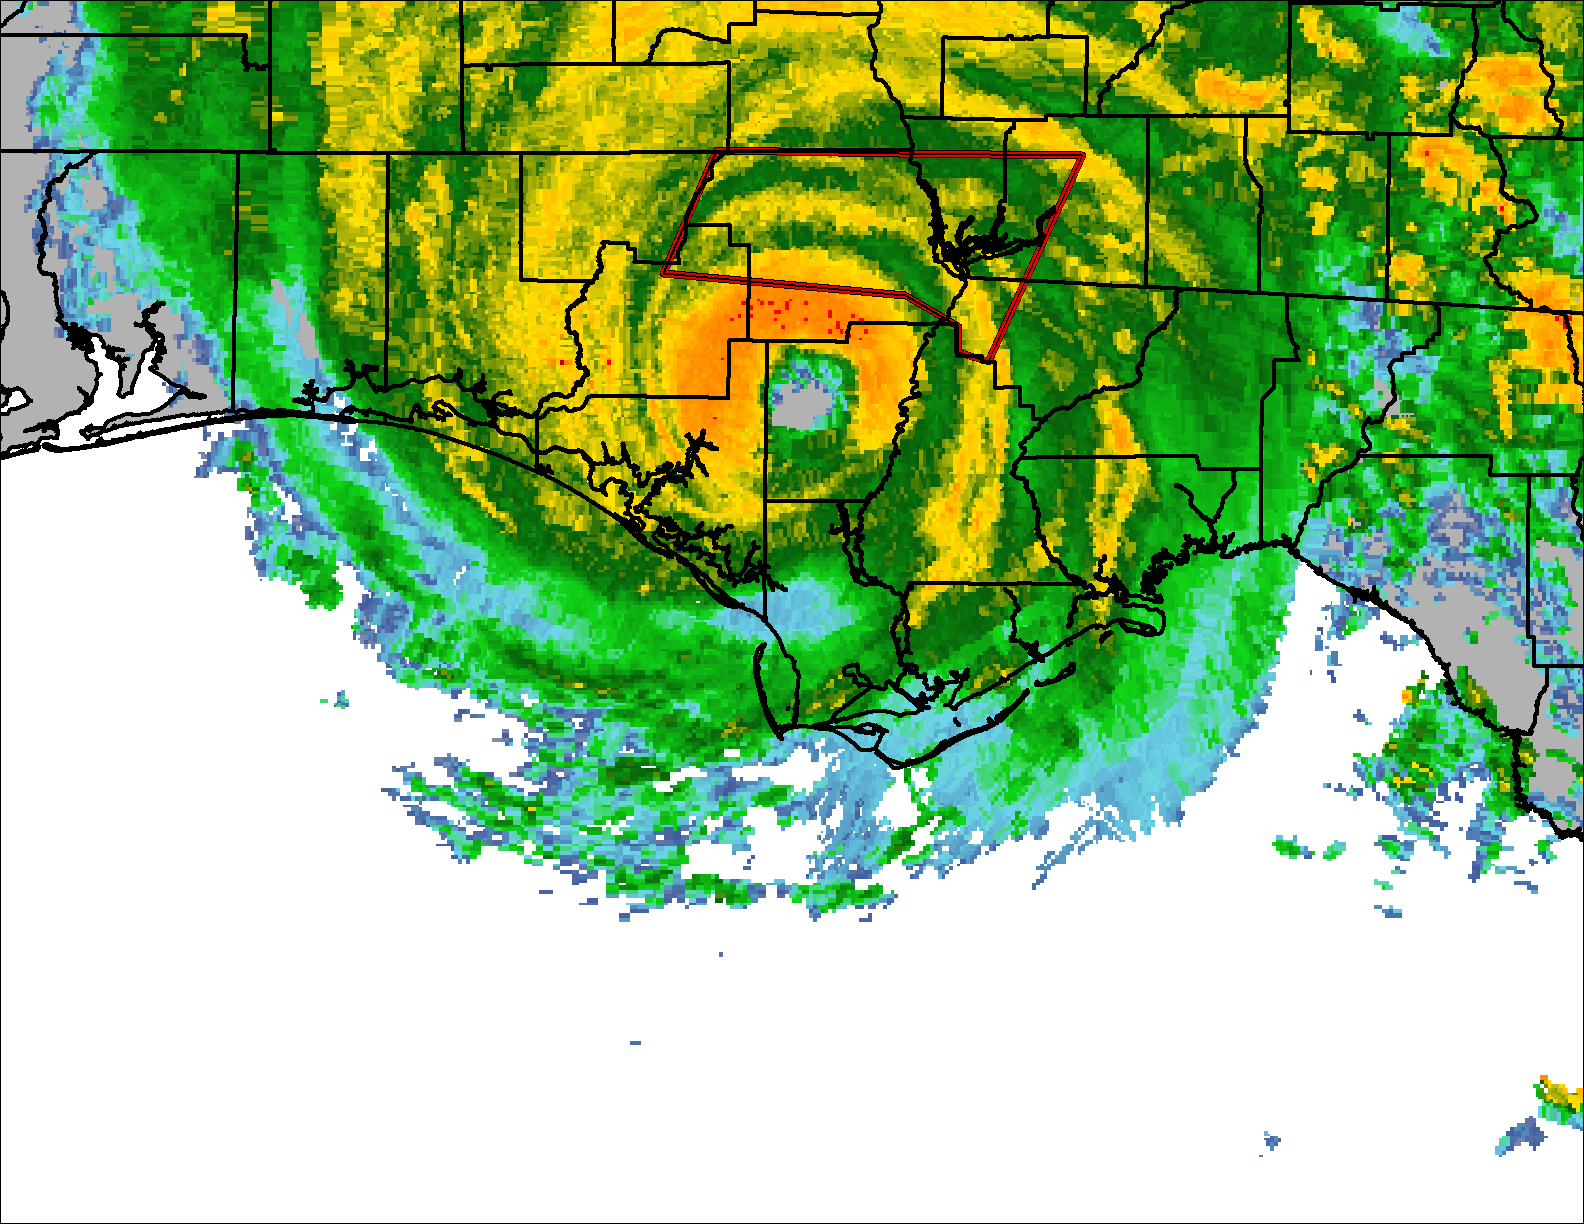
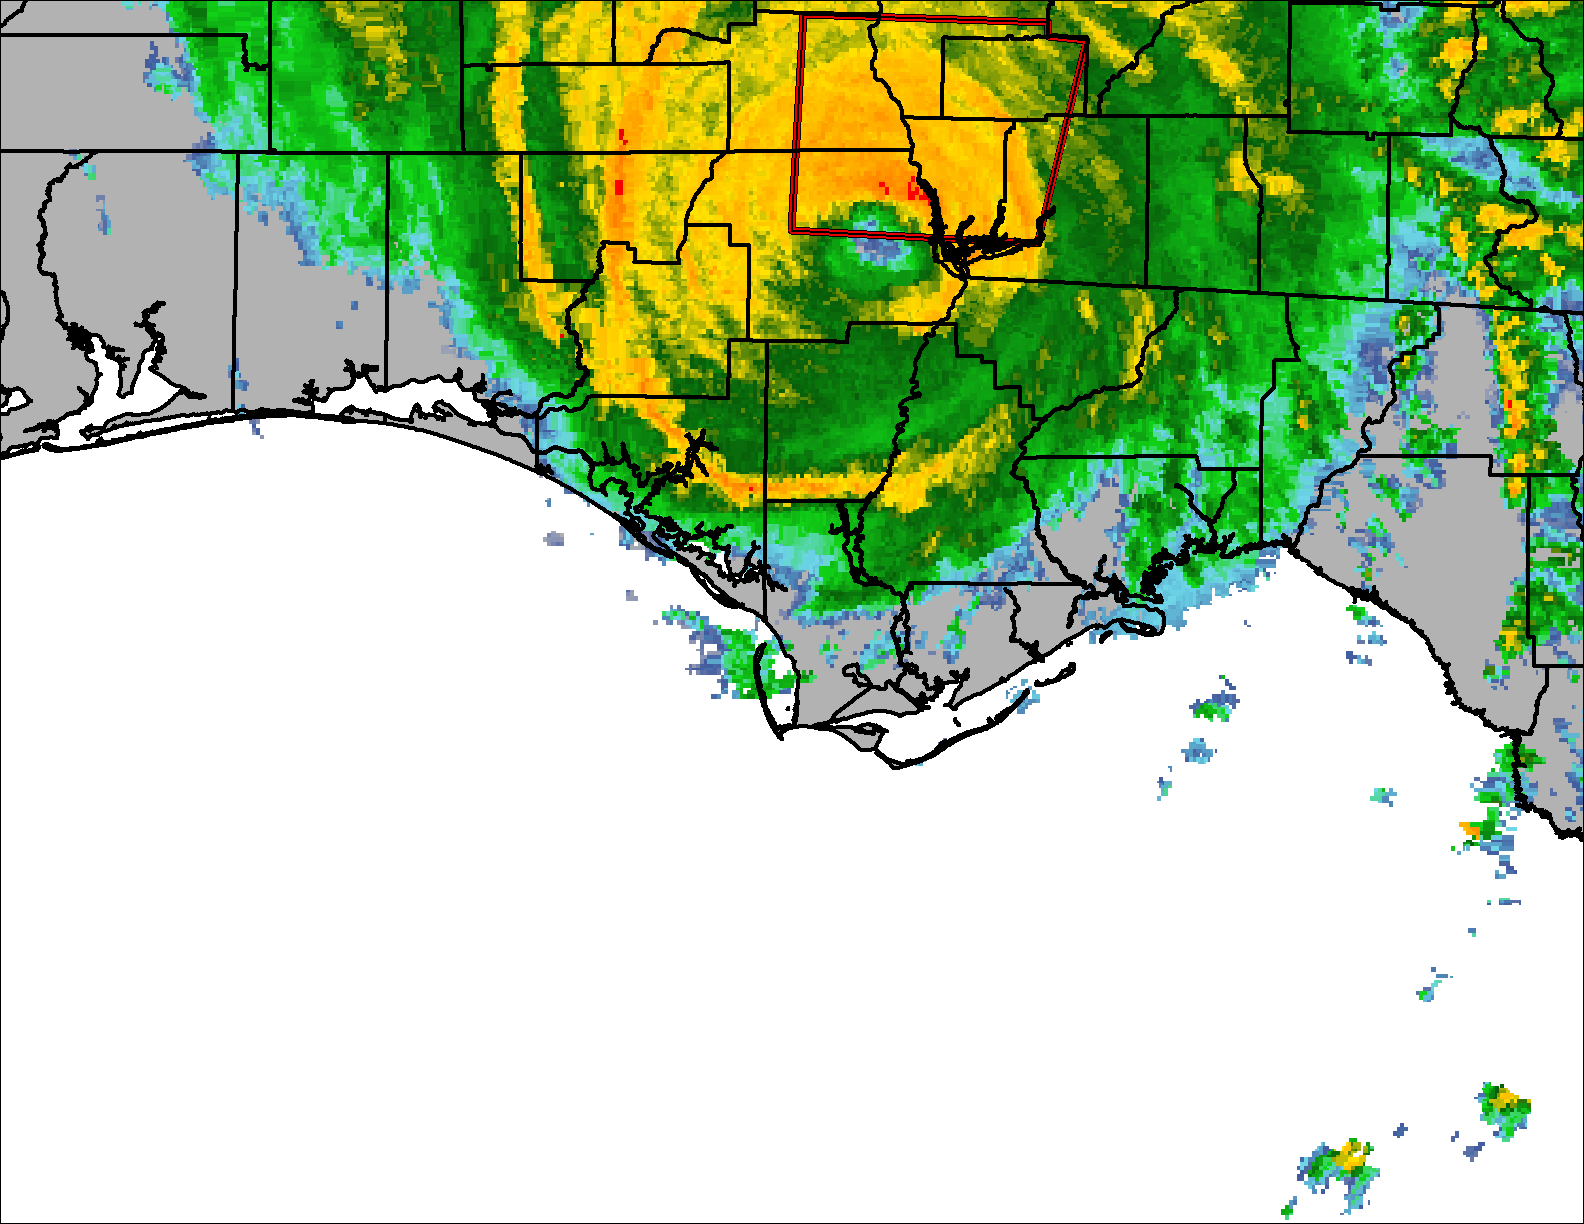
Figure 8: KEOX radar reflectivity (left) and velocity (right) of Hurricane Michael's eye as the storm made landfall
10:11 CDT
12:15 CDT
2:09 CDT
3:40 CDT
Figure 9: Extreme Wind Warnings
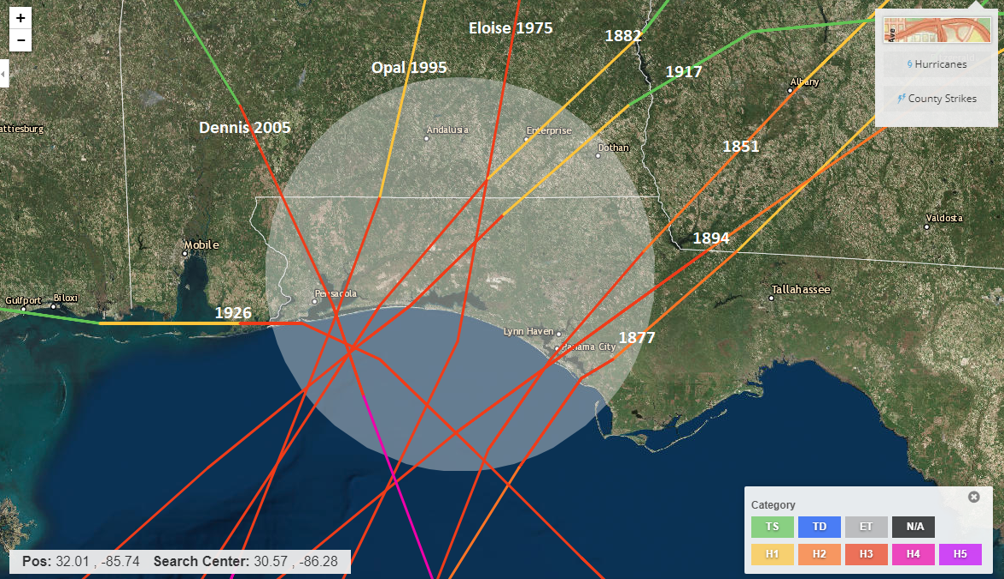
Figure 10: Graphic depicting all tropical cyclones (category 3 or higher) to have made landfall over the Florida Panhandle before Hurricane Michael
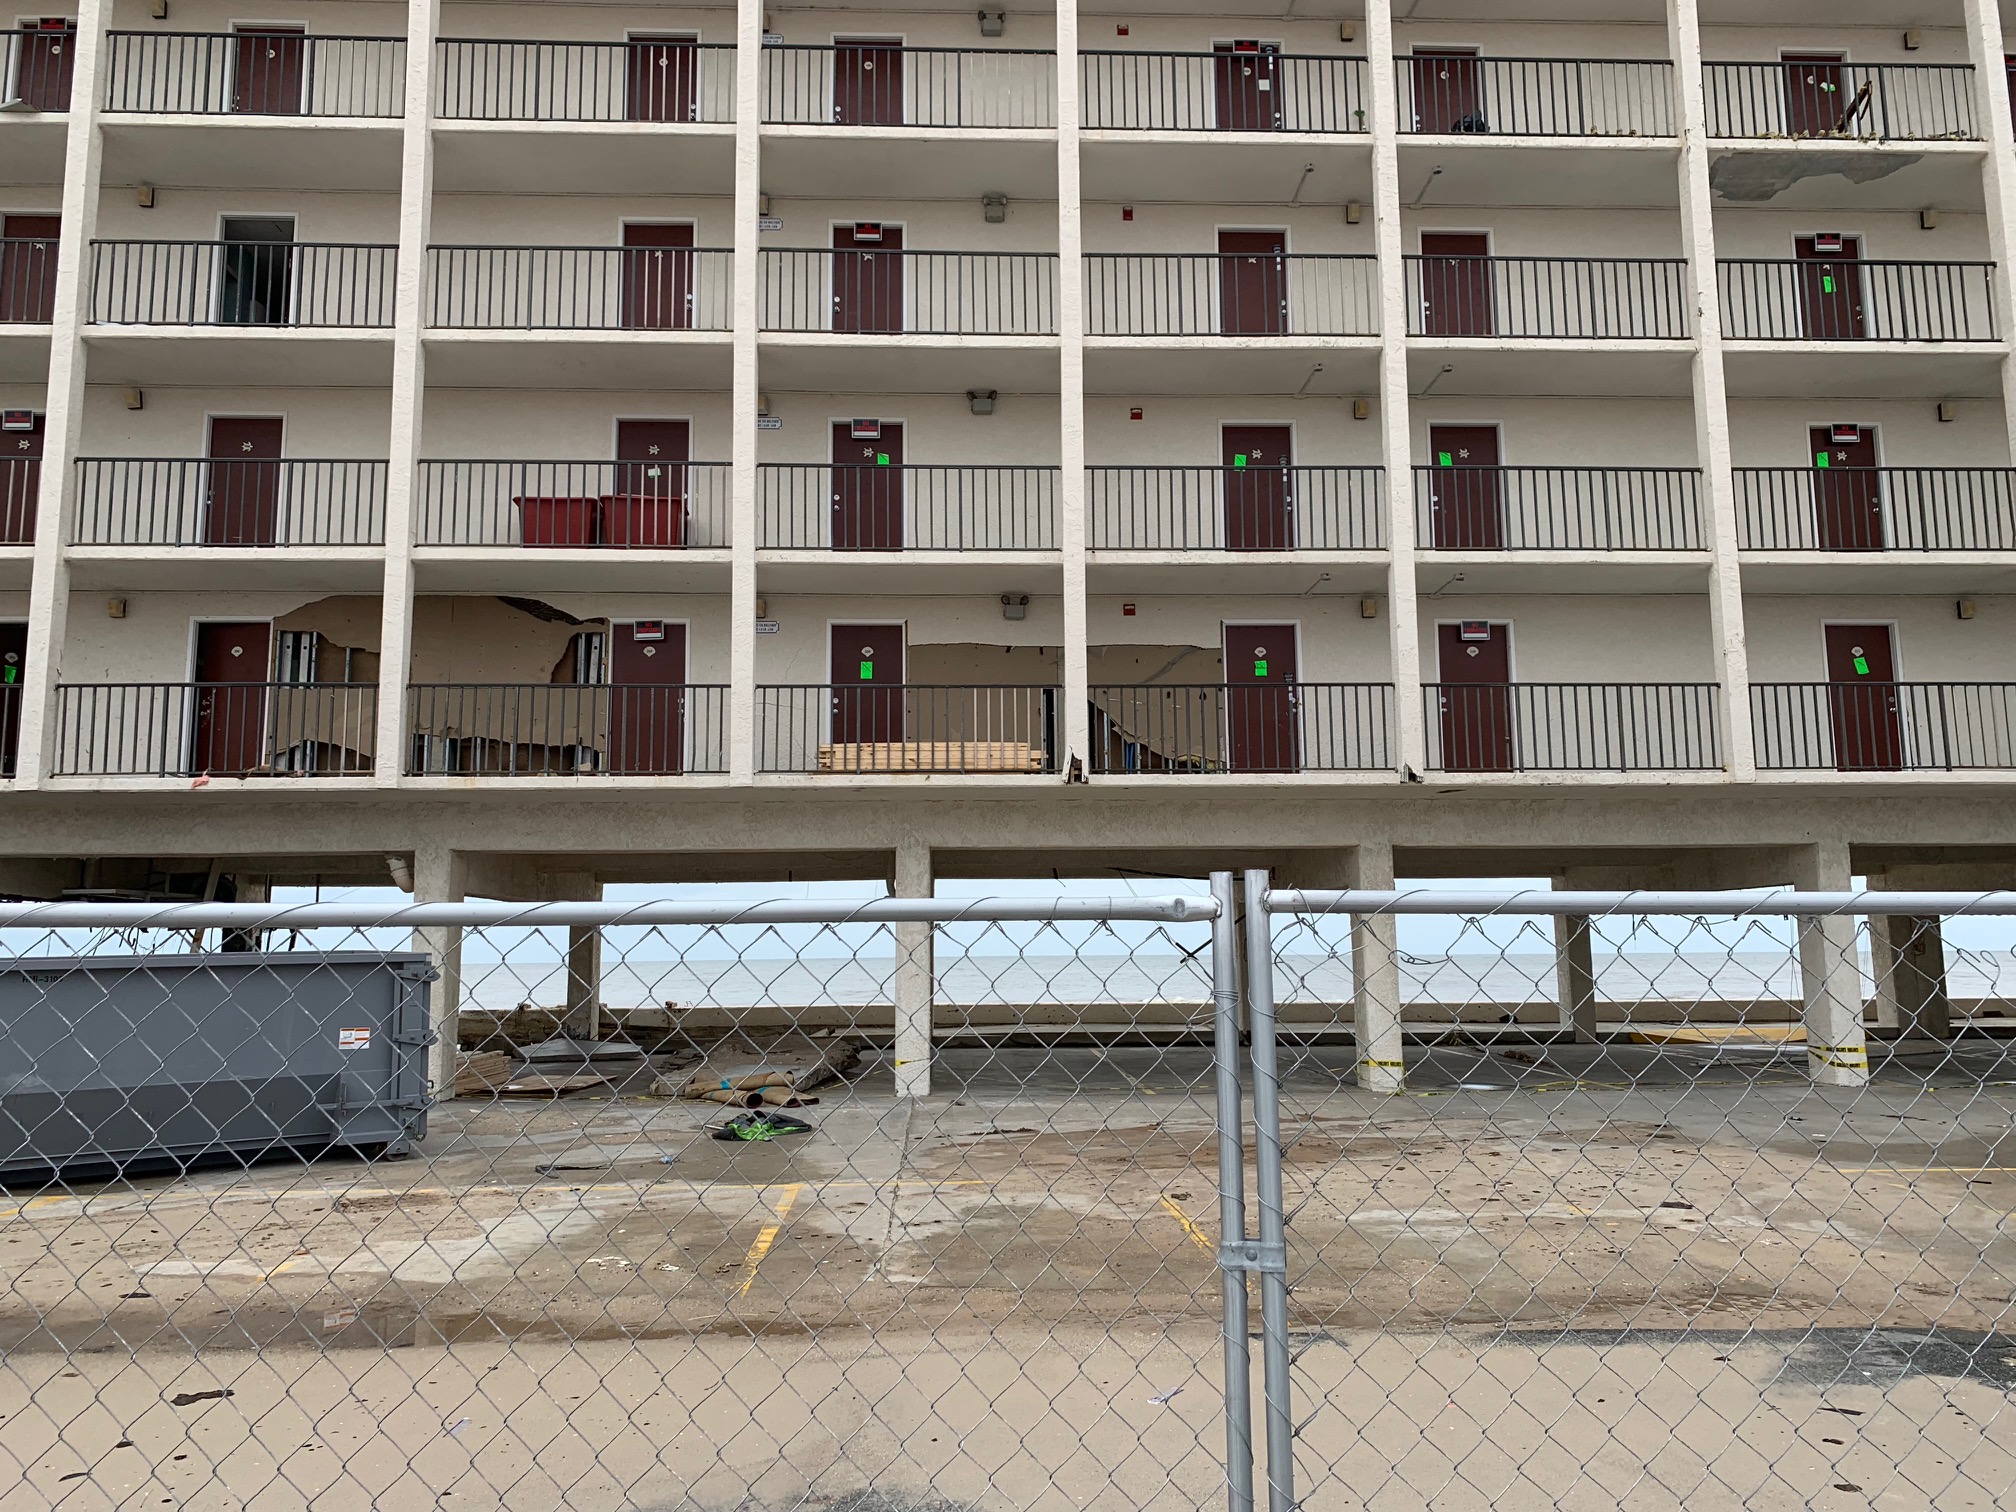
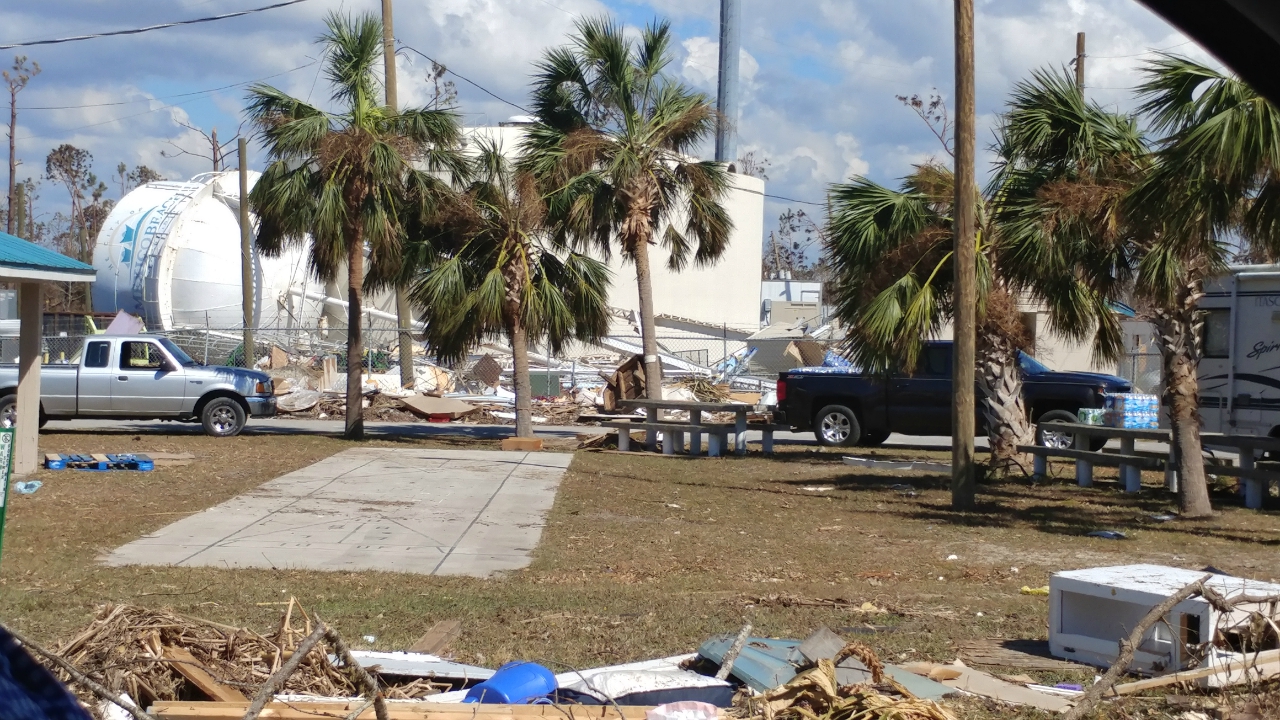
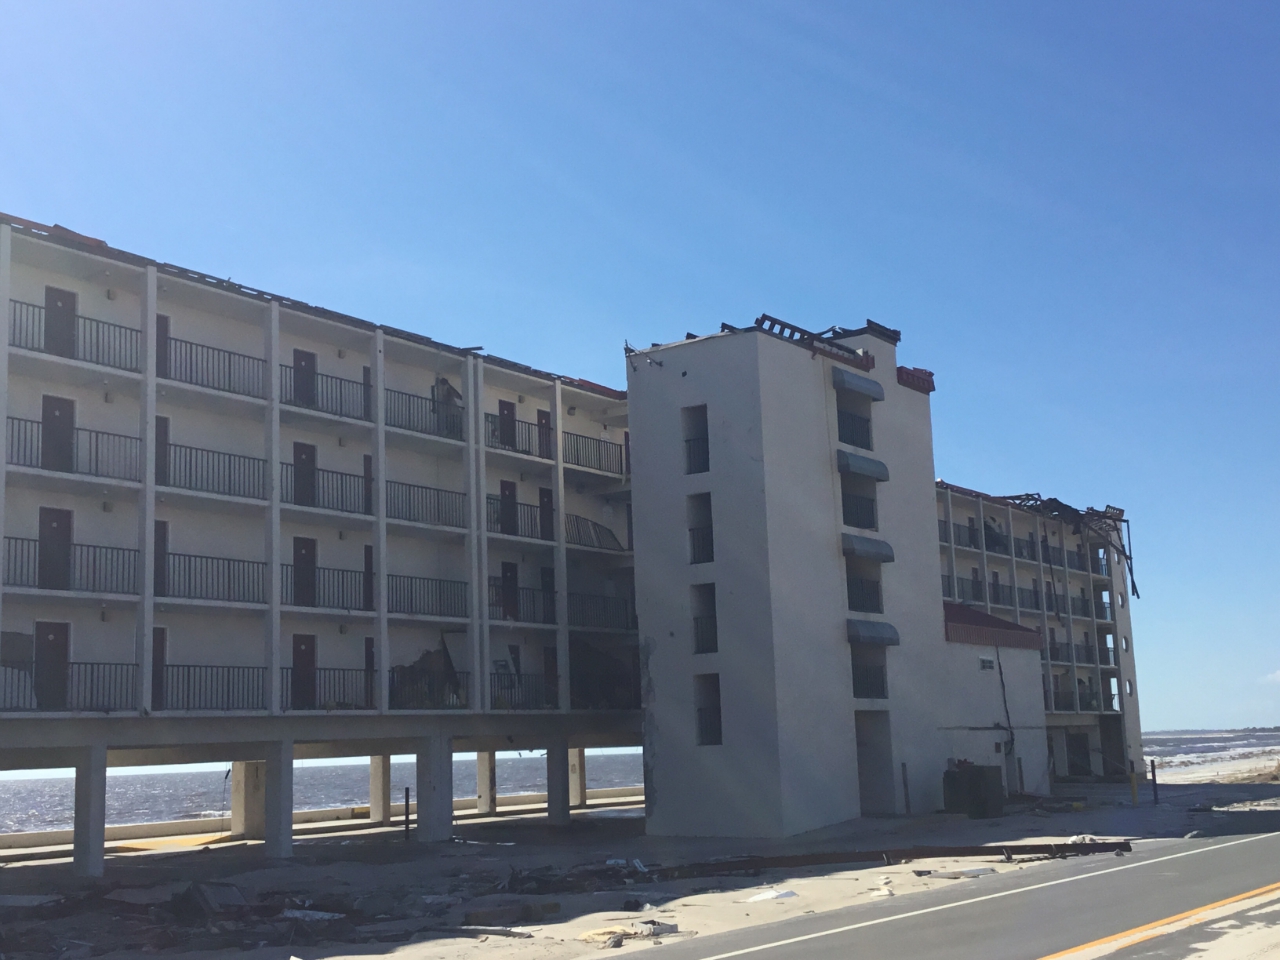
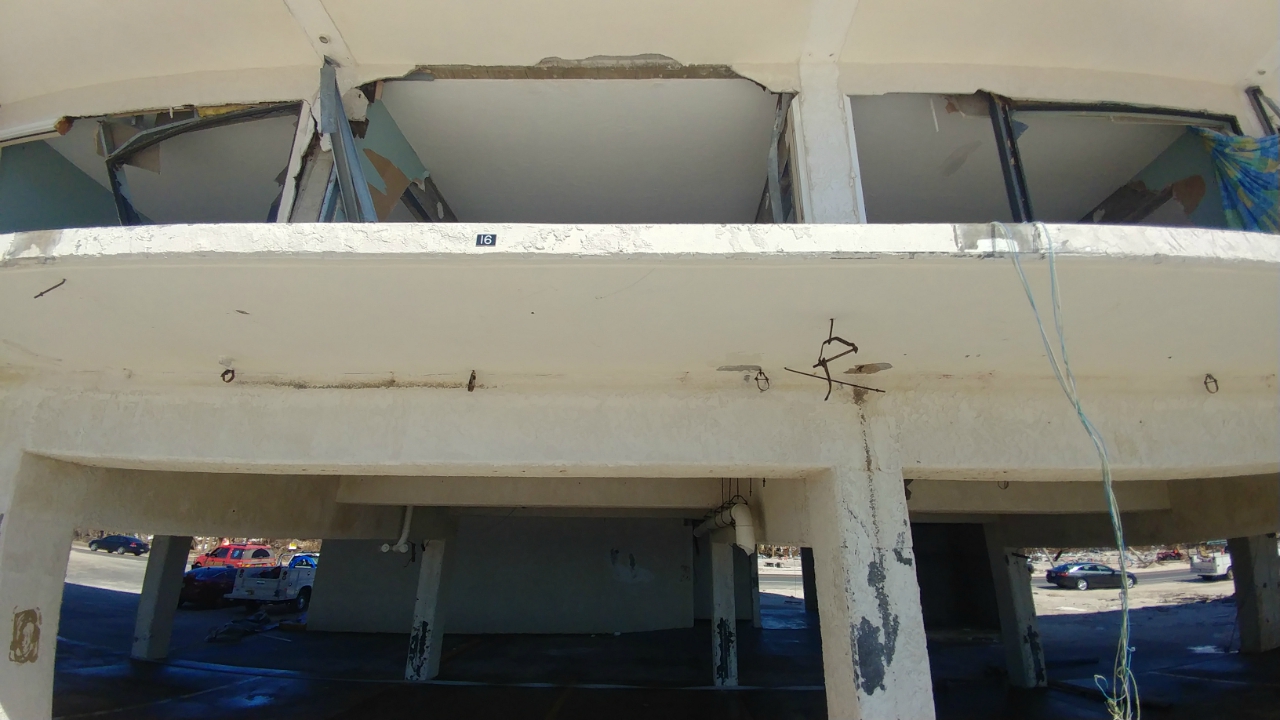
El Governor Hotel in Mexico Beach - Waves destroyed second story rooms
Storm surge and waves destroyed the El Governor RV Park
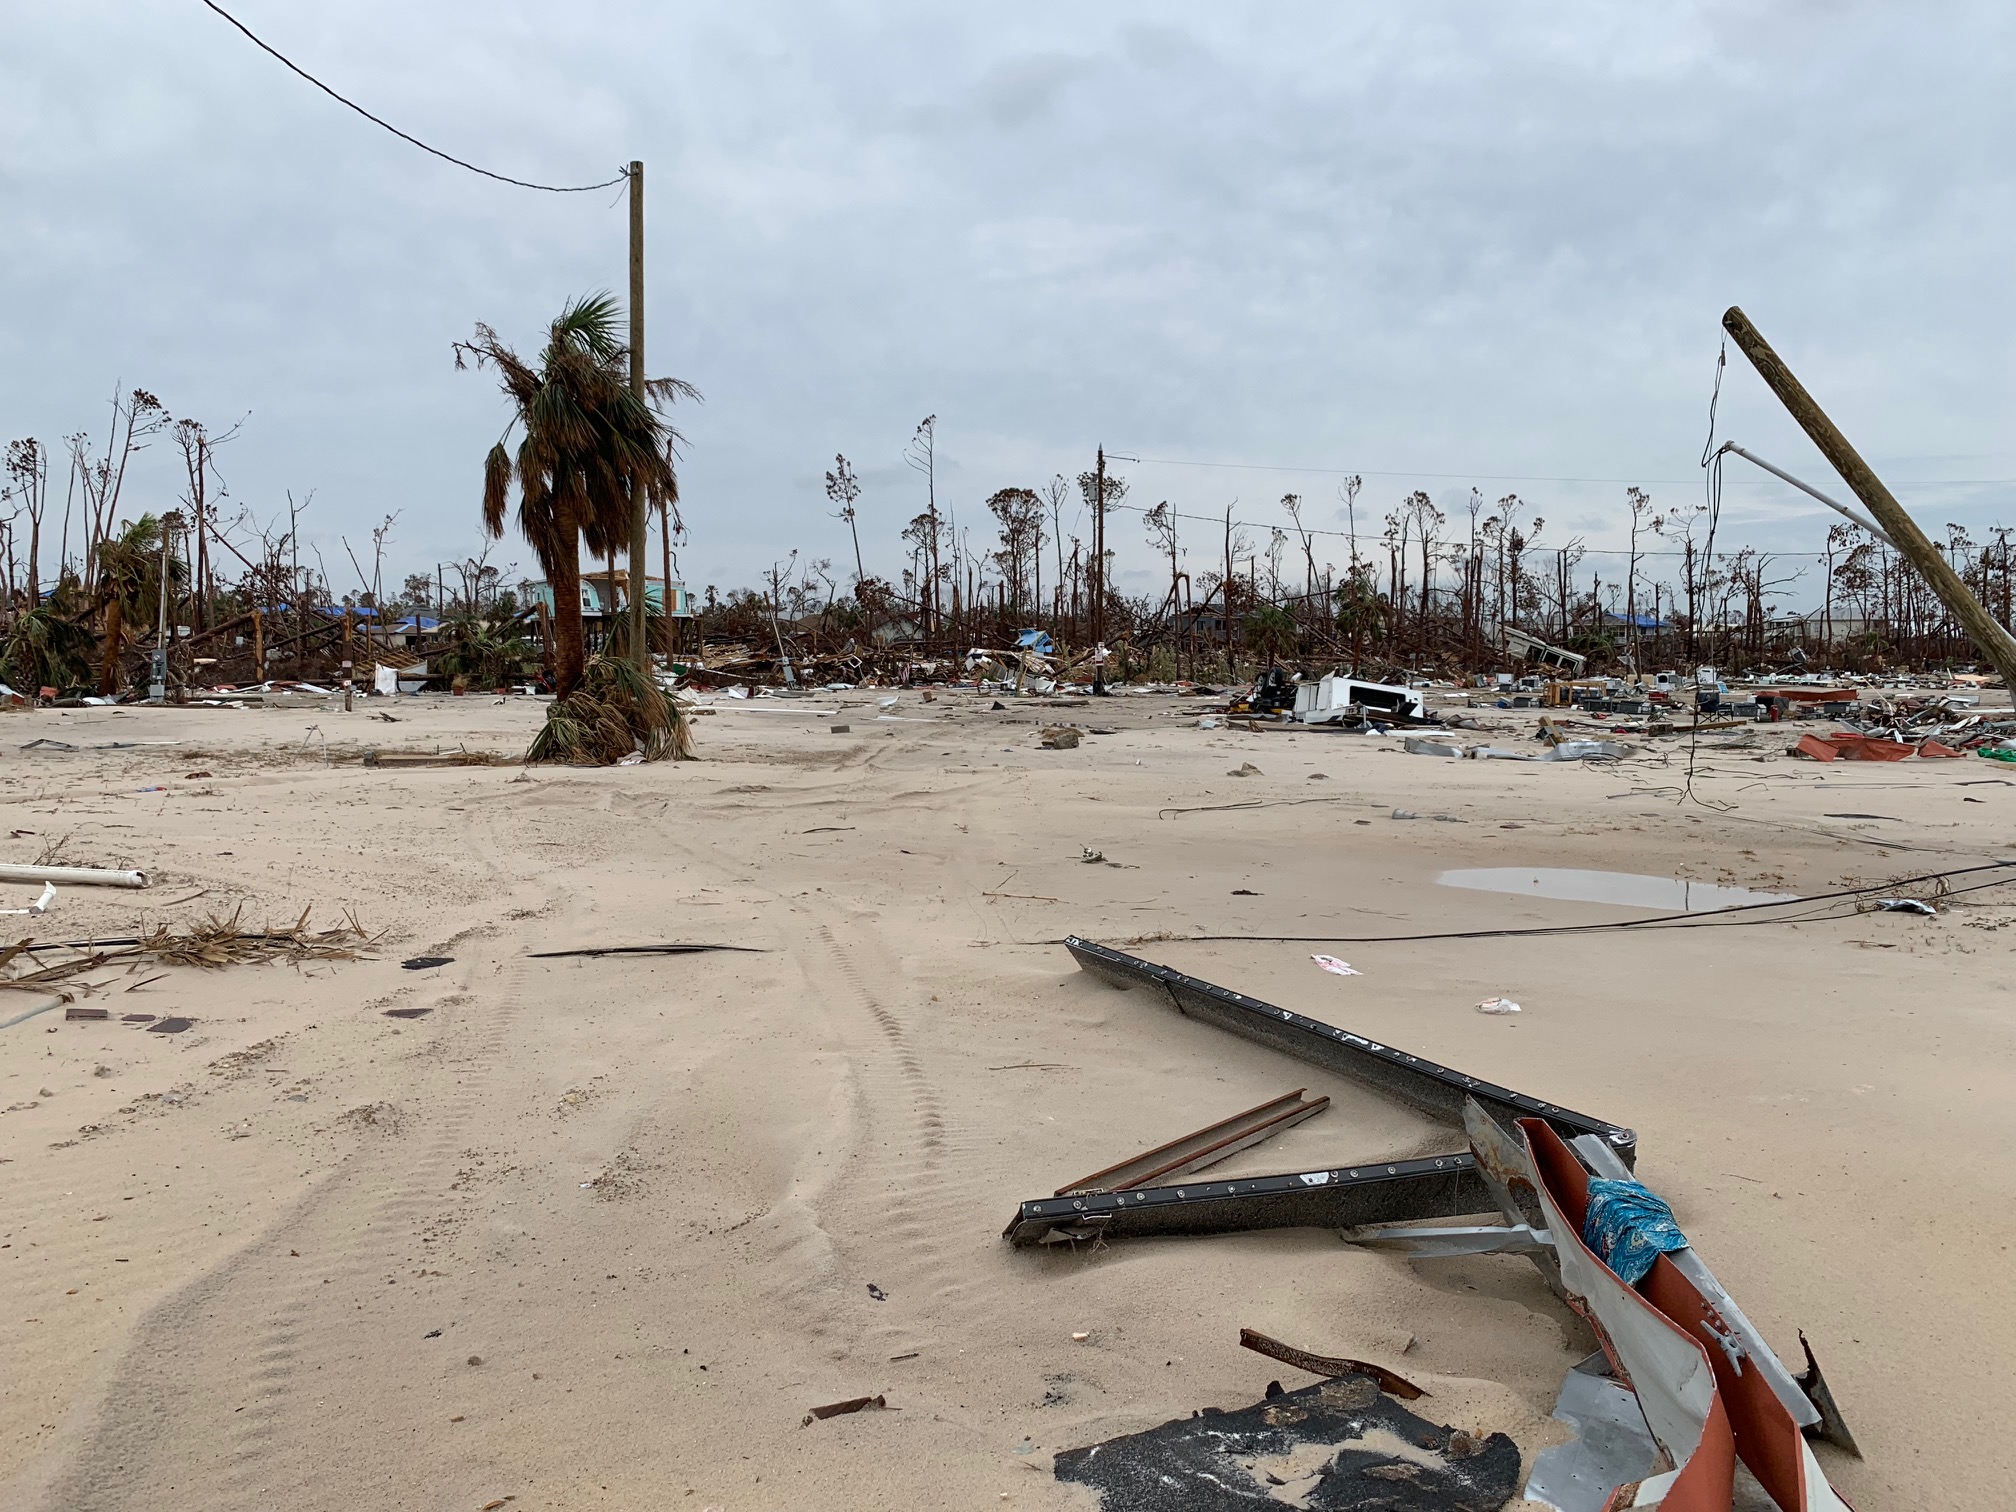
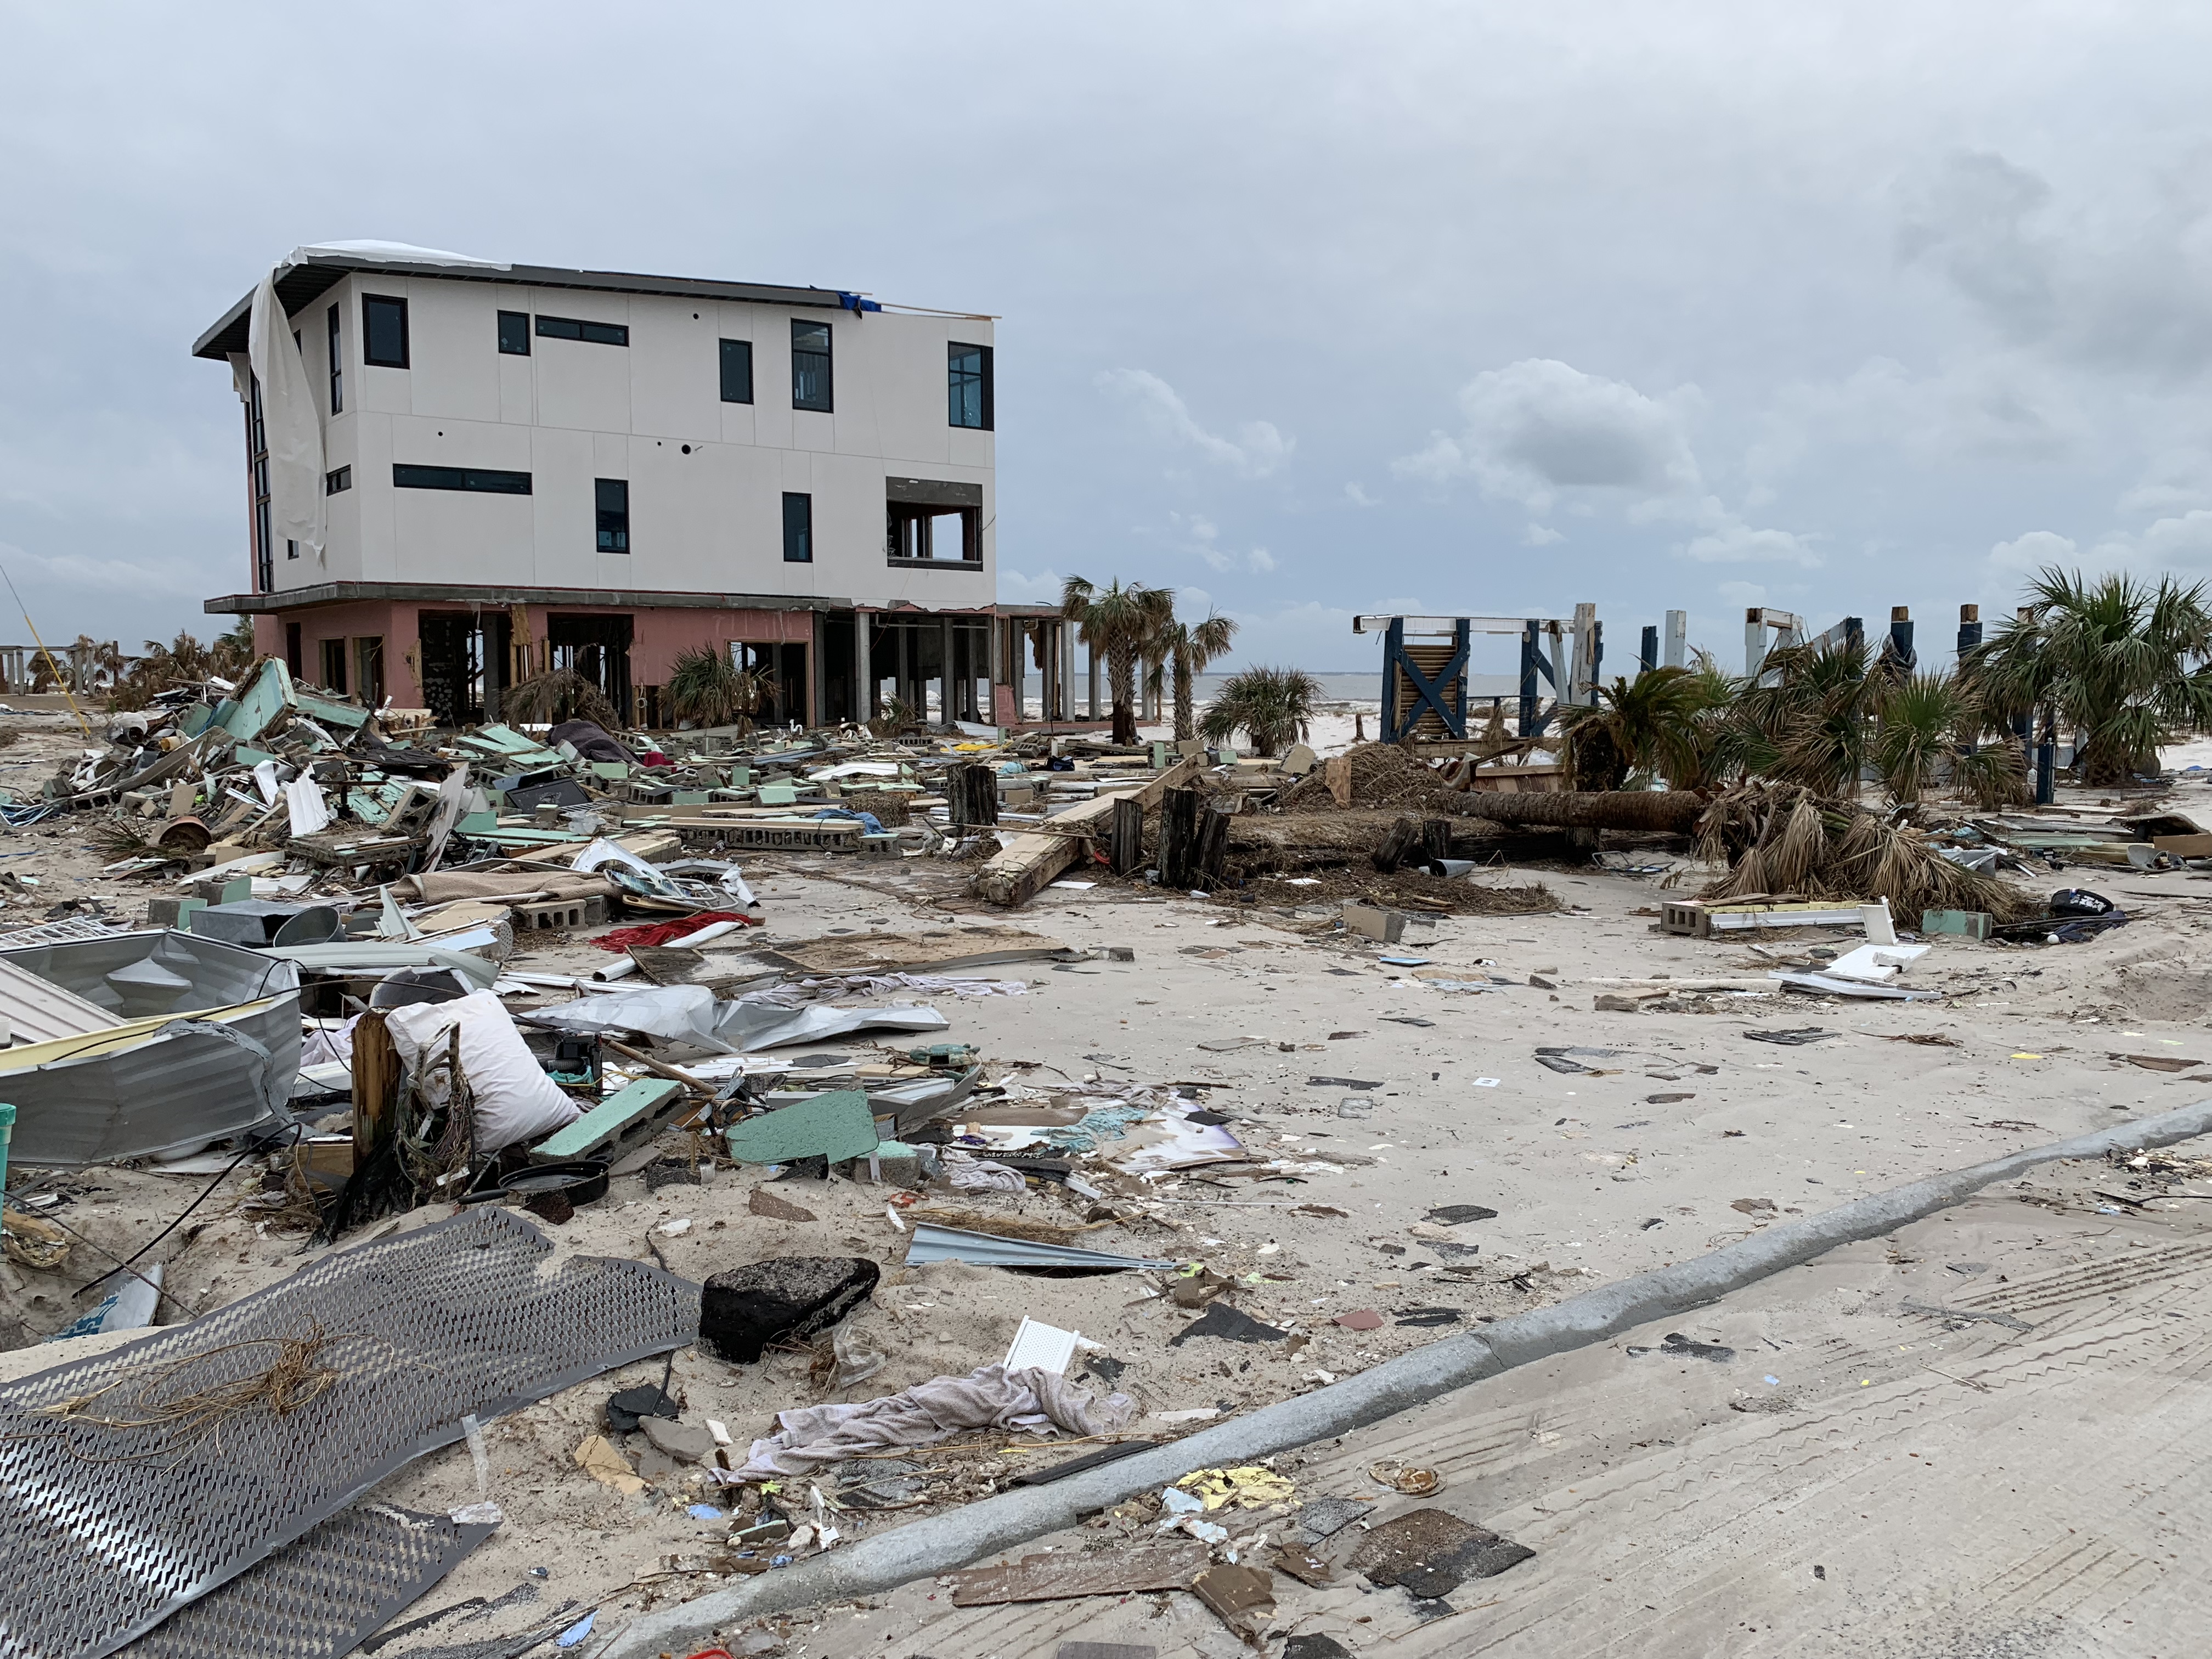
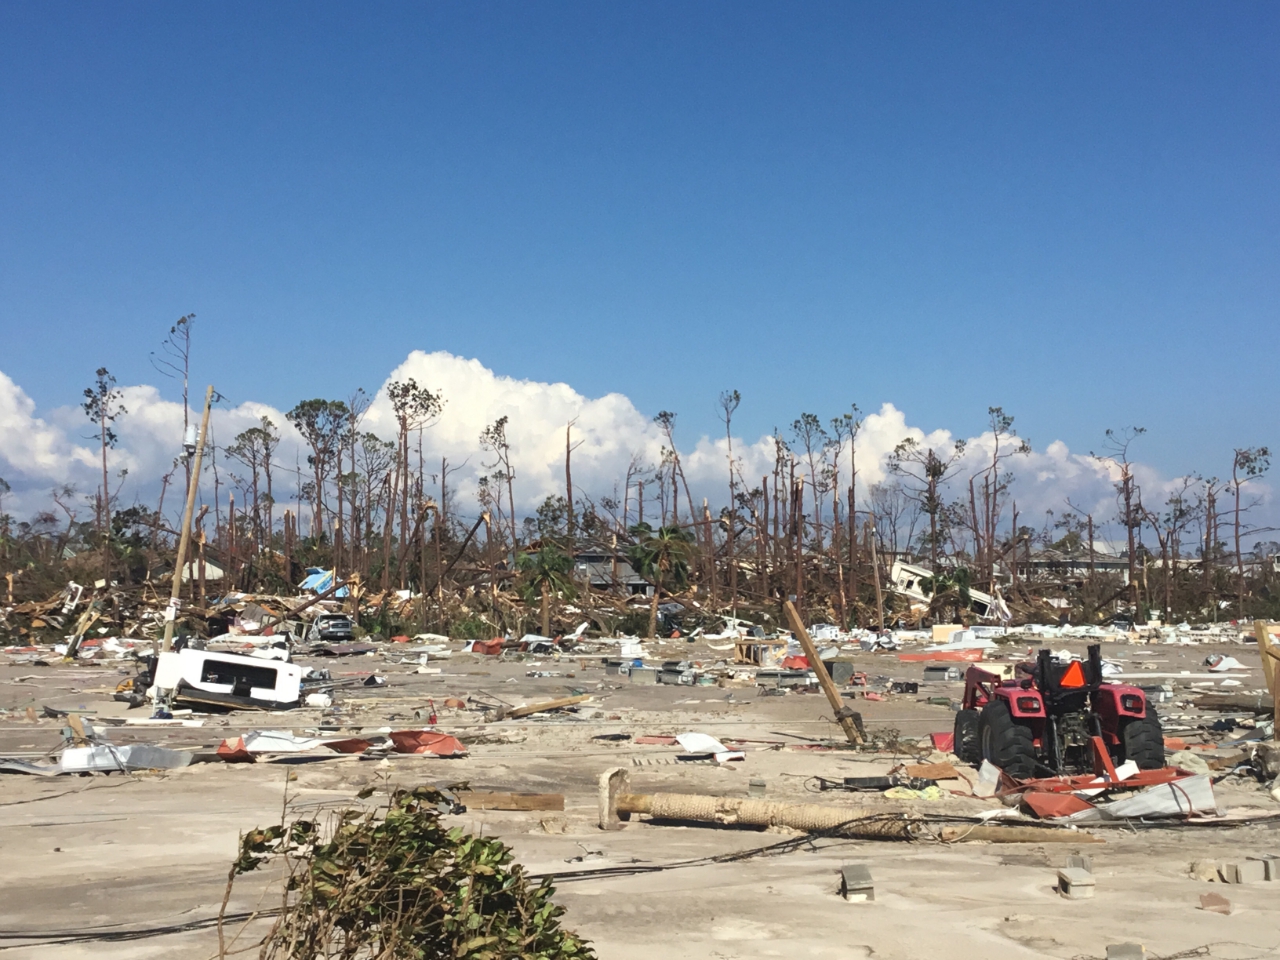
Storm surge damage at Mexico Beach
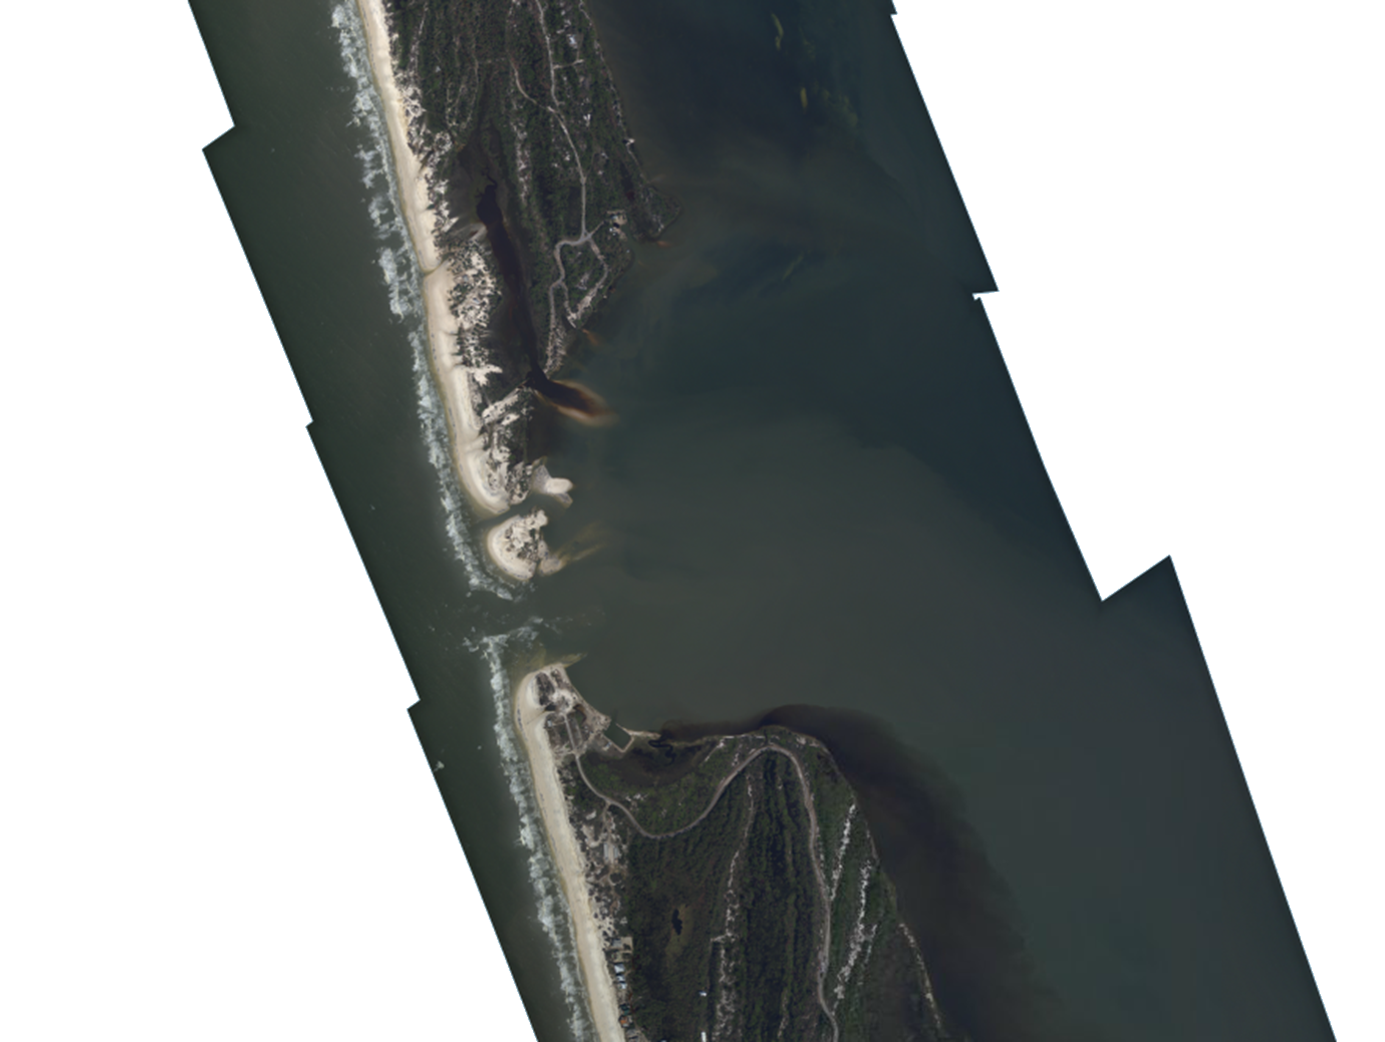
Two new inlets cut at St. Joseph State Park
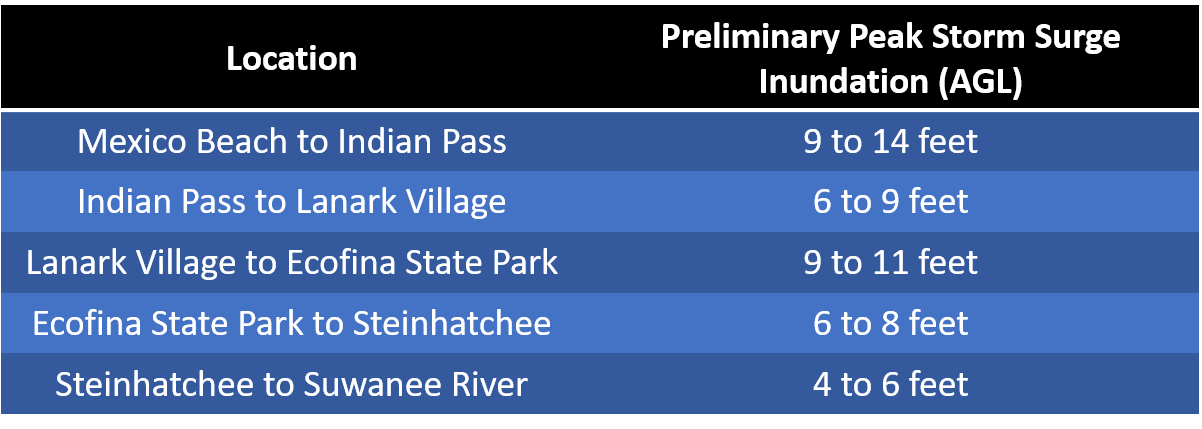
Preliminary Peak Storm Surge Inundation Values (AGL)
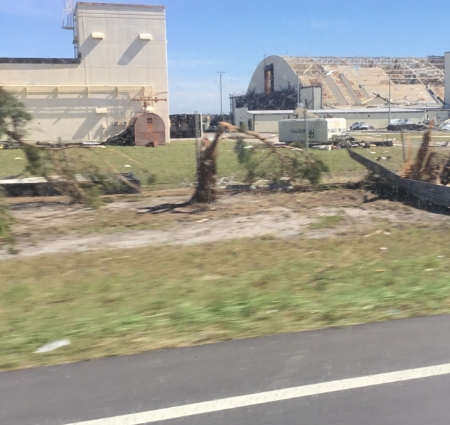
Damage to hanger at Tyndall Air Force Base
Damage to an Elementary School near Tyndall
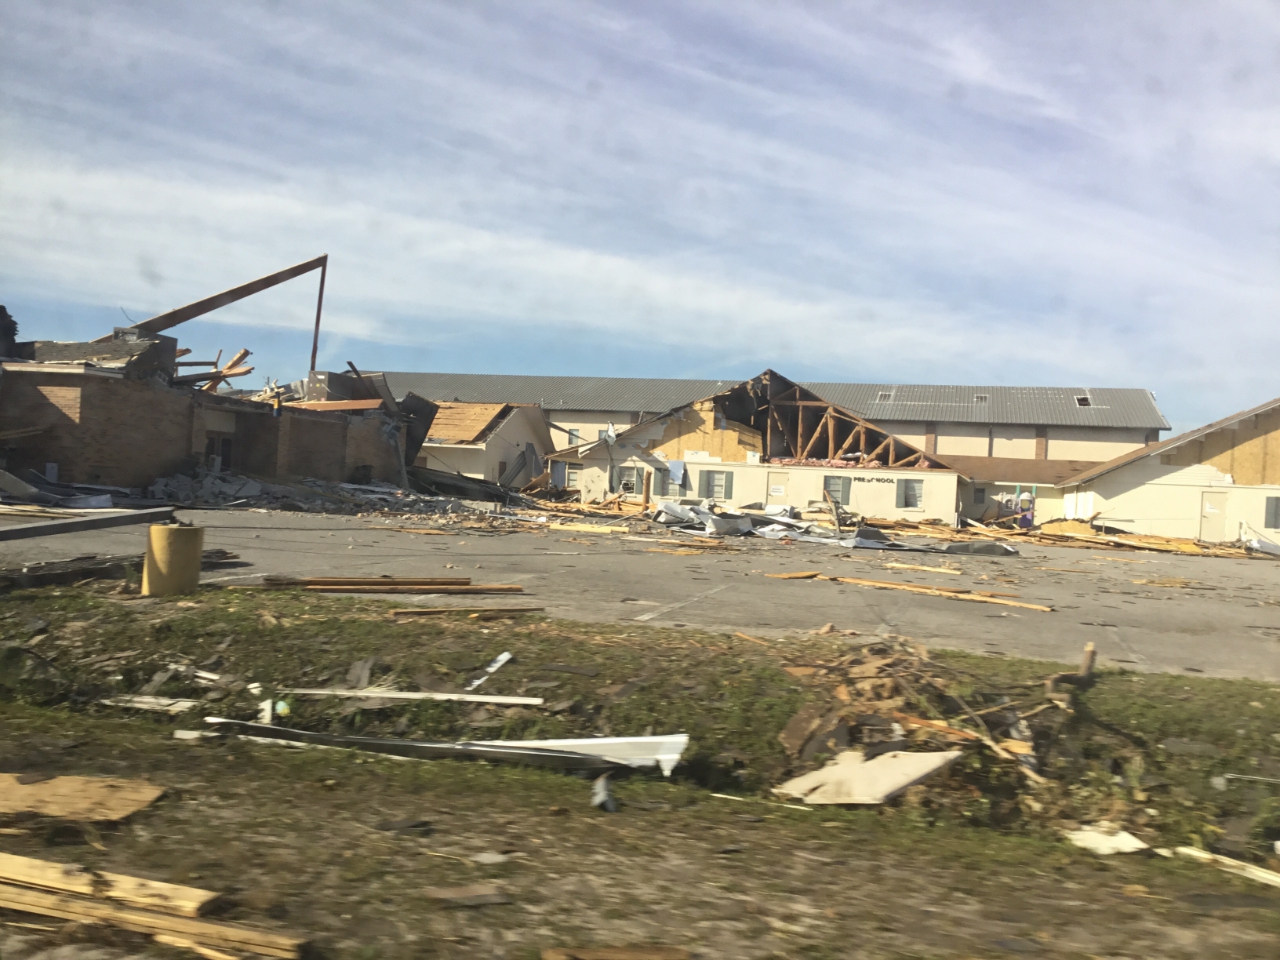
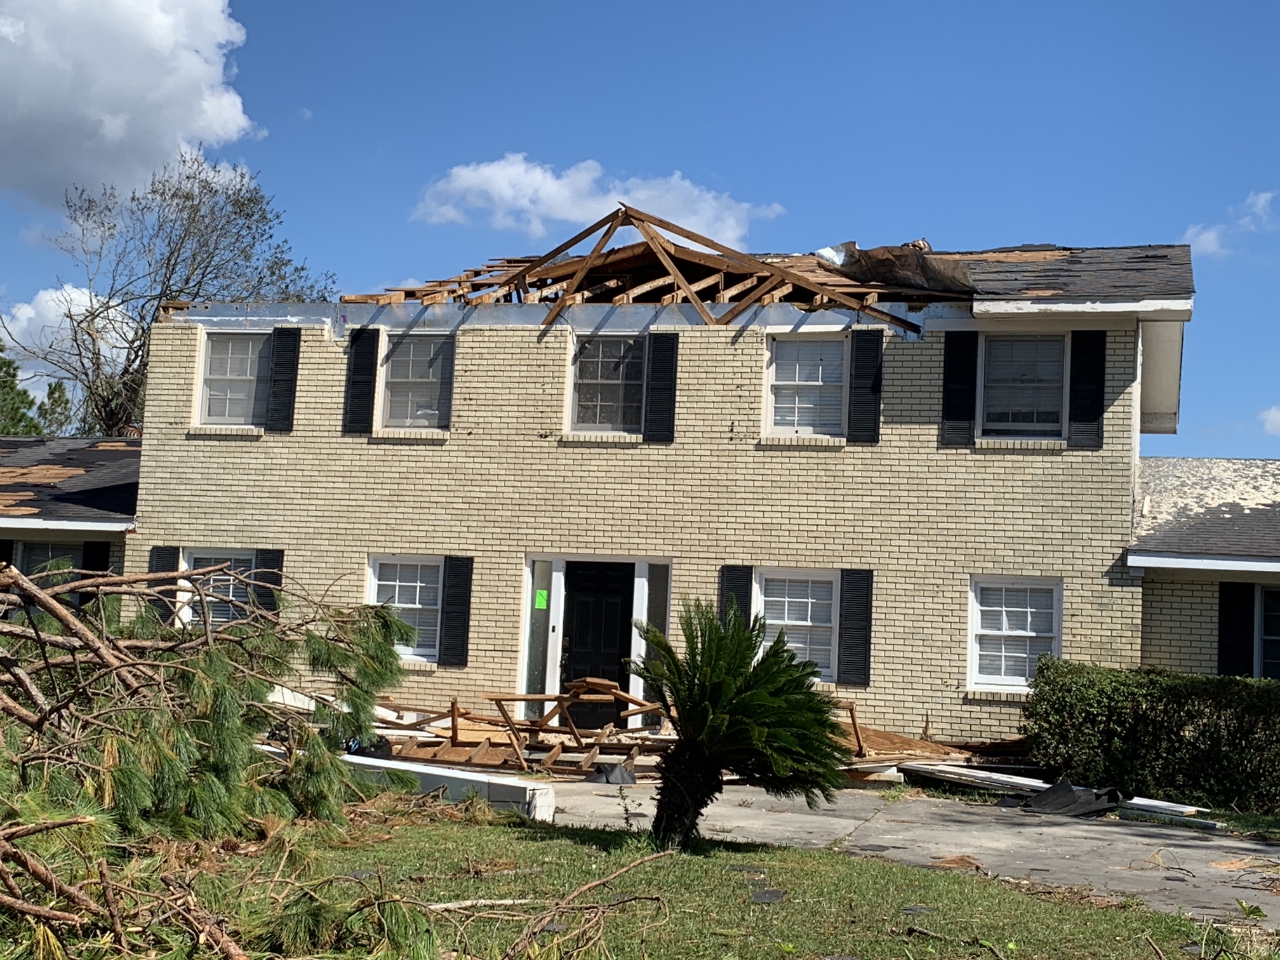
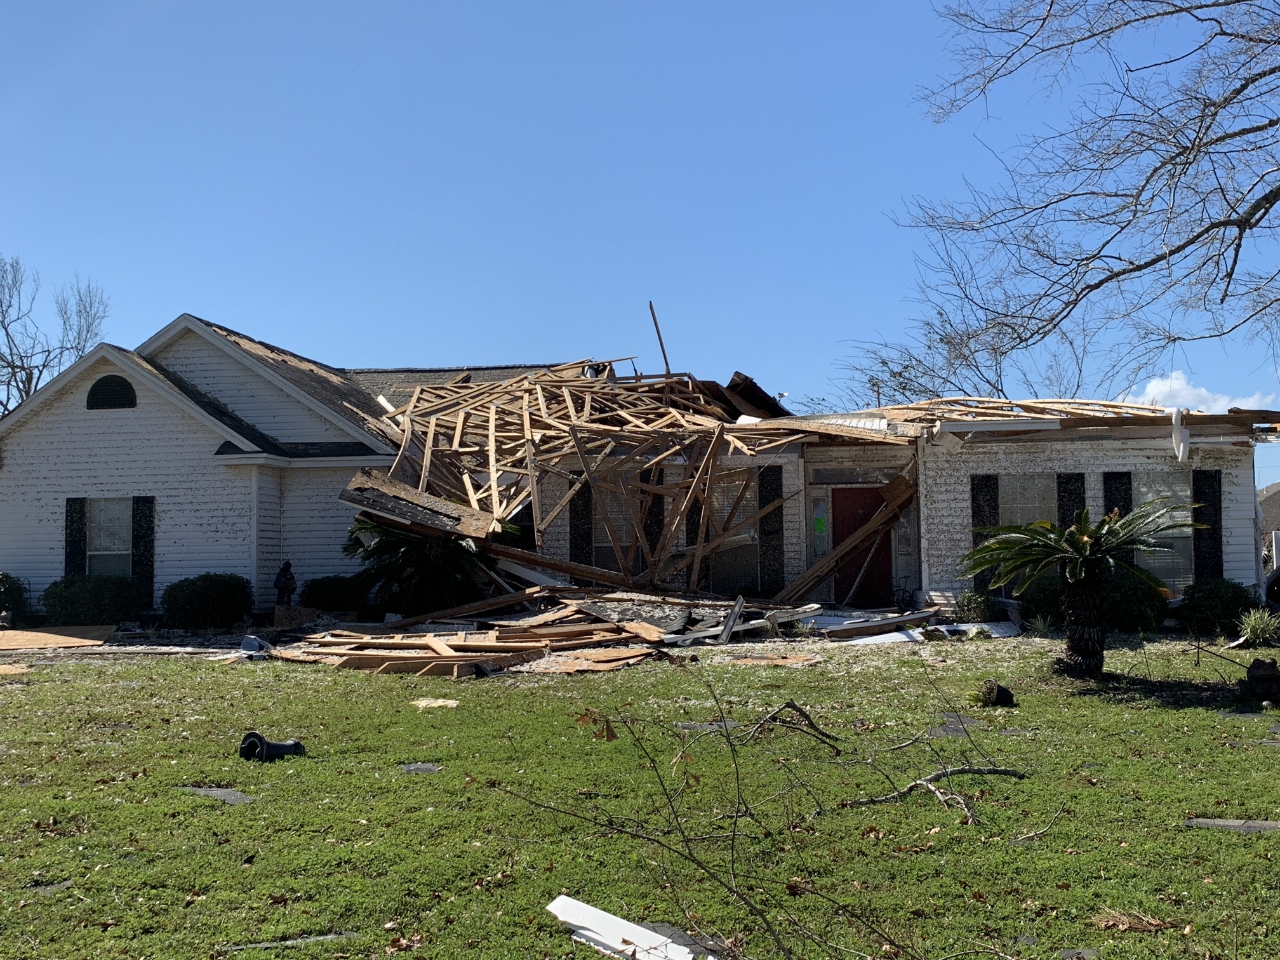
Structure damage in Callaway
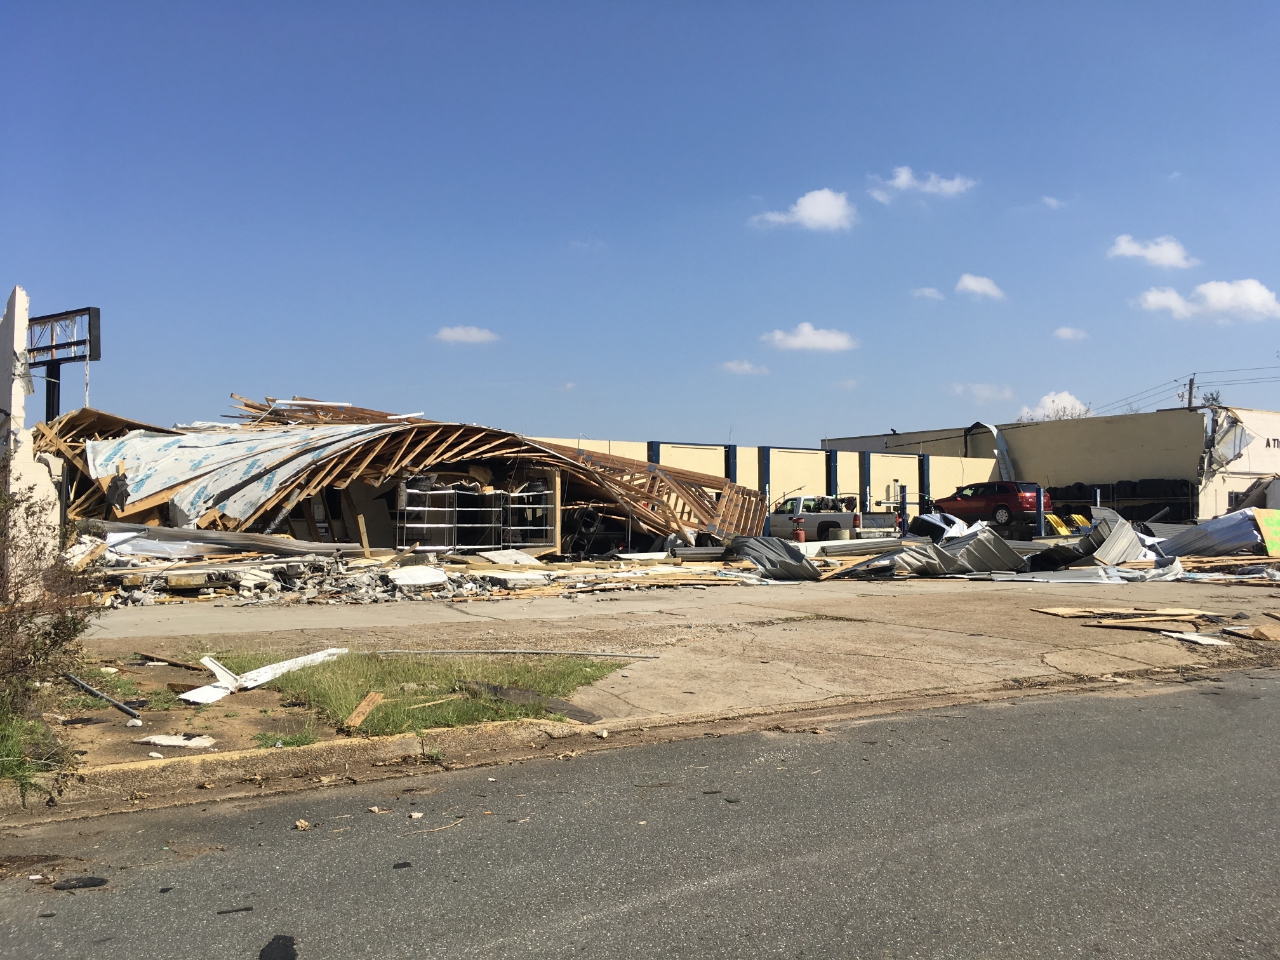

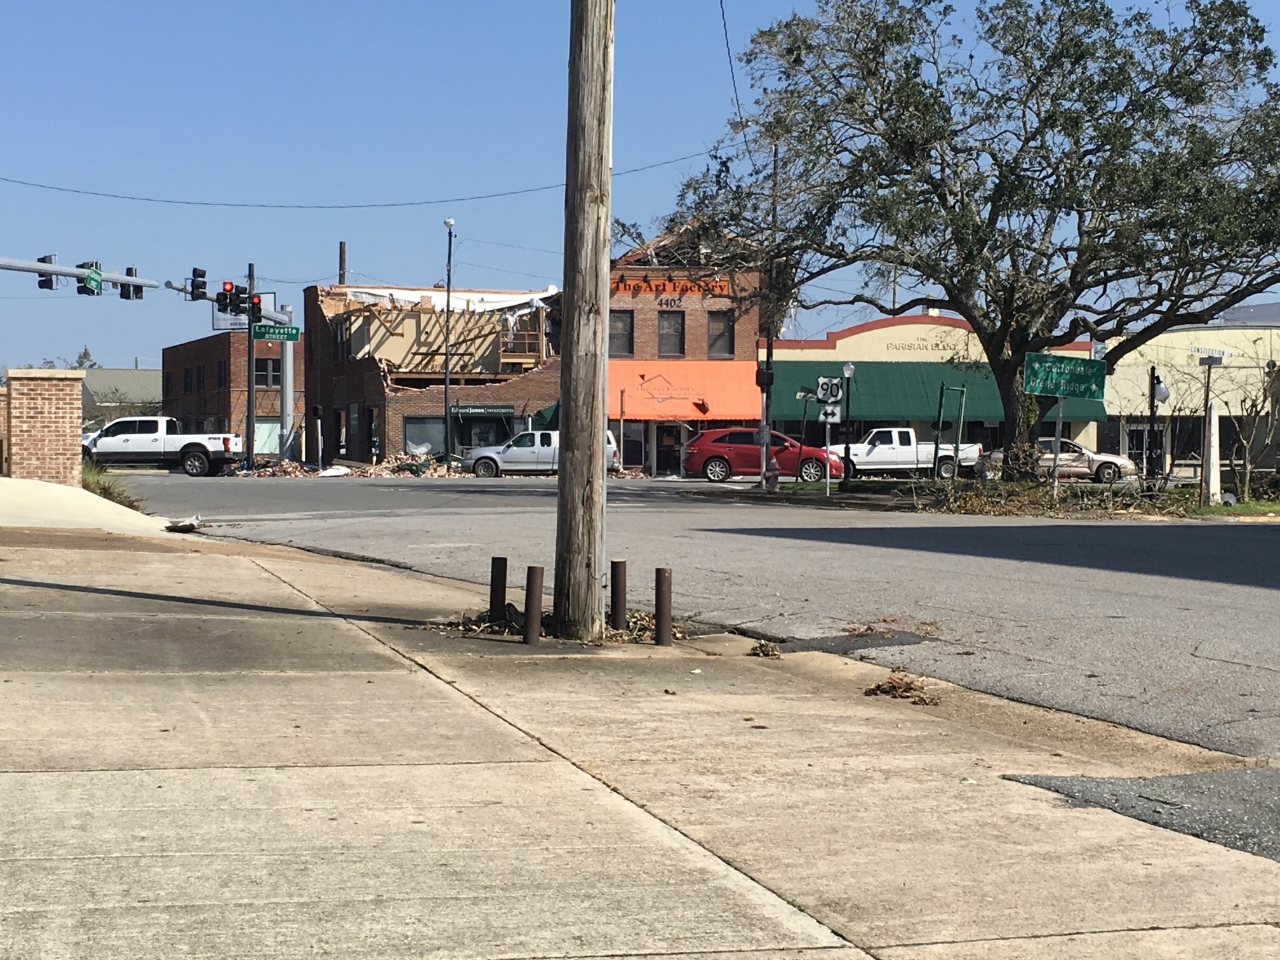
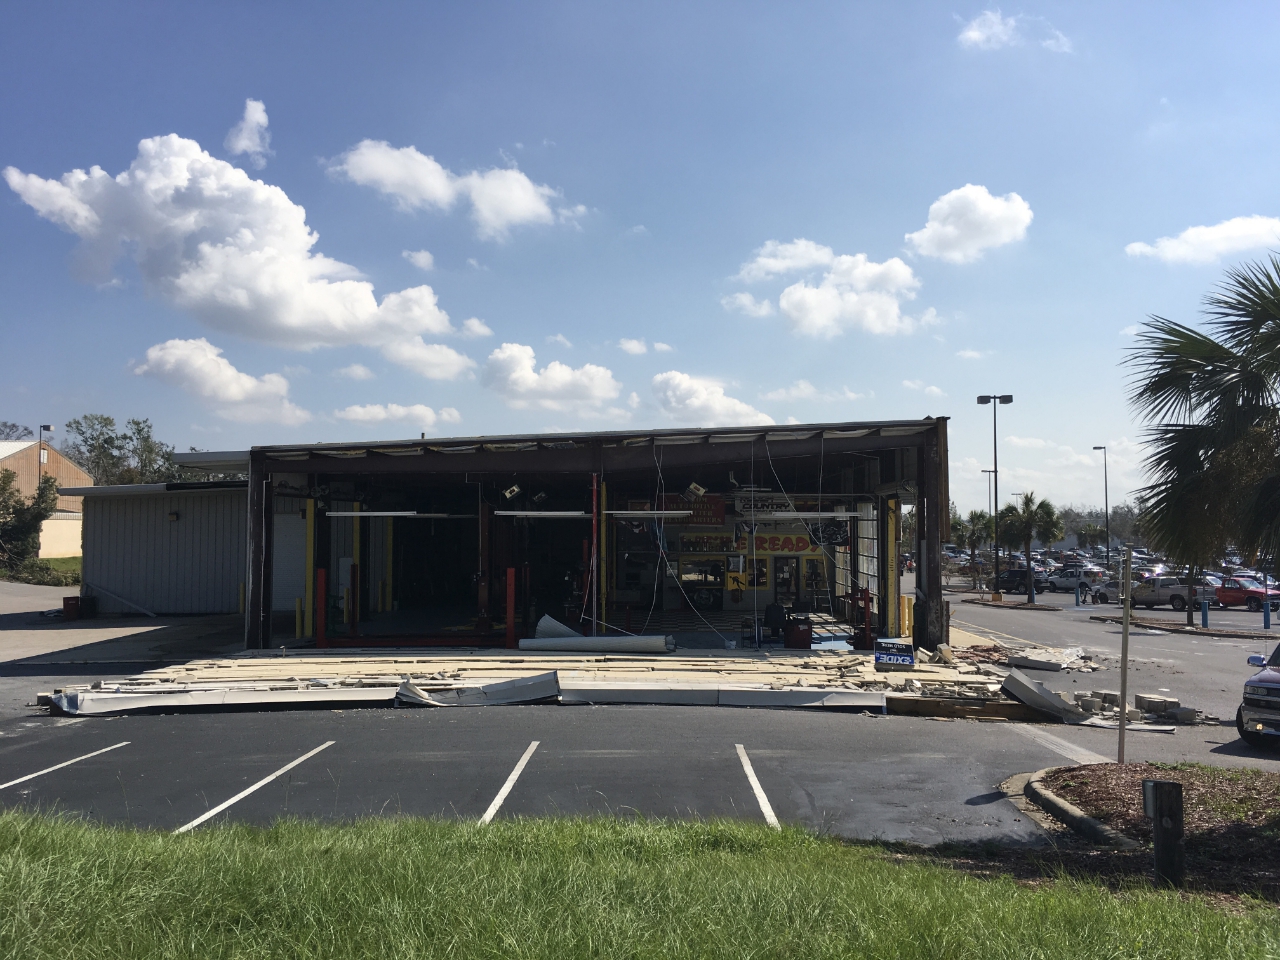
Collapsed roof at tire store in Marianna
Roof removed and collapsed wall at building in Marianna
Damage to silo in Donalsonville
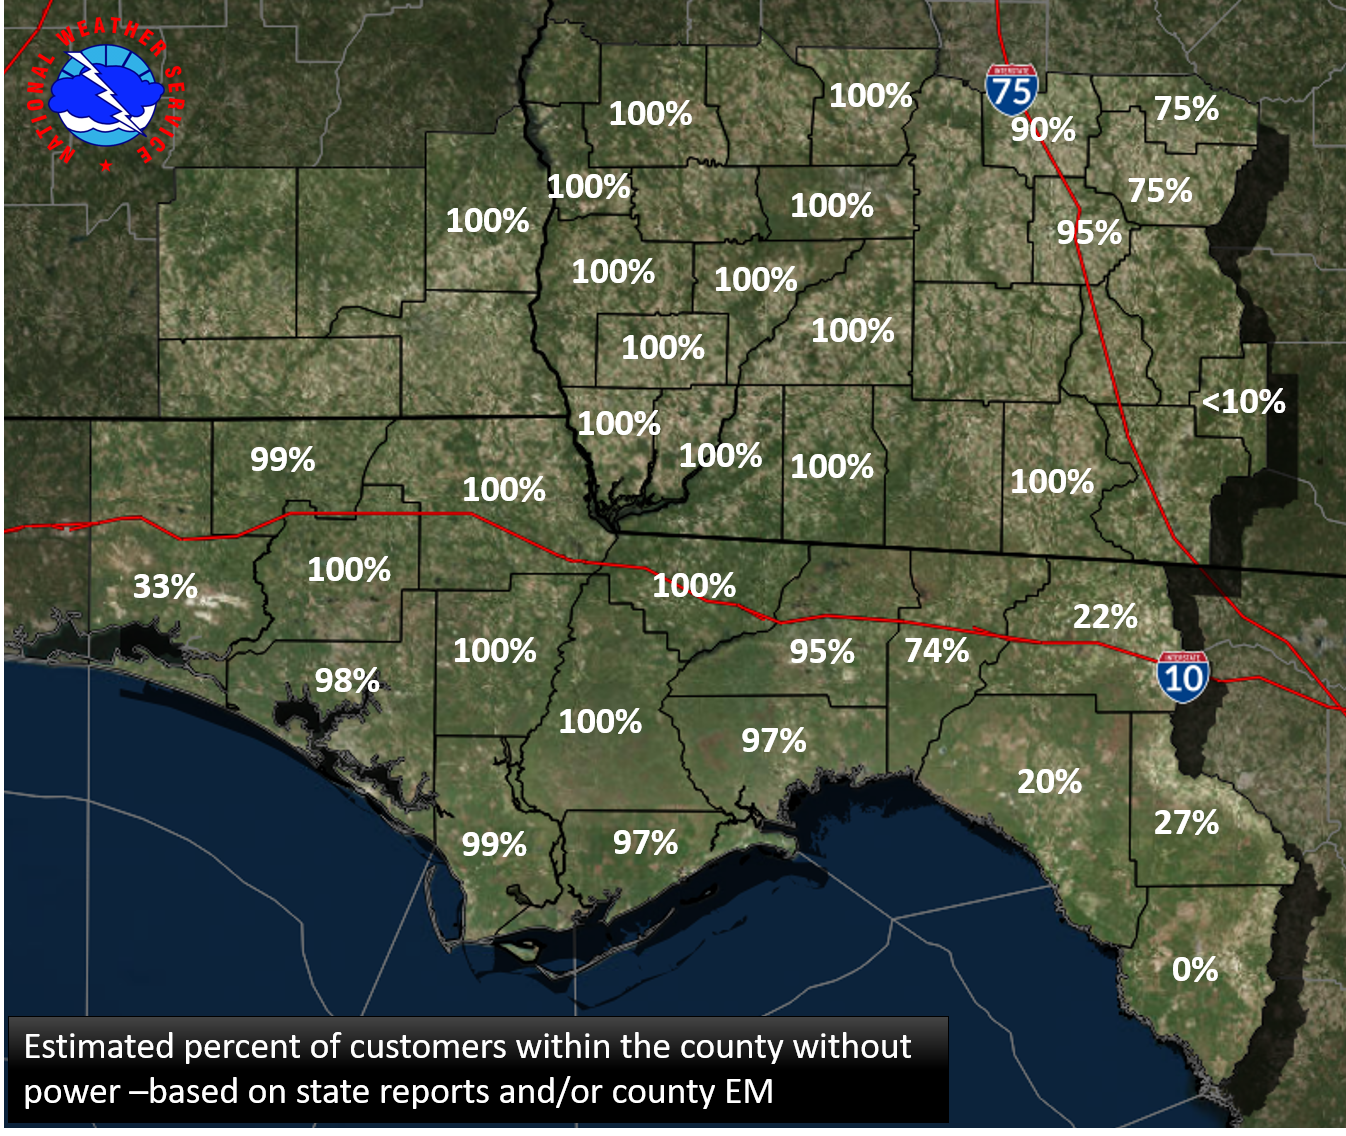
Estimated percent of customers in county without power
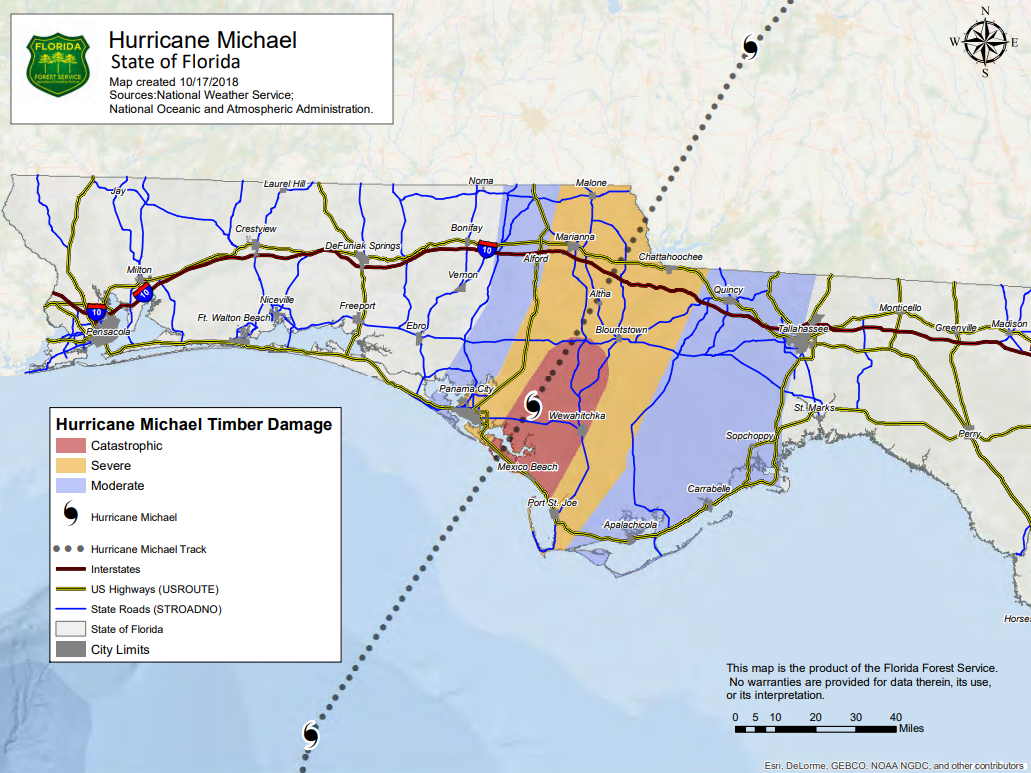
Florida Timber Damage
Courtesy of the Florida Forest Service
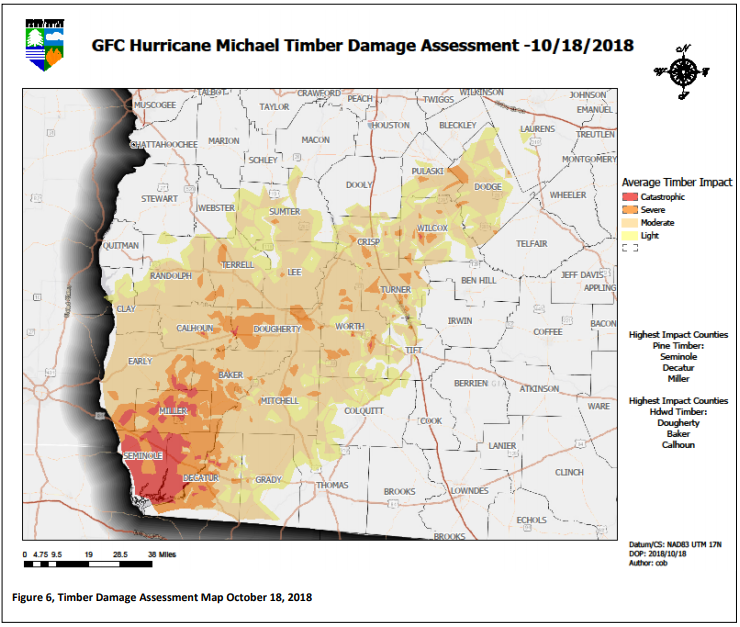
Georgia Timber Damage
Courtesy of the Georgia Forestry Commission
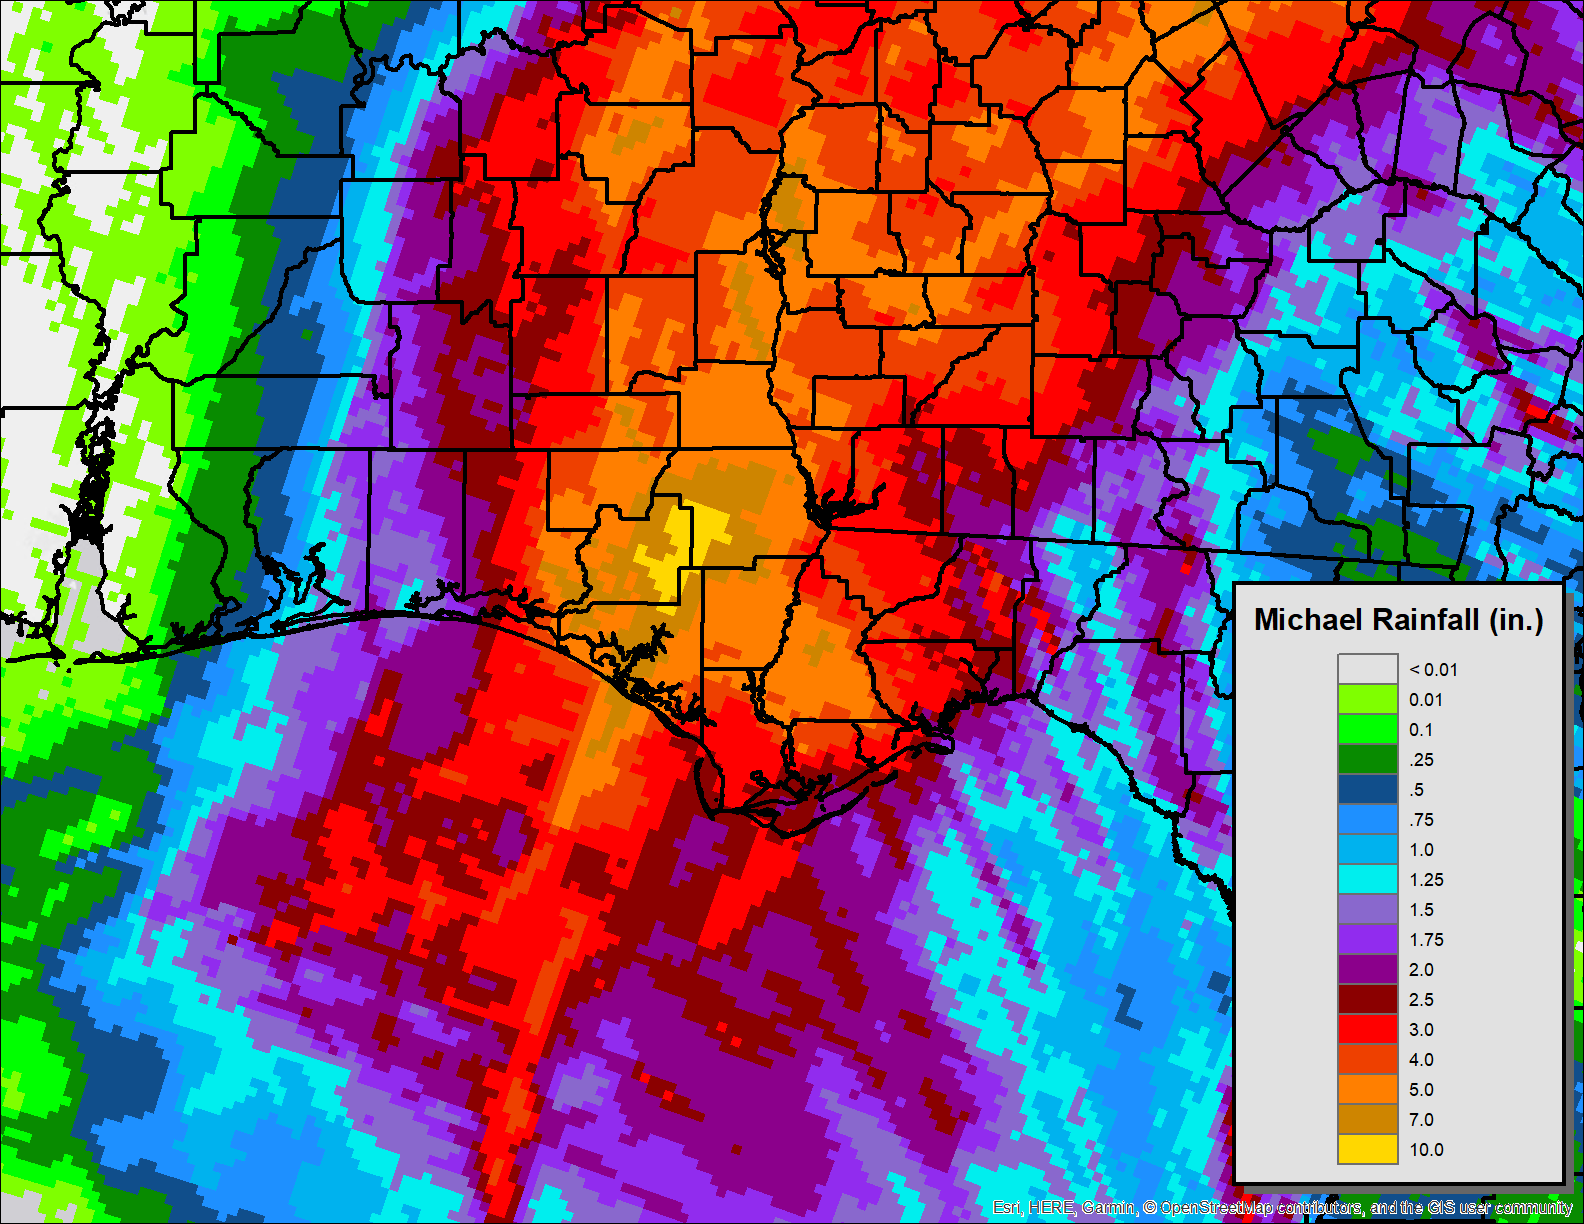
Observed Rainfall During Hurricane Michael
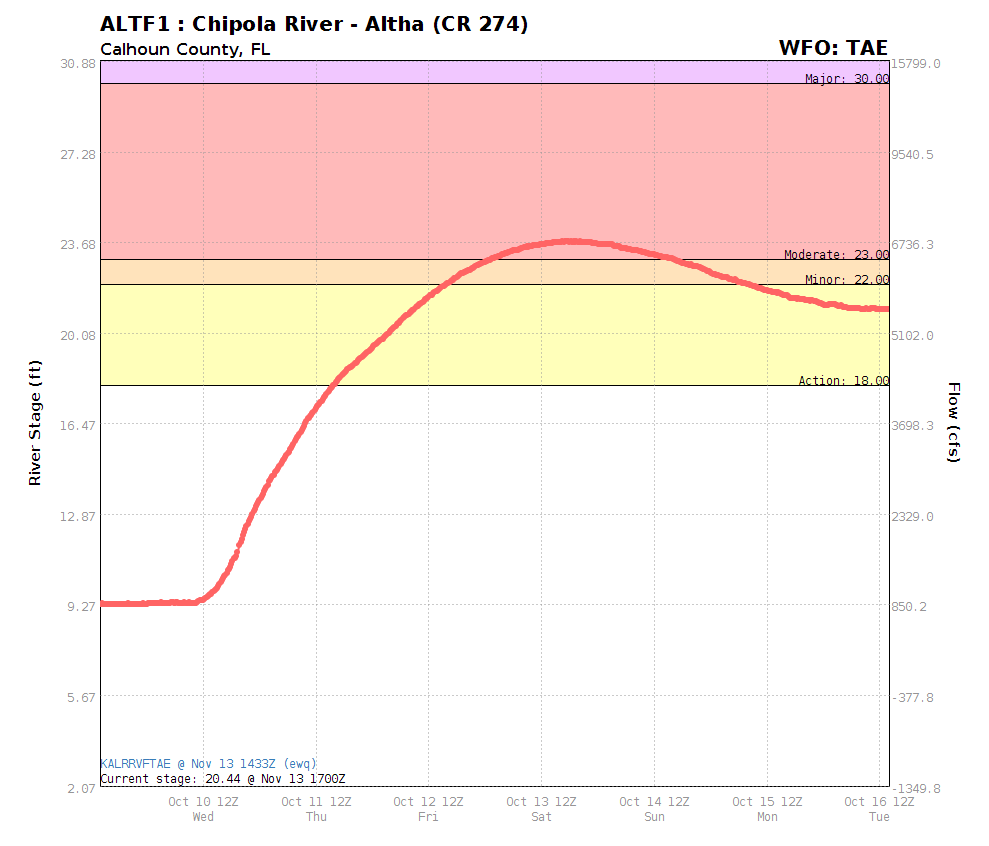
Chipola River at Altha
Econfina Creek at State Road 20
1 / 75
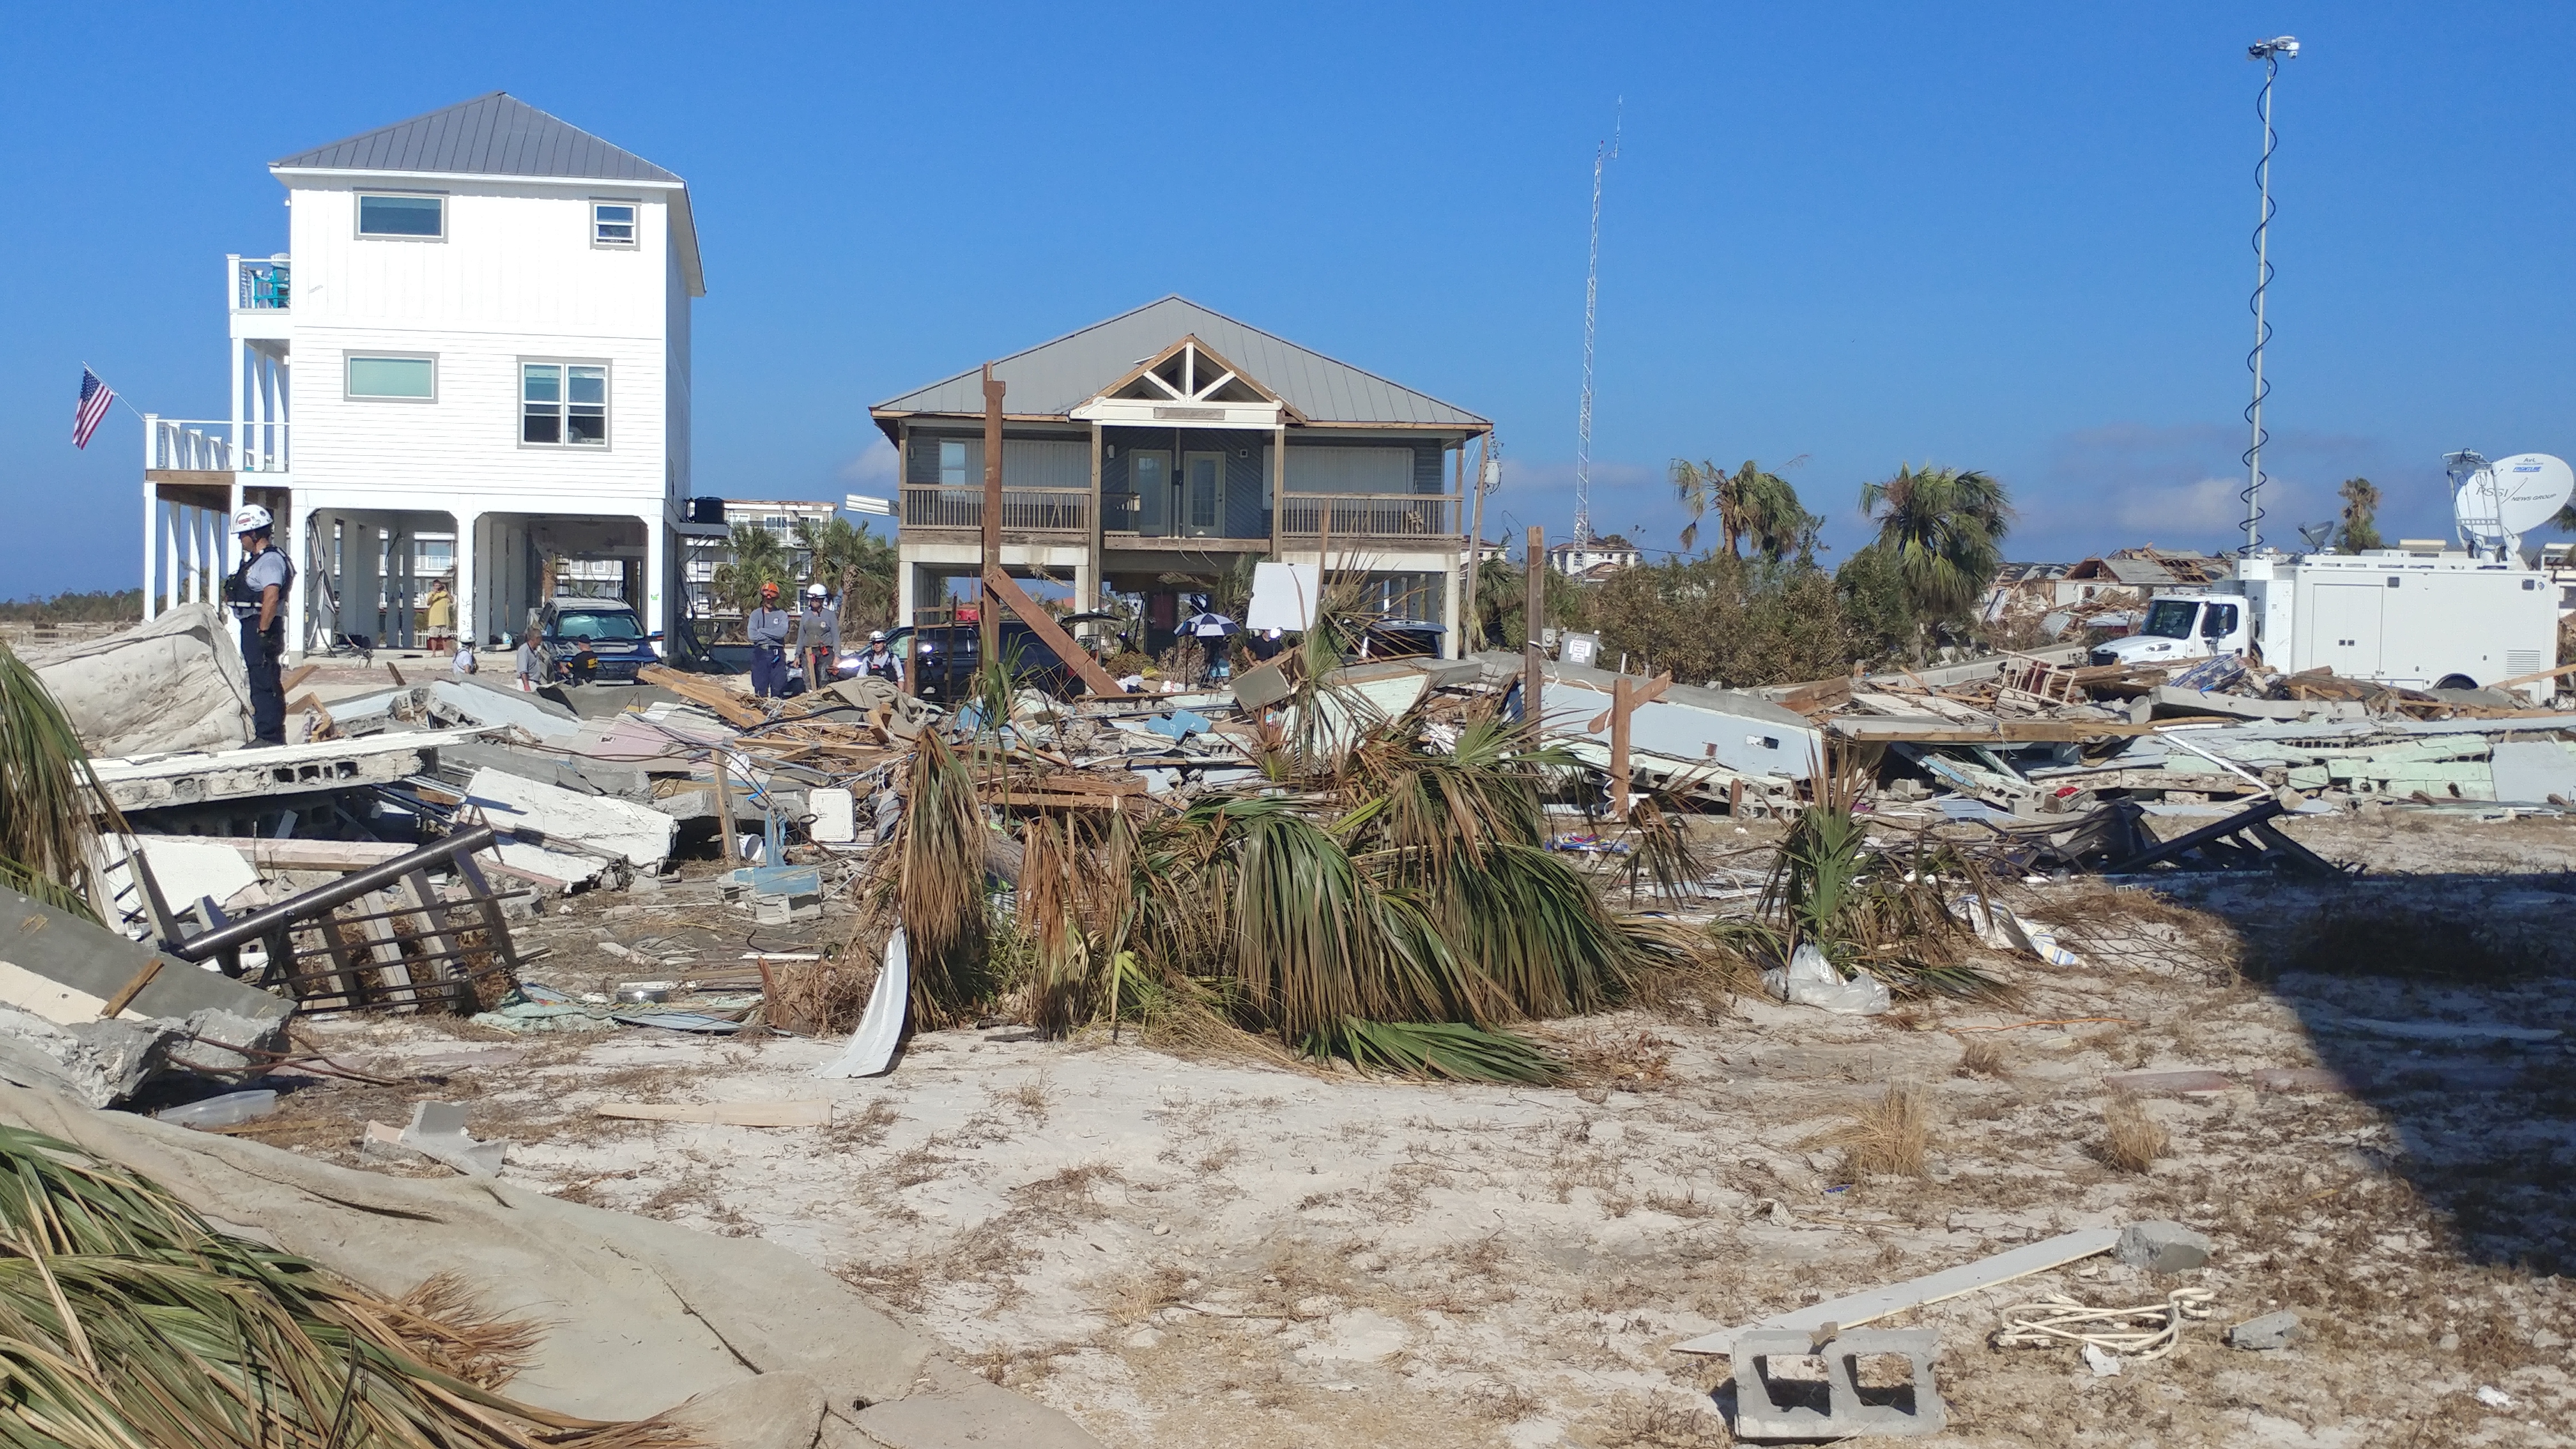
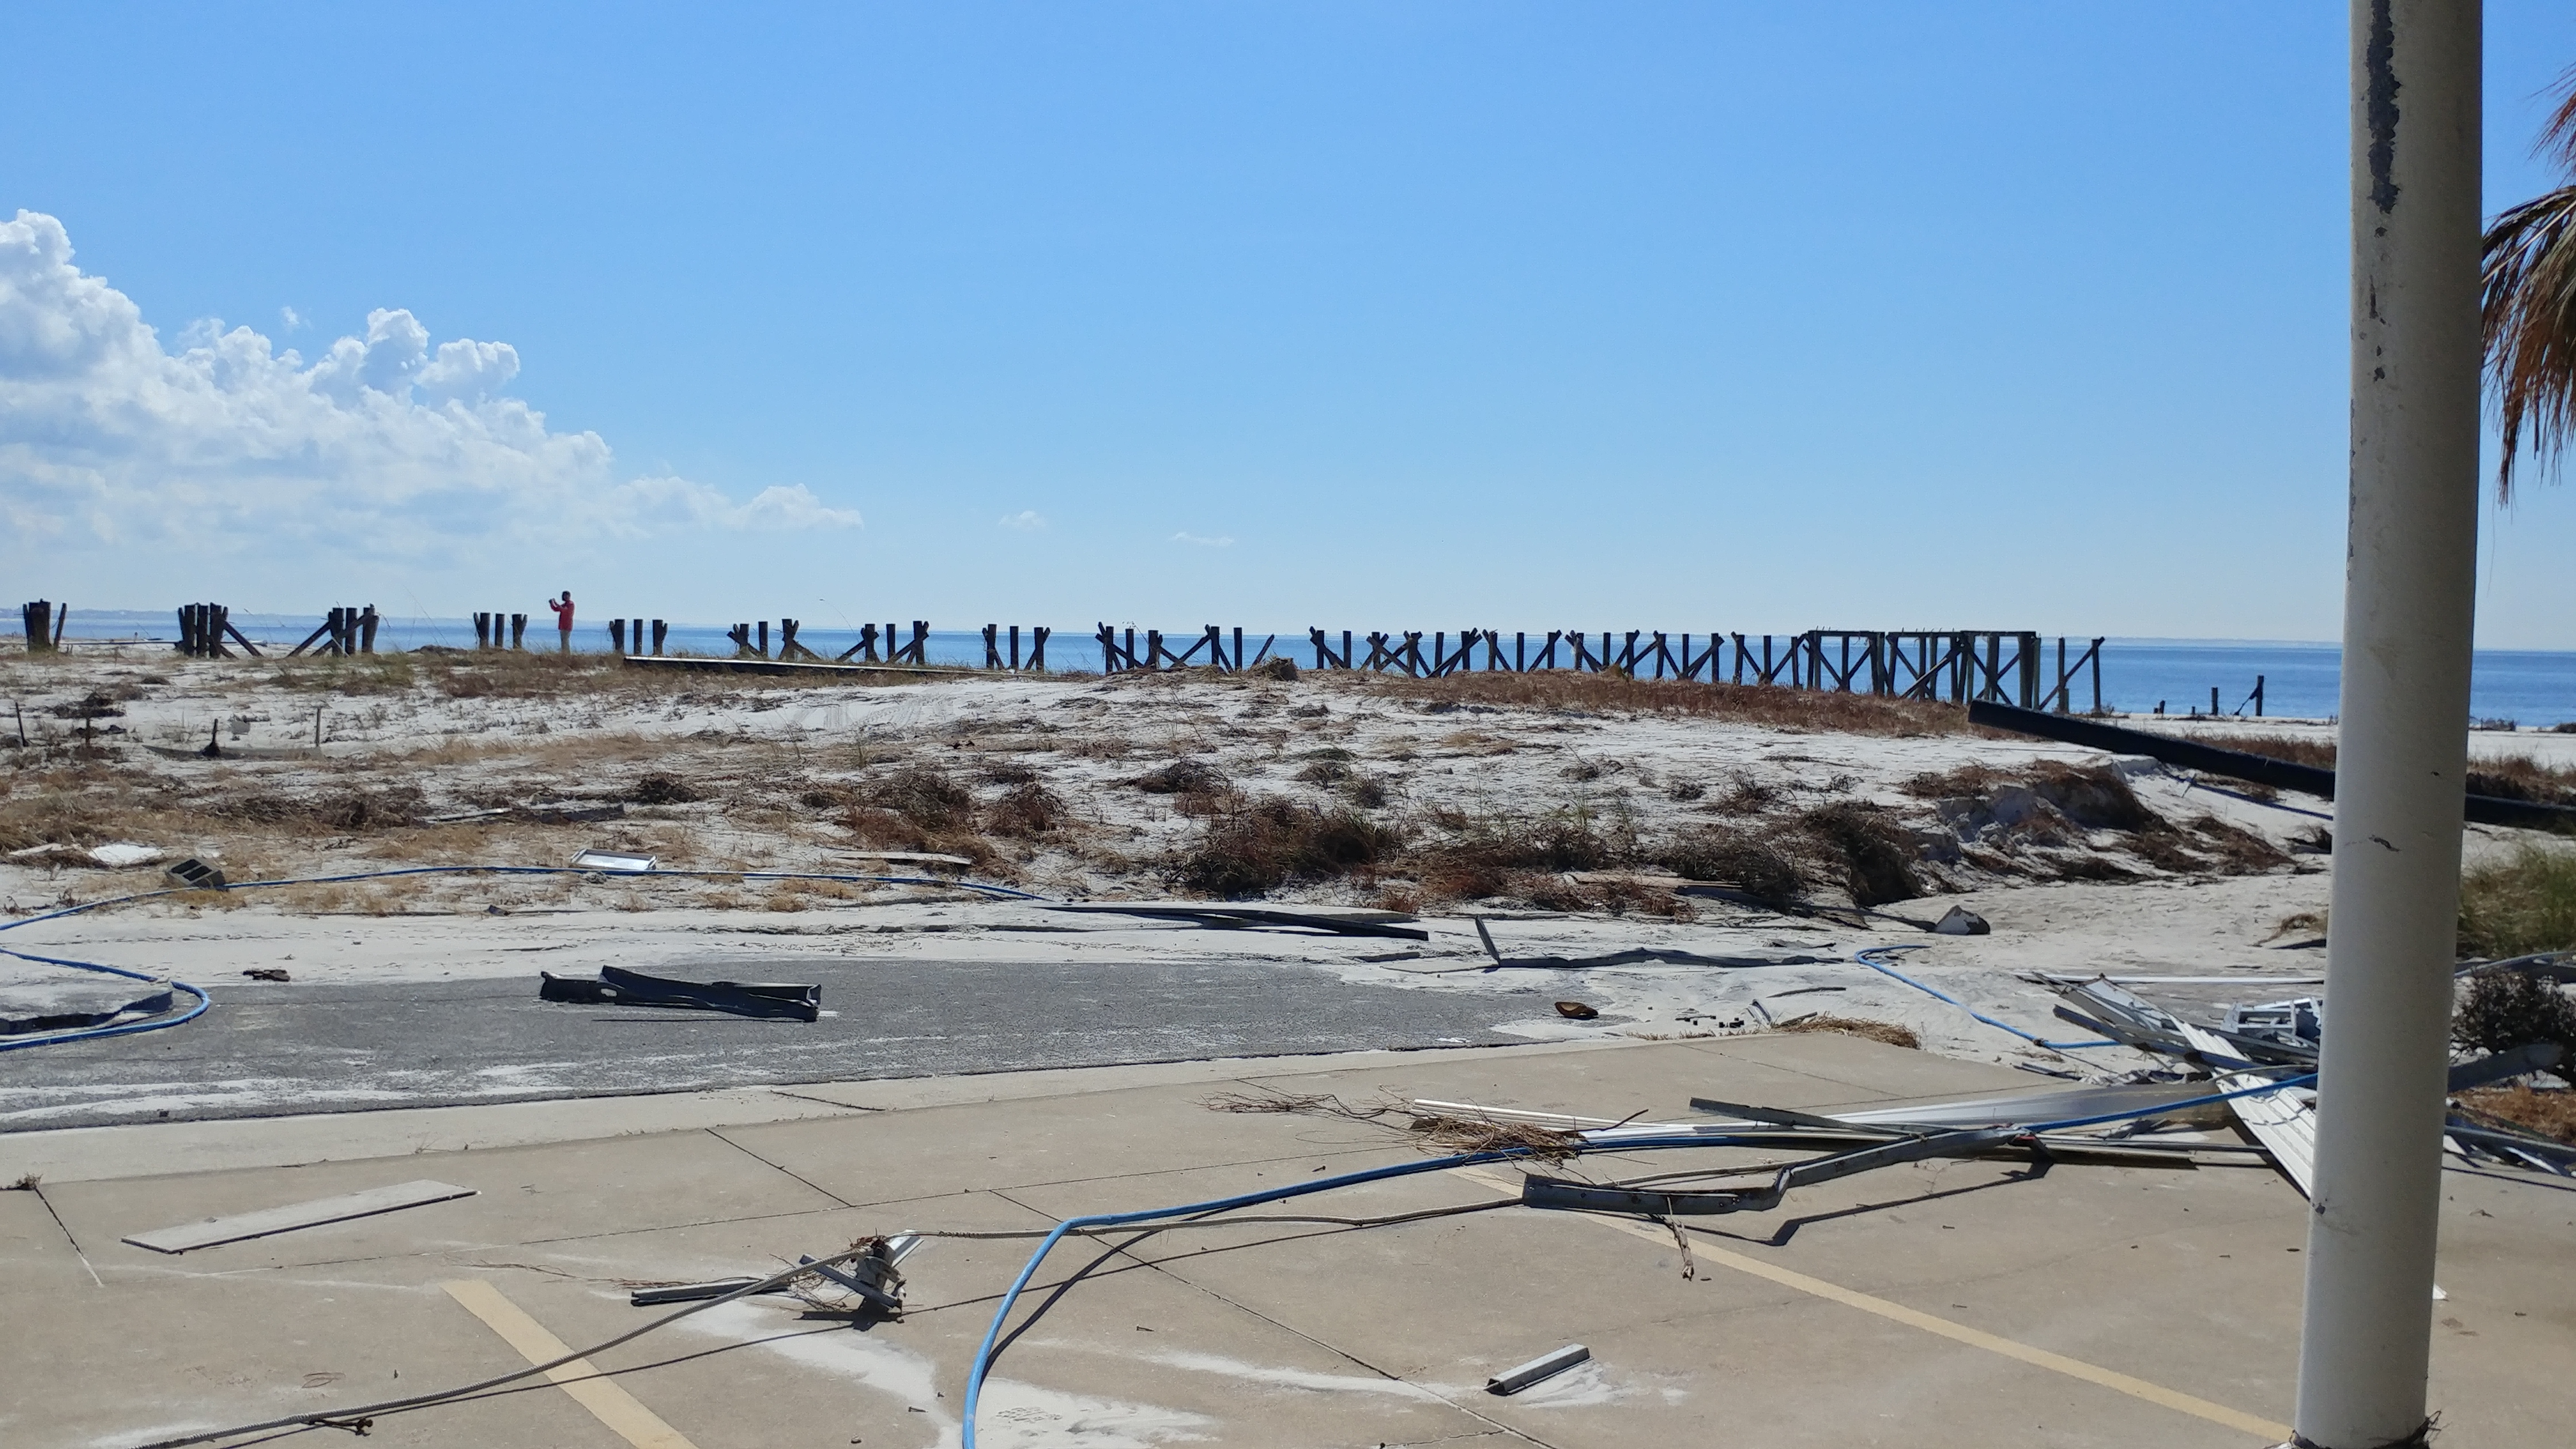
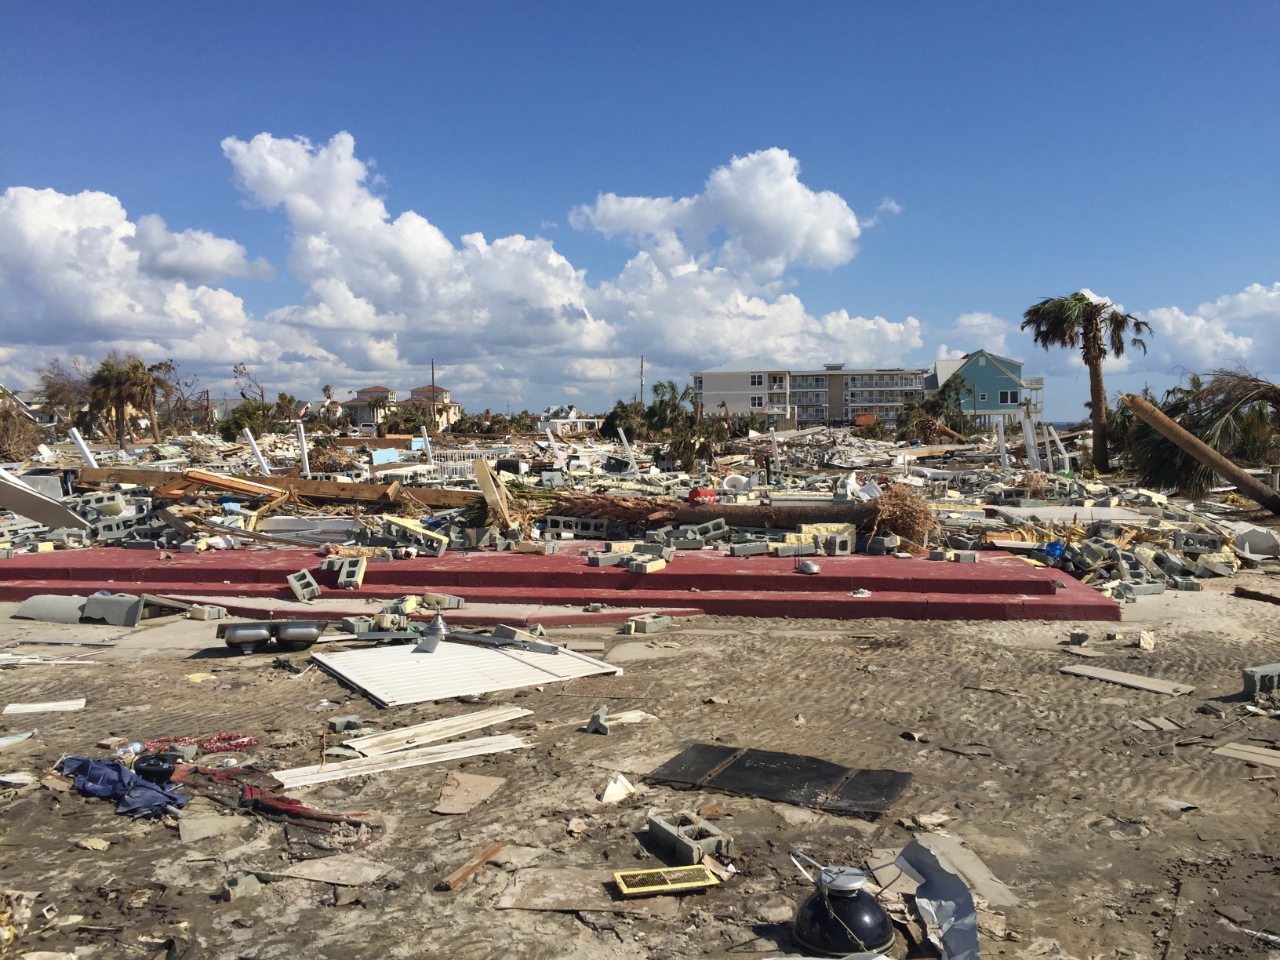
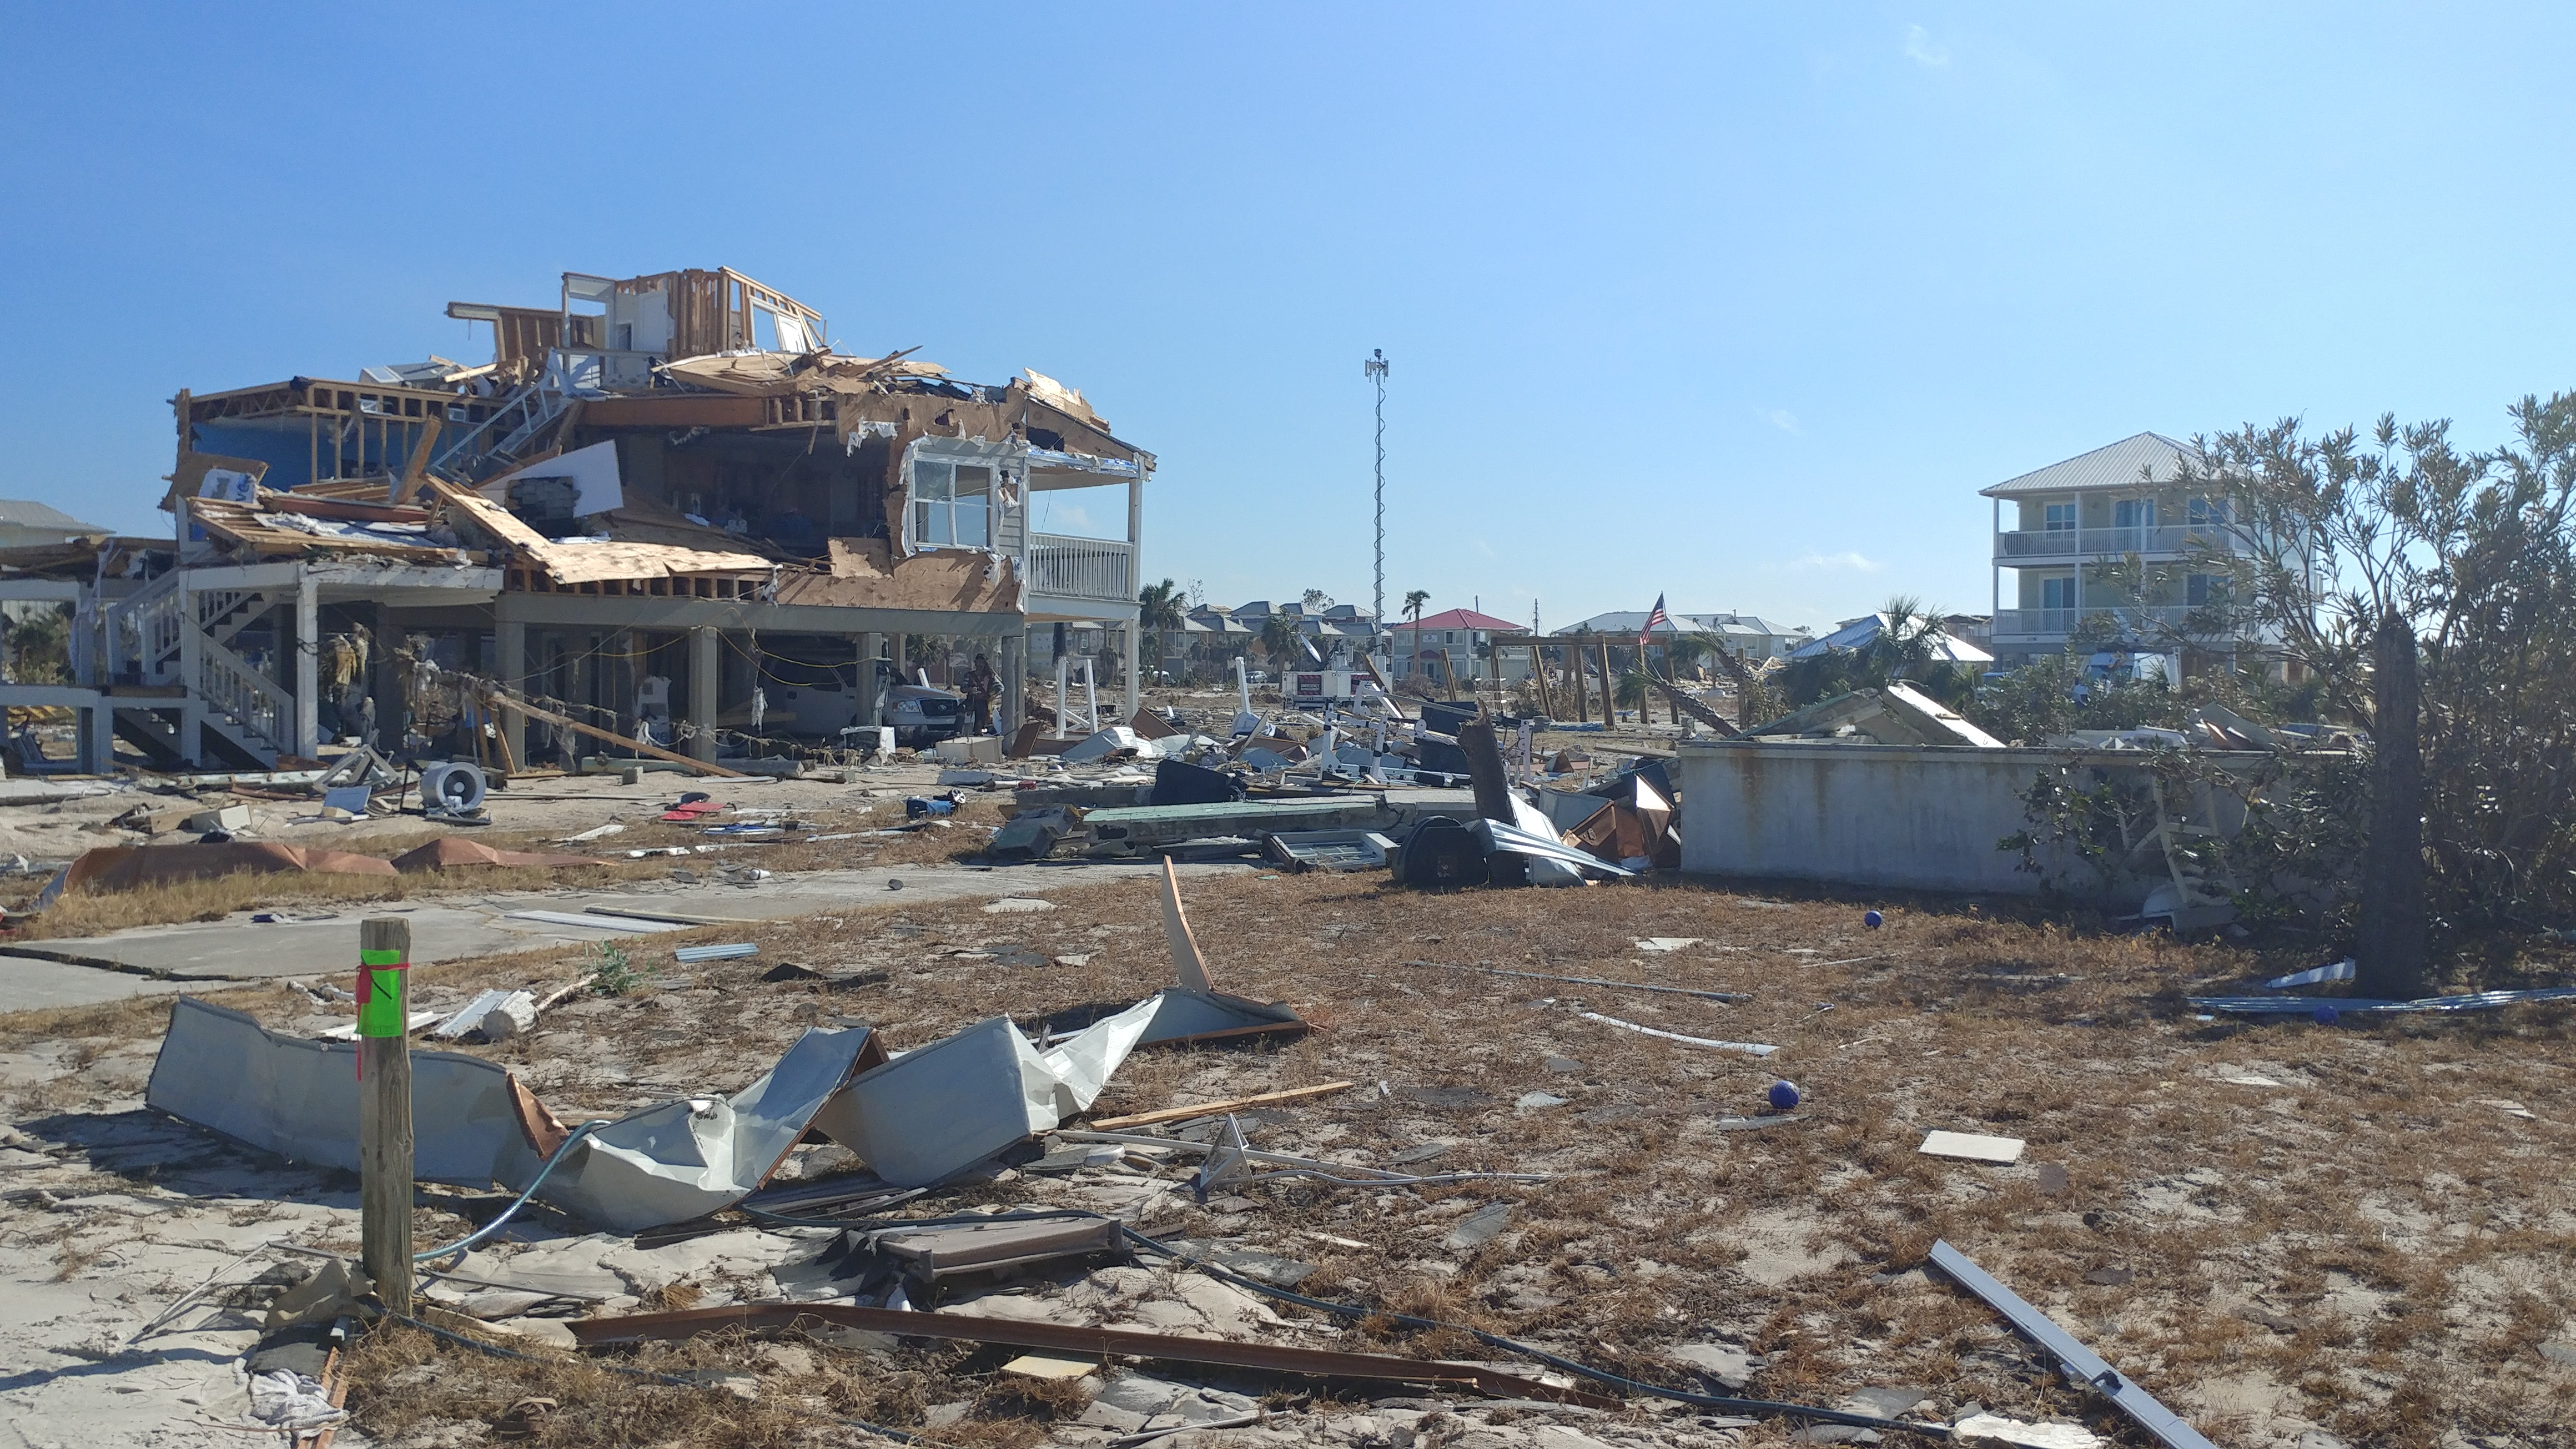 Mexico Beach
2 / 75
Mexico Beach
2 / 75
 Mexico Beach
3 / 75
Mexico Beach
3 / 75
 Mexico Beach
4 / 75
Mexico Beach
4 / 75
 Mexico Beach
5 / 75
Mexico Beach
5 / 75
 Mexico Beach
6 / 75
Mexico Beach
6 / 75
 Mexico Beach
7 / 75
Mexico Beach
7 / 75
 Mexico Beach
8 / 75
Mexico Beach
8 / 75
 Mexico Beach
9 / 75
Mexico Beach
9 / 75
 Mexico Beach
10 / 75
Mexico Beach
10 / 75
 Mexico Beach
11 / 75
Mexico Beach
11 / 75
 Mexico Beach
12 / 75
Mexico Beach
12 / 75
 Mexico Beach
13 / 75
Mexico Beach
13 / 75
 Mexico Beach
14 / 75
Mexico Beach
14 / 75
 Mexico Beach
15 / 75
Mexico Beach
15 / 75
 Panama City
16 / 75
Panama City
16 / 75
 Panama City
17 / 75
Panama City
17 / 75
 Panama City
18 / 75
Panama City
18 / 75
 Panama City
19 / 75
Panama City
19 / 75
 Panama City
20 / 75
Panama City
20 / 75
 Panama City
21 / 75
Panama City
21 / 75
 Panama City
22 / 75
Panama City
22 / 75
 Panama City
23 / 75
Panama City
23 / 75
 Panama City
24 / 75
Panama City
24 / 75
 Panama City
25 / 75
Panama City
25 / 75
 Panama City
26 / 75
Panama City
26 / 75
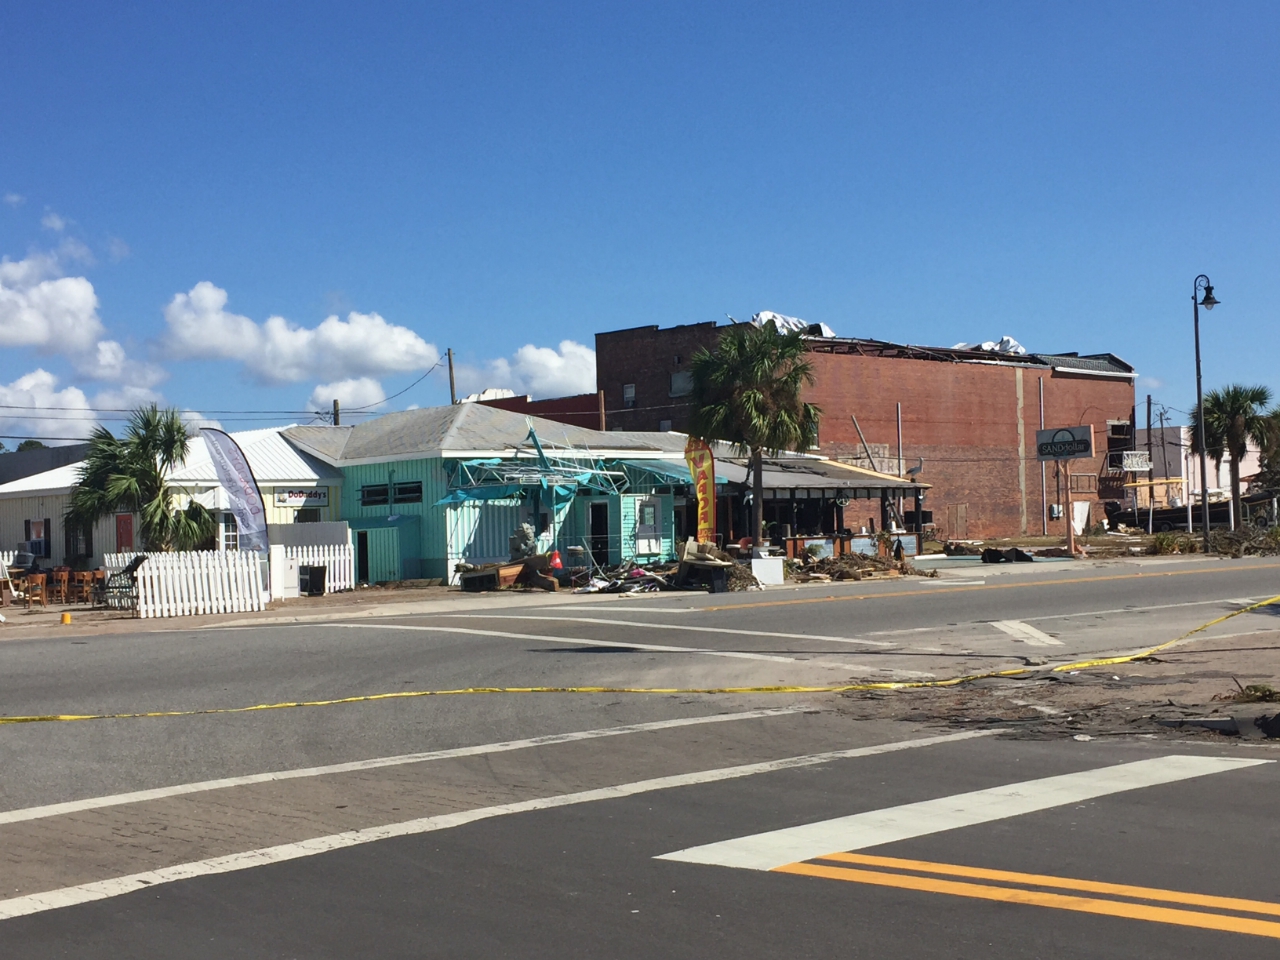
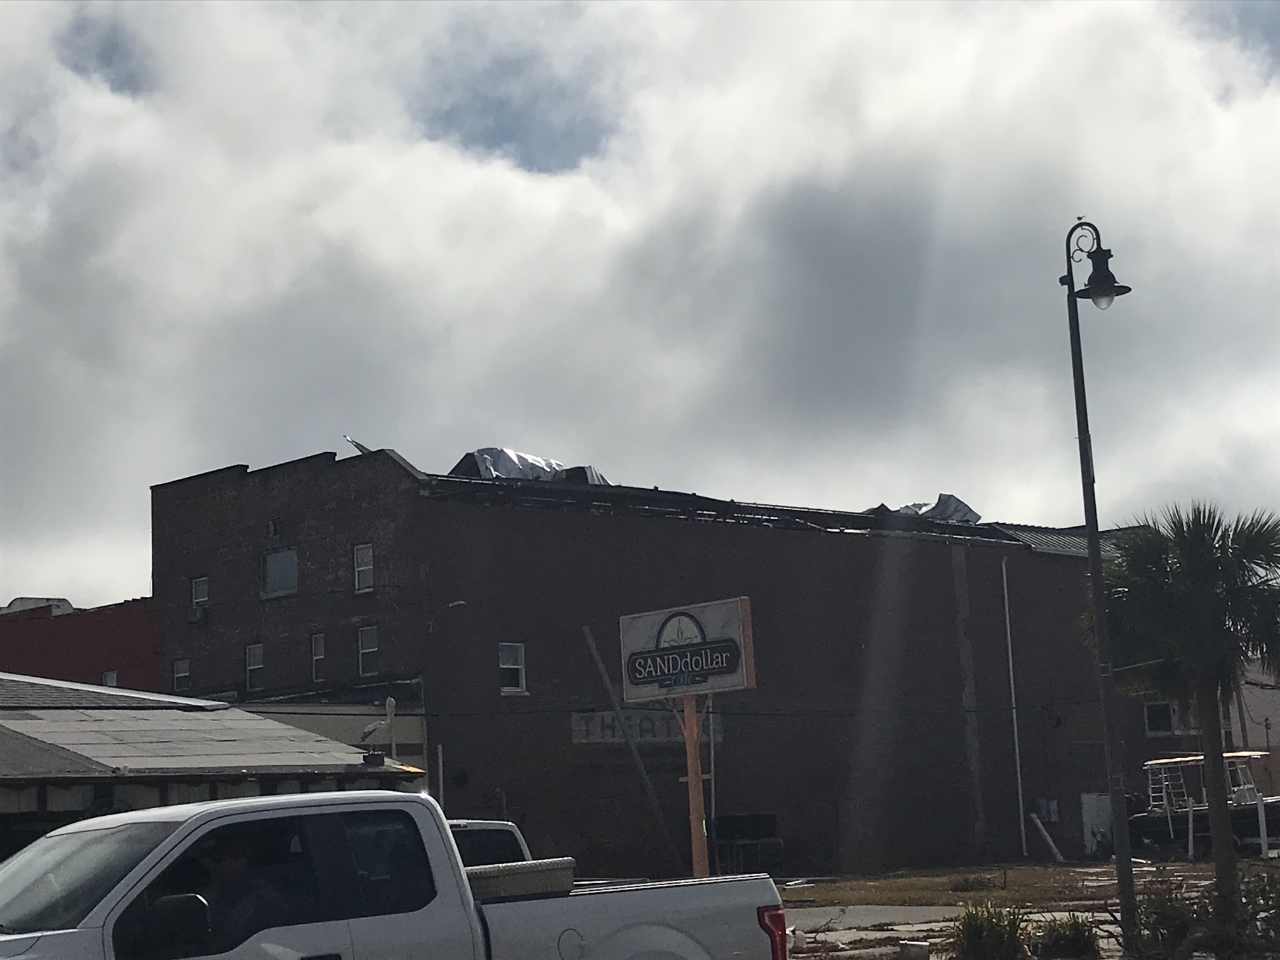
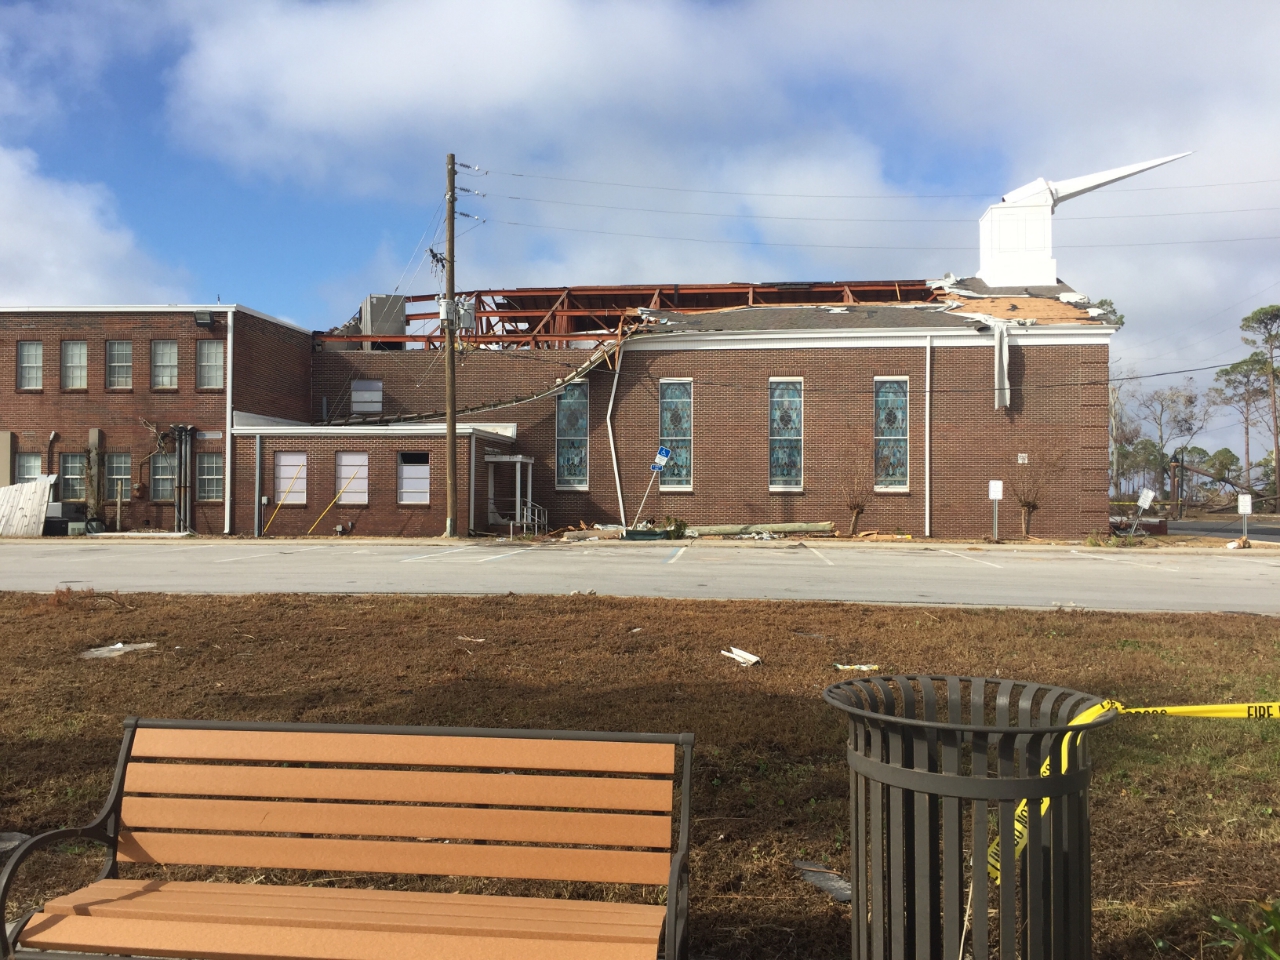
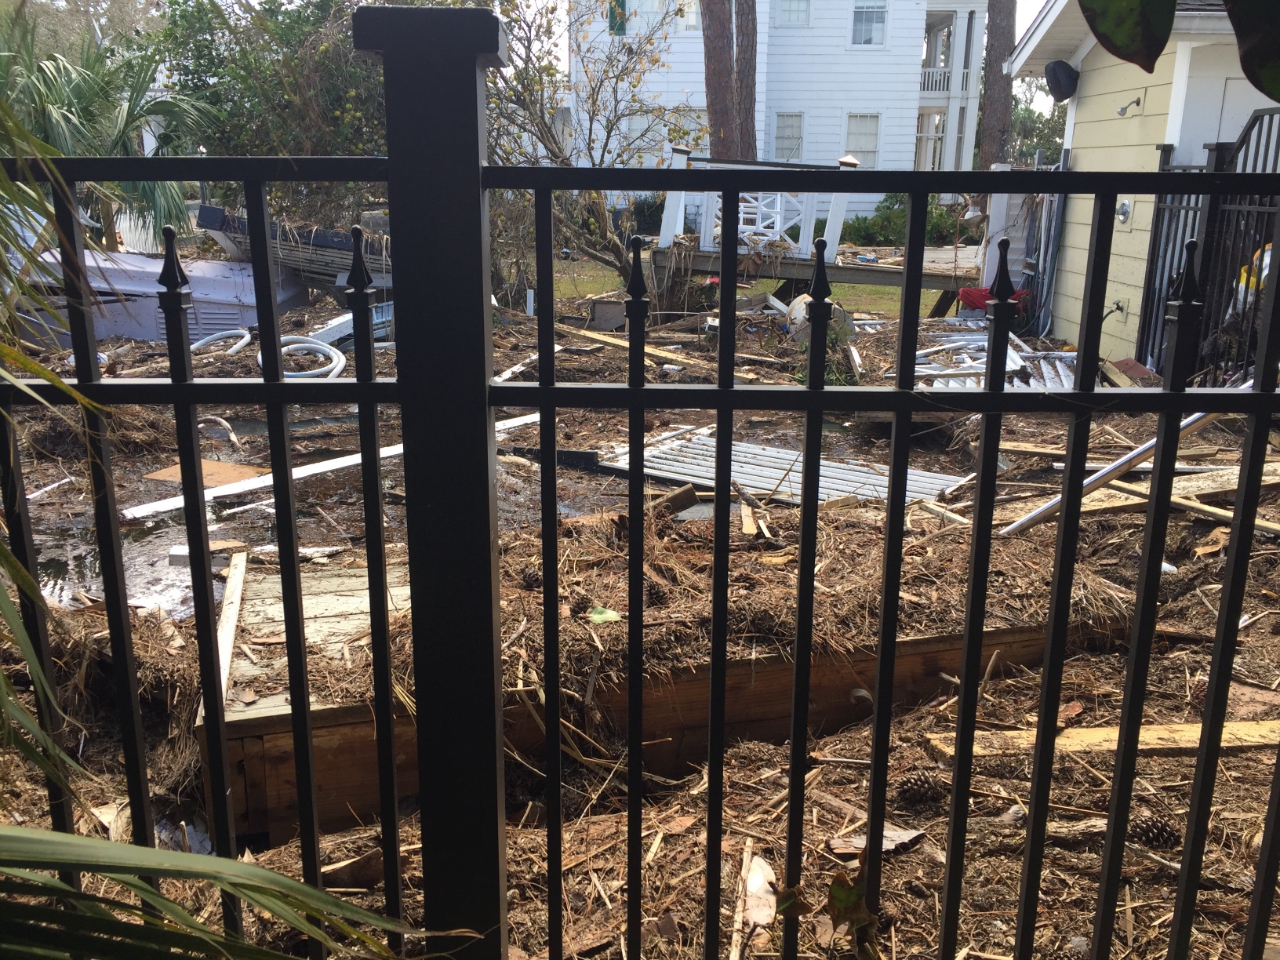
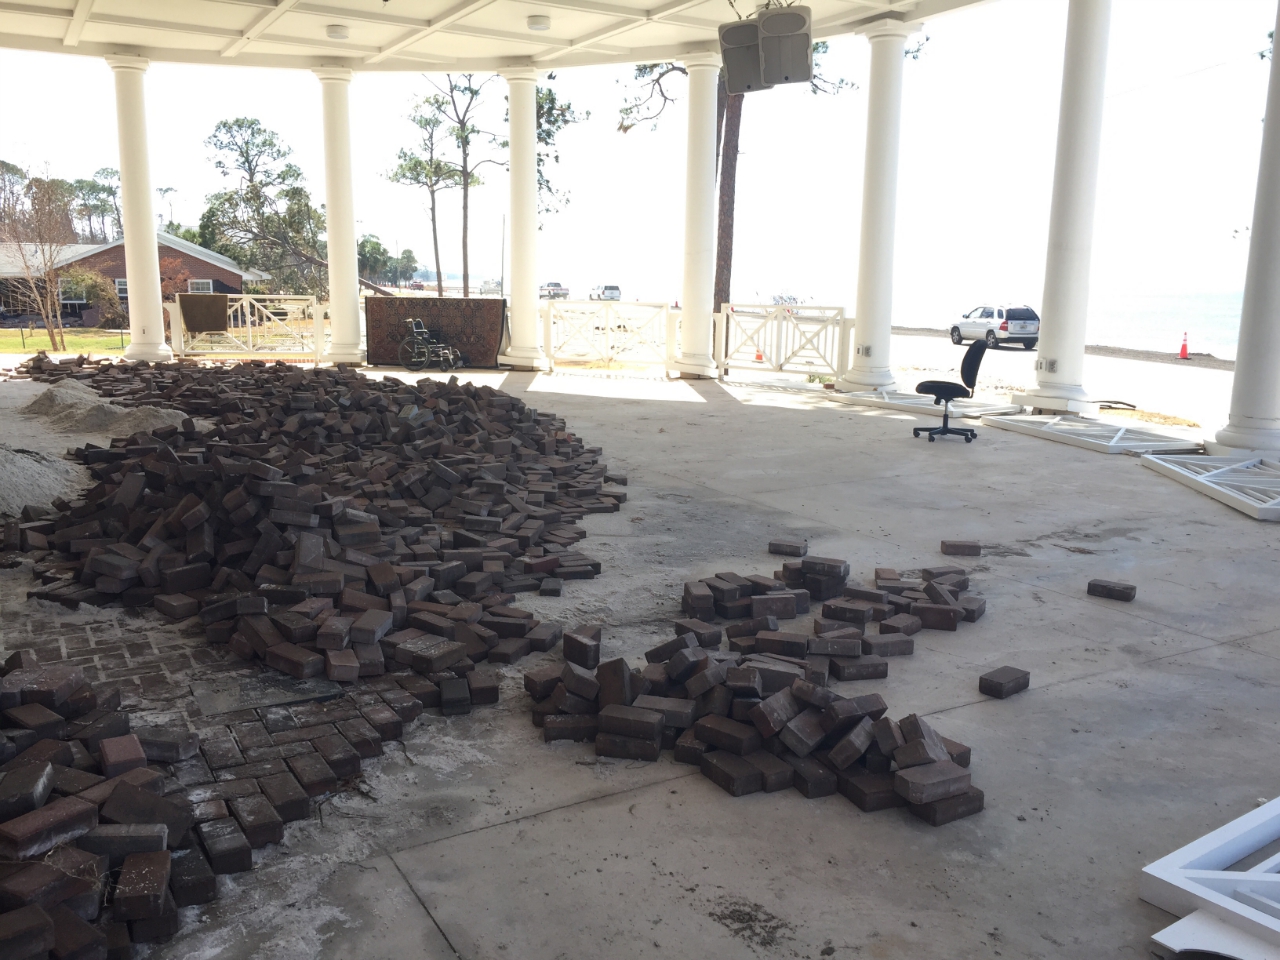
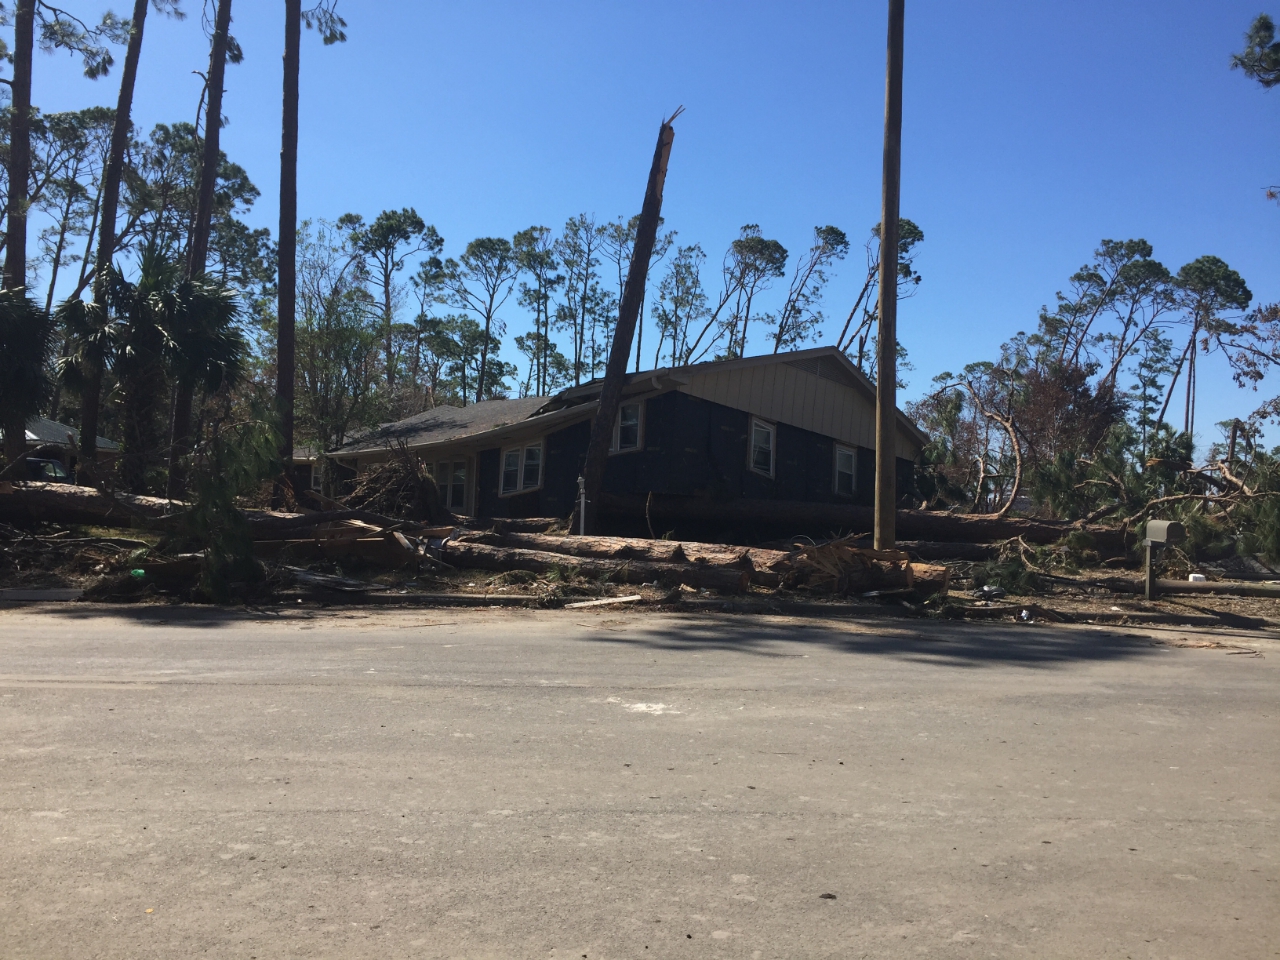
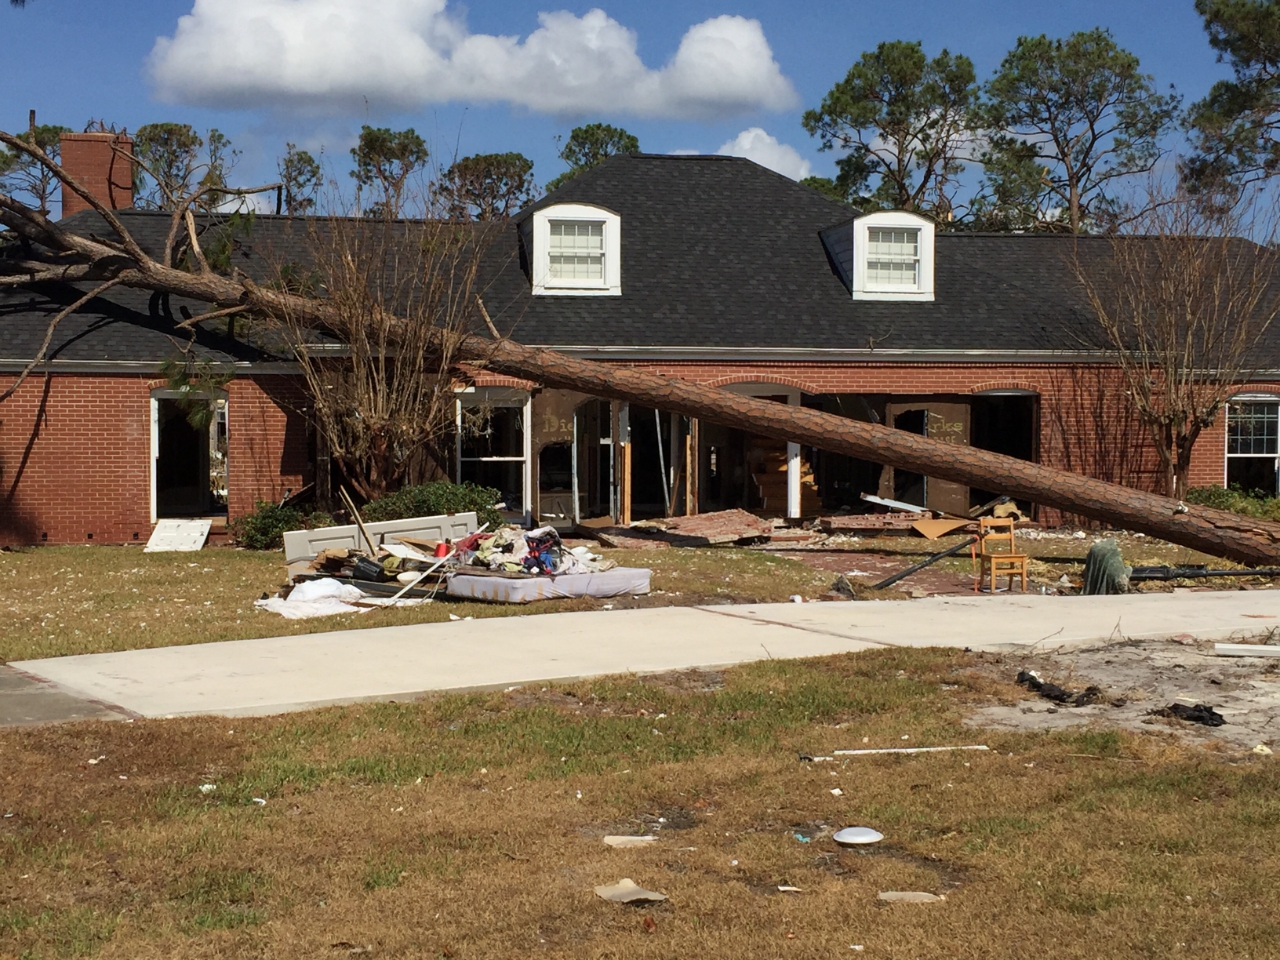
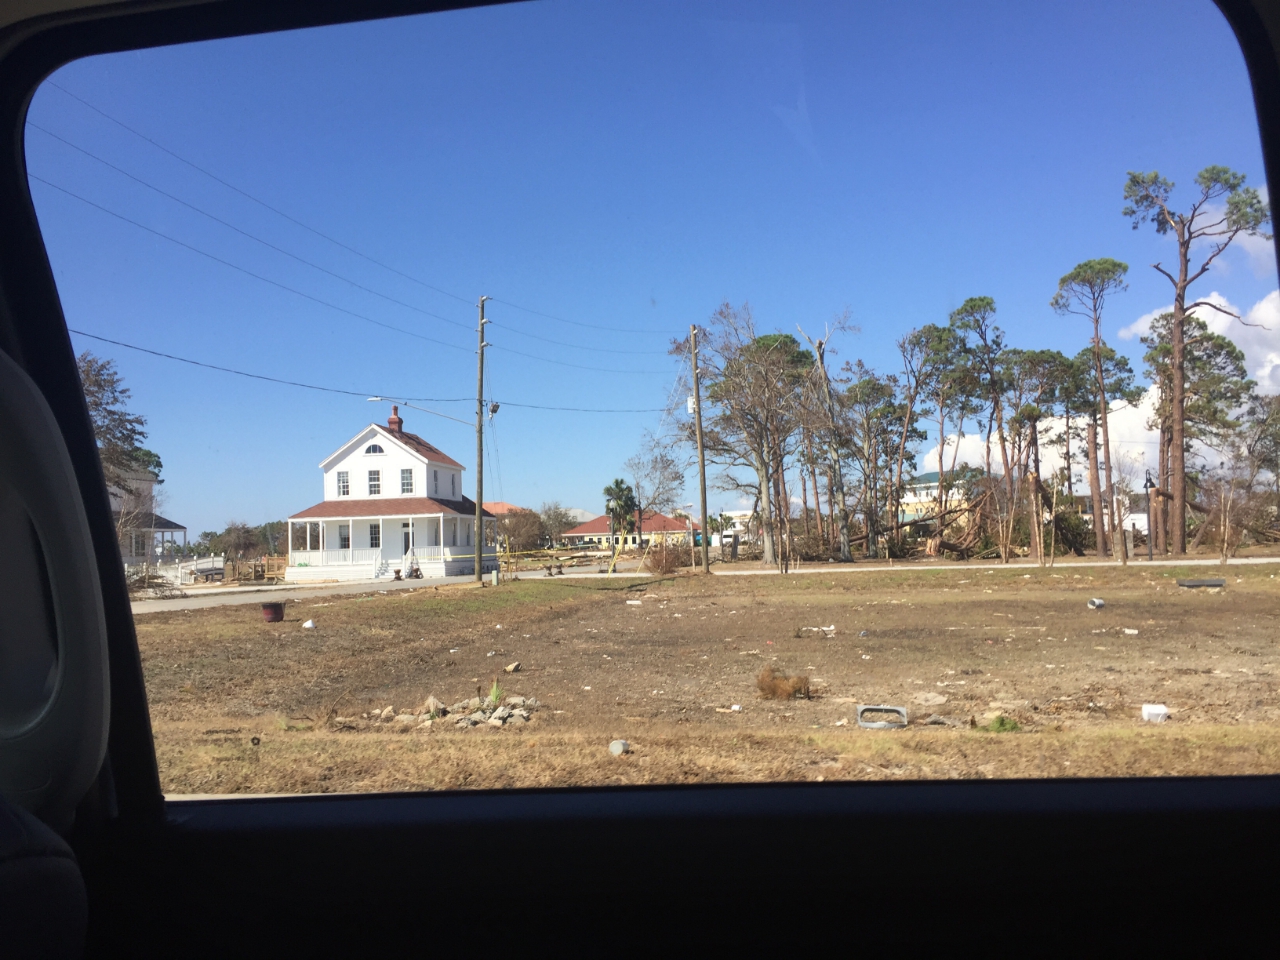 Port St. Joe
27 / 75
Port St. Joe
27 / 75
 Port St. Joe
28 / 75
Port St. Joe
28 / 75
 Port St. Joe
29 / 75
Port St. Joe
29 / 75
 Port St. Joe
30 / 75
Port St. Joe
30 / 75
 Port St. Joe
31 / 75
Port St. Joe
31 / 75
 Port St. Joe
32 / 75
Port St. Joe
32 / 75
 Port St. Joe
33 / 75
Port St. Joe
33 / 75
 Port St. Joe
34 / 75
Port St. Joe
34 / 75
 Tyndall Air Force Base
35 / 75
Tyndall Air Force Base
35 / 75
 St. George Island
36 / 75
St. George Island
36 / 75
 St. George Island
37 / 75
St. George Island
37 / 75
 St. George Island
38 / 75
St. George Island
38 / 75
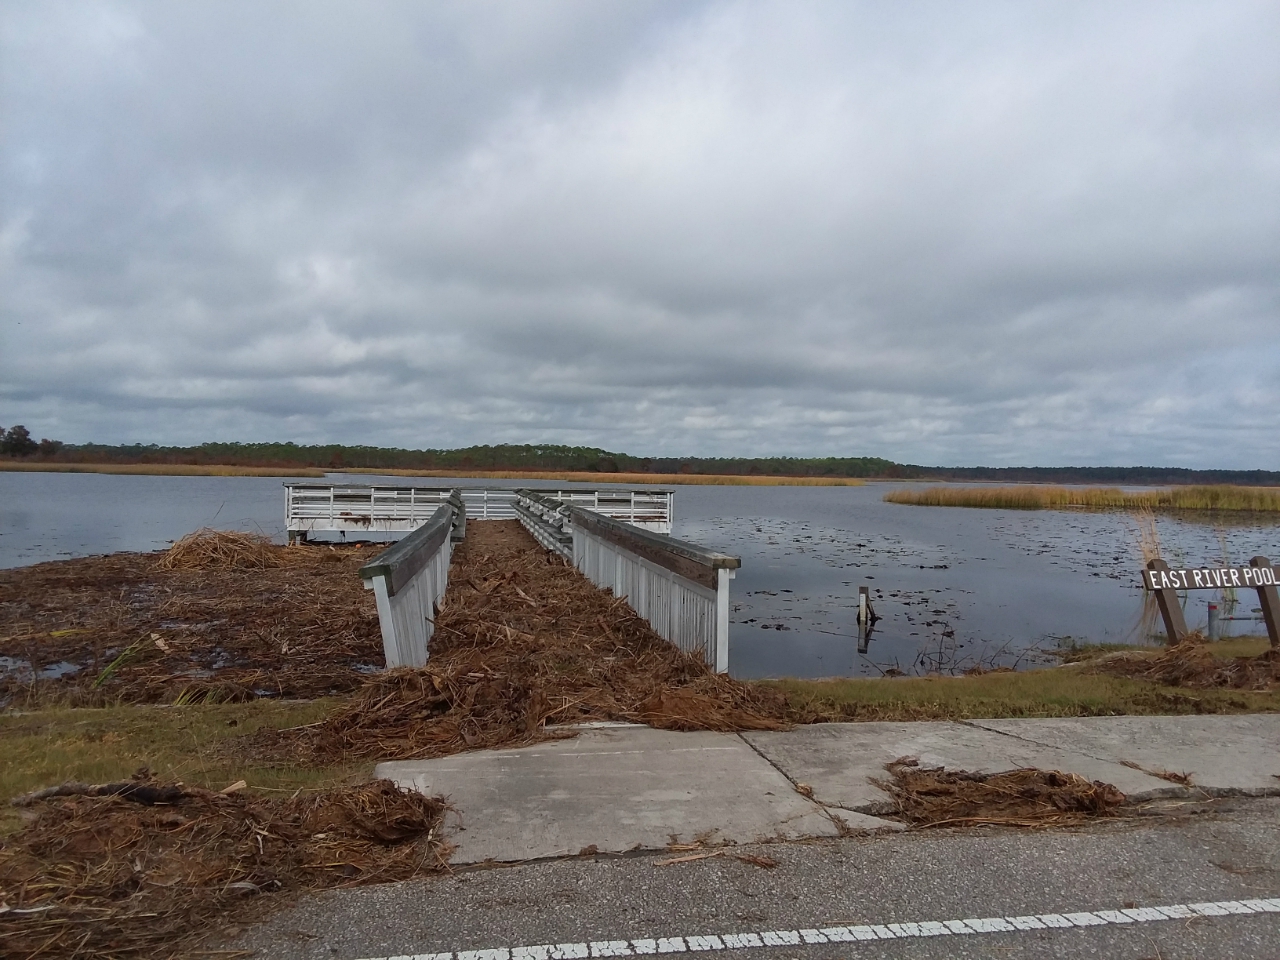
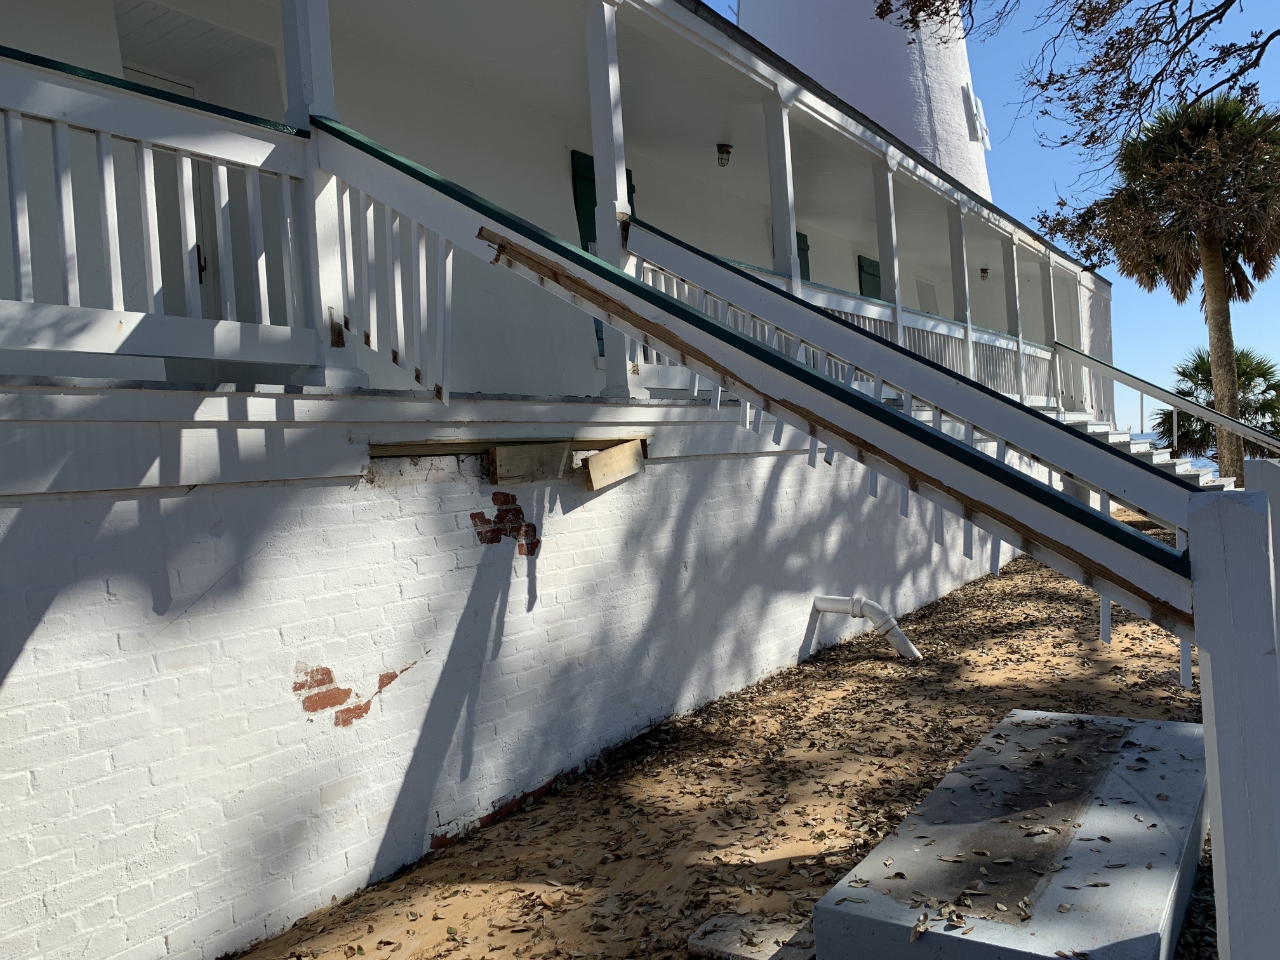 St. Marks
39 / 75
St. Marks
39 / 75
 St. Marks
40 / 75
St. Marks
40 / 75
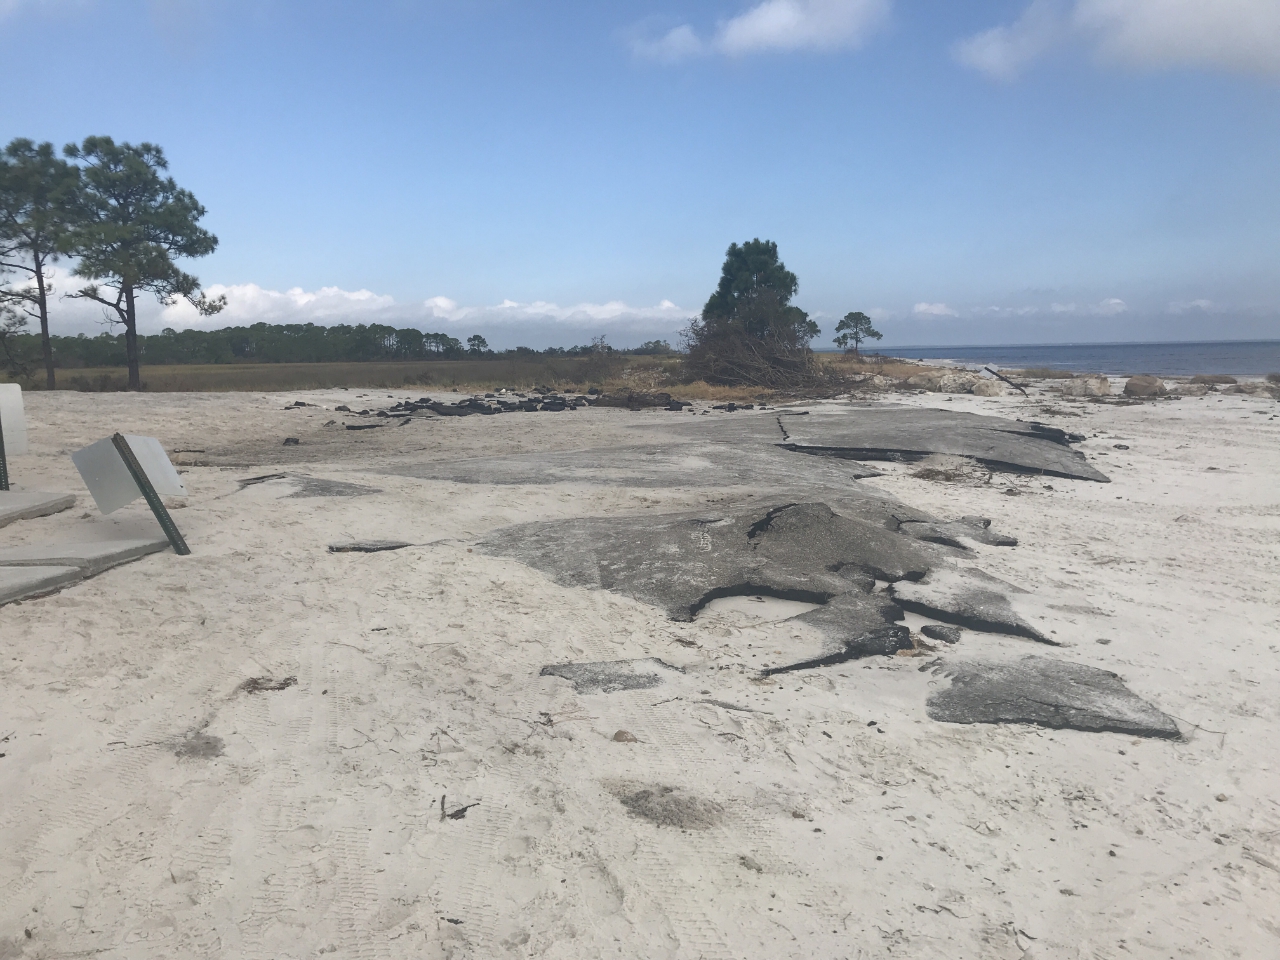 Marshes Sands Beach
41 / 75
Marshes Sands Beach
41 / 75
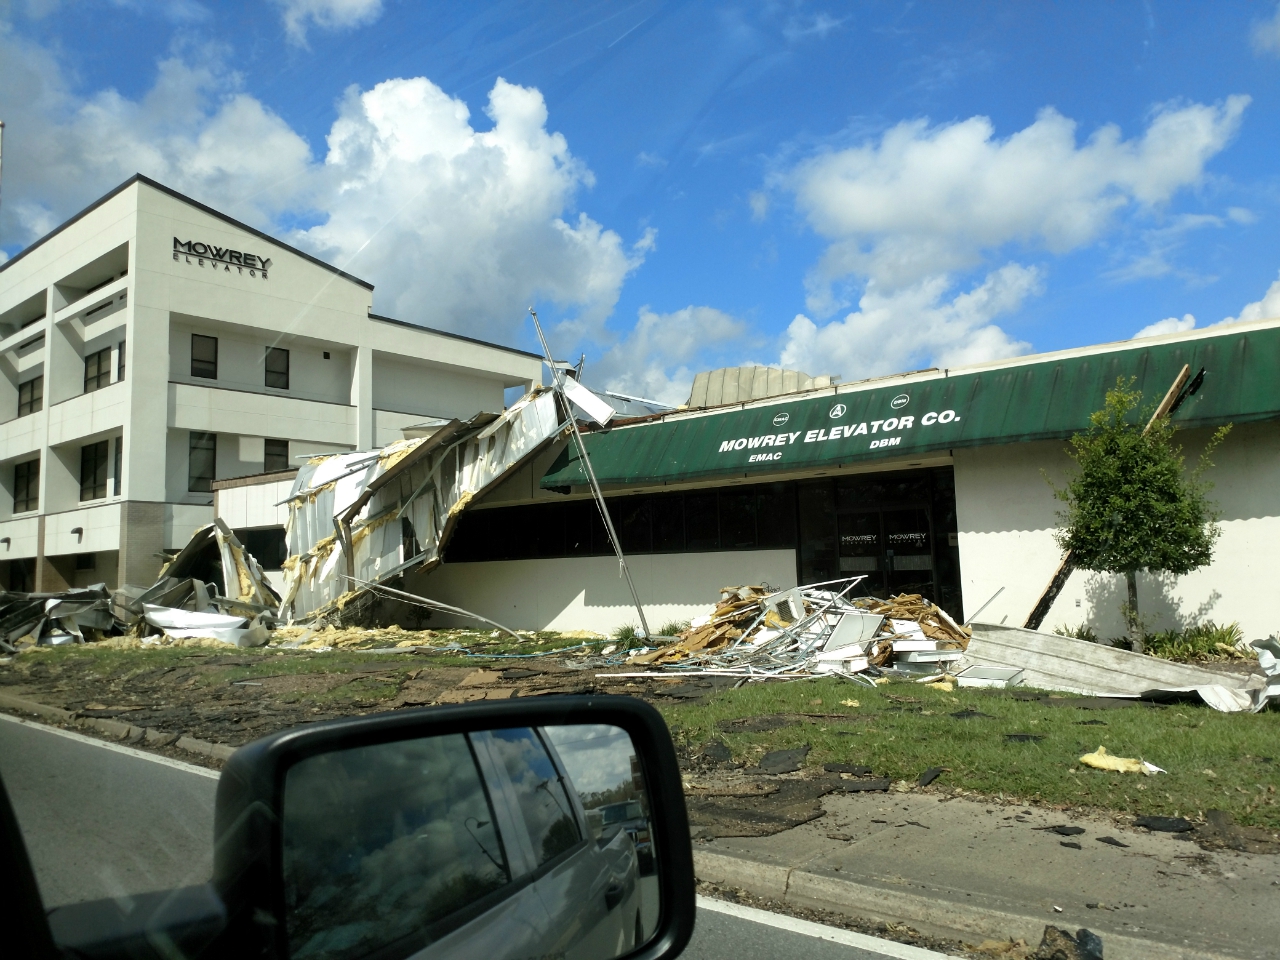 Marianna
42 / 75
Marianna
42 / 75
 Marianna
43 / 75
Marianna
43 / 75
 Marianna
44 / 75
Marianna
44 / 75
 Marianna
45 / 75
Marianna
45 / 75
 Lynn Haven
46 / 75
Lynn Haven
46 / 75
 Lynn Haven
47 / 75
Lynn Haven
47 / 75
 Eastpoint
48 / 75
Eastpoint
48 / 75
 Apalachicola
49 / 75
Apalachicola
49 / 75
 Apalachicola
50 / 75
Apalachicola
50 / 75
 Apalachicola
51 / 75
Apalachicola
51 / 75
 Apalachicola
52 / 75
Apalachicola
52 / 75
 Alligator Point
53 / 75
Alligator Point
53 / 75
 Alligator Point
54 / 75
Alligator Point
54 / 75
 Alligator Point
55 / 75
Alligator Point
55 / 75
 Alligator Point
56 / 75
Alligator Point
56 / 75
 Alligator Point
57 / 75
Alligator Point
57 / 75
 Blountstown
58 / 75
Blountstown
58 / 75
 Blountstown
59 / 75
Blountstown
59 / 75
 Blountstown
60 / 75
Blountstown
60 / 75
 Chattahoochee
61 / 75
Chattahoochee
61 / 75
 Chattahoochee
62 / 75
Chattahoochee
62 / 75
 Chattahoochee
63 / 75
Chattahoochee
63 / 75
 Chattahoochee
64 / 75
Chattahoochee
64 / 75
 Bainbridge
65 / 75
Bainbridge
65 / 75
 Bainbridge
66 / 75
Bainbridge
66 / 75
 Bainbridge
67 / 75
Bainbridge
67 / 75
 Bainbridge
68 / 75
Bainbridge
68 / 75
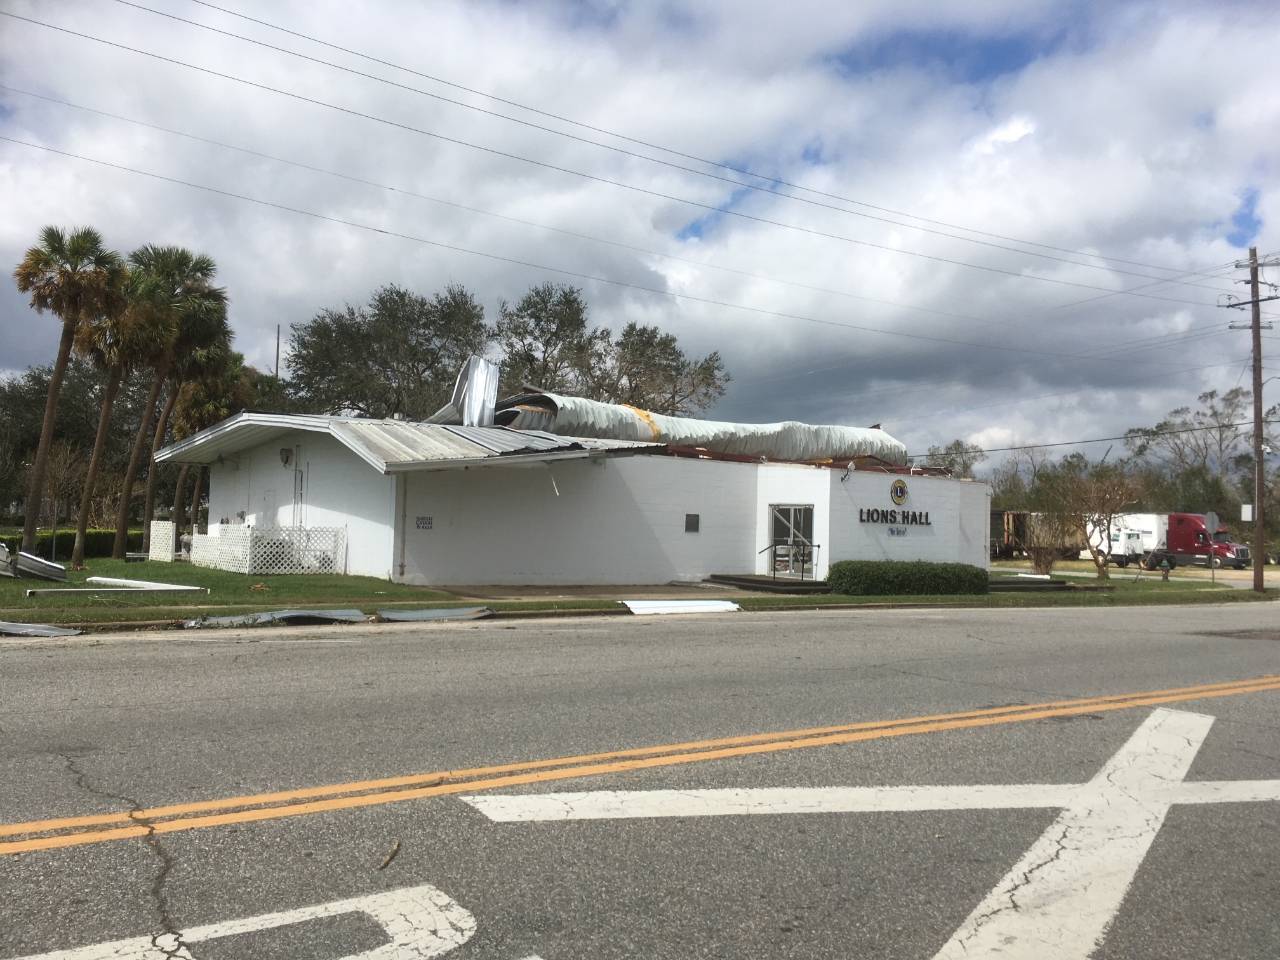
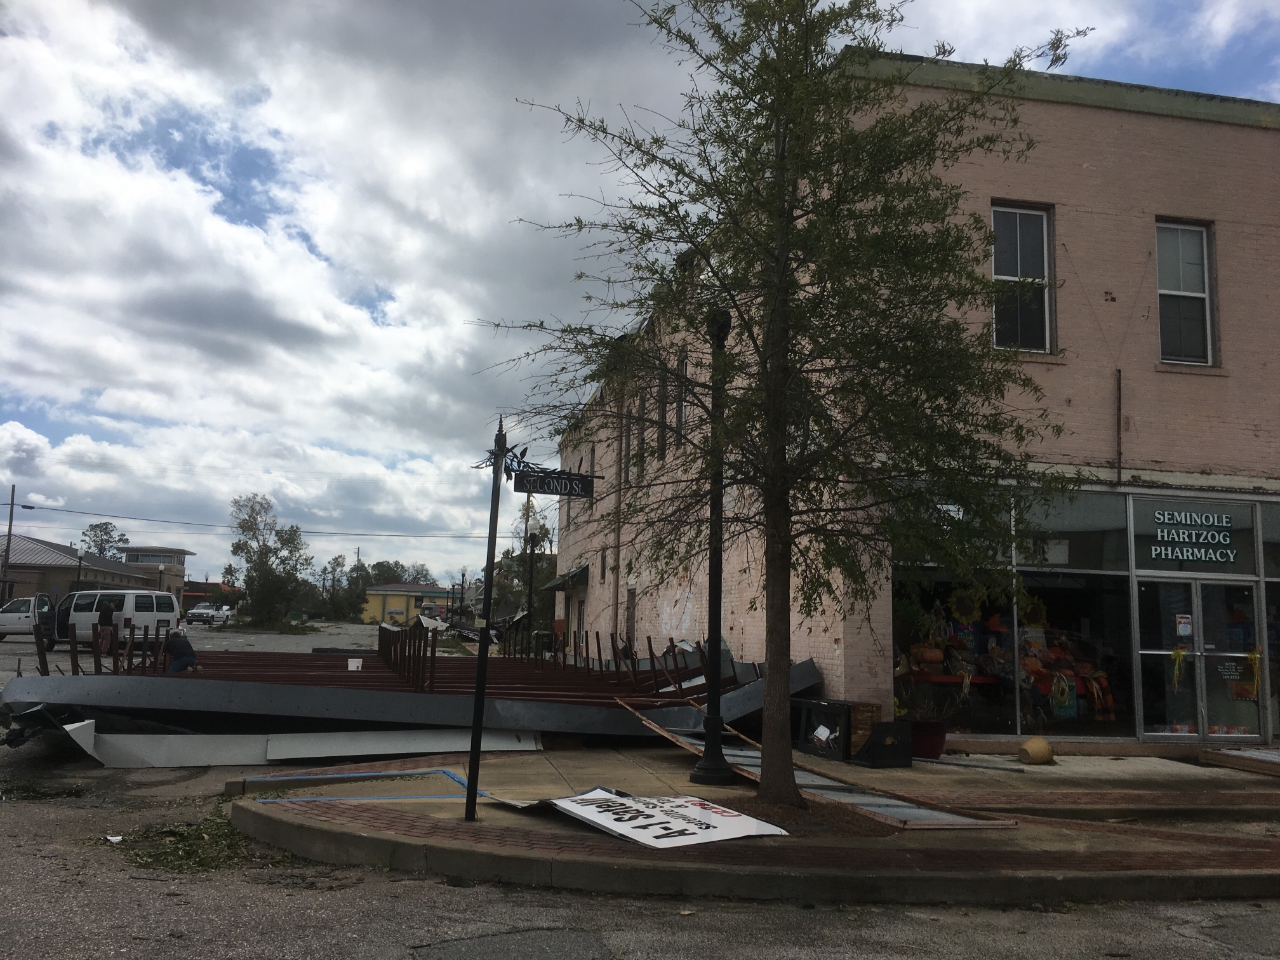
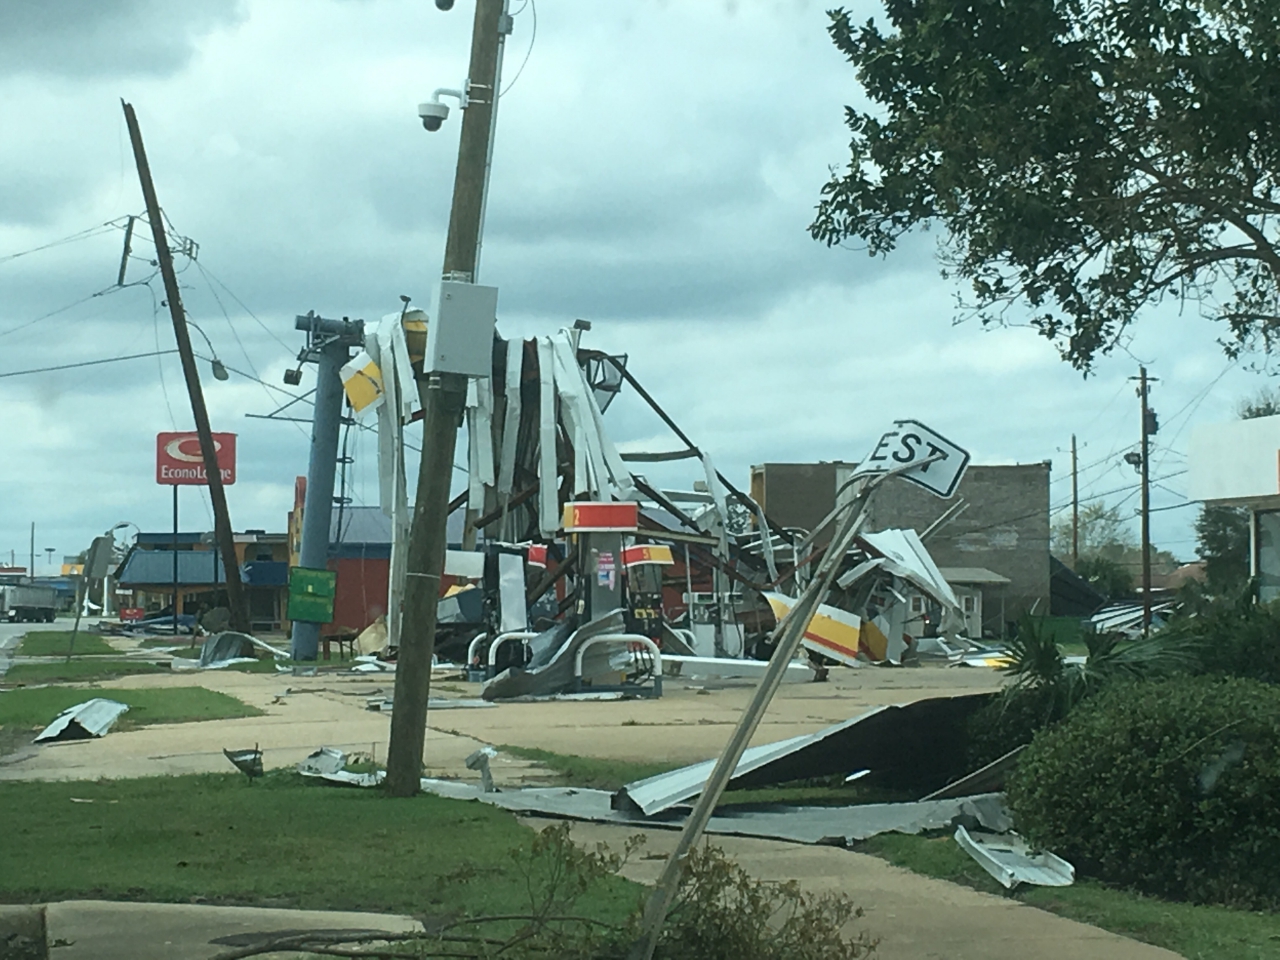
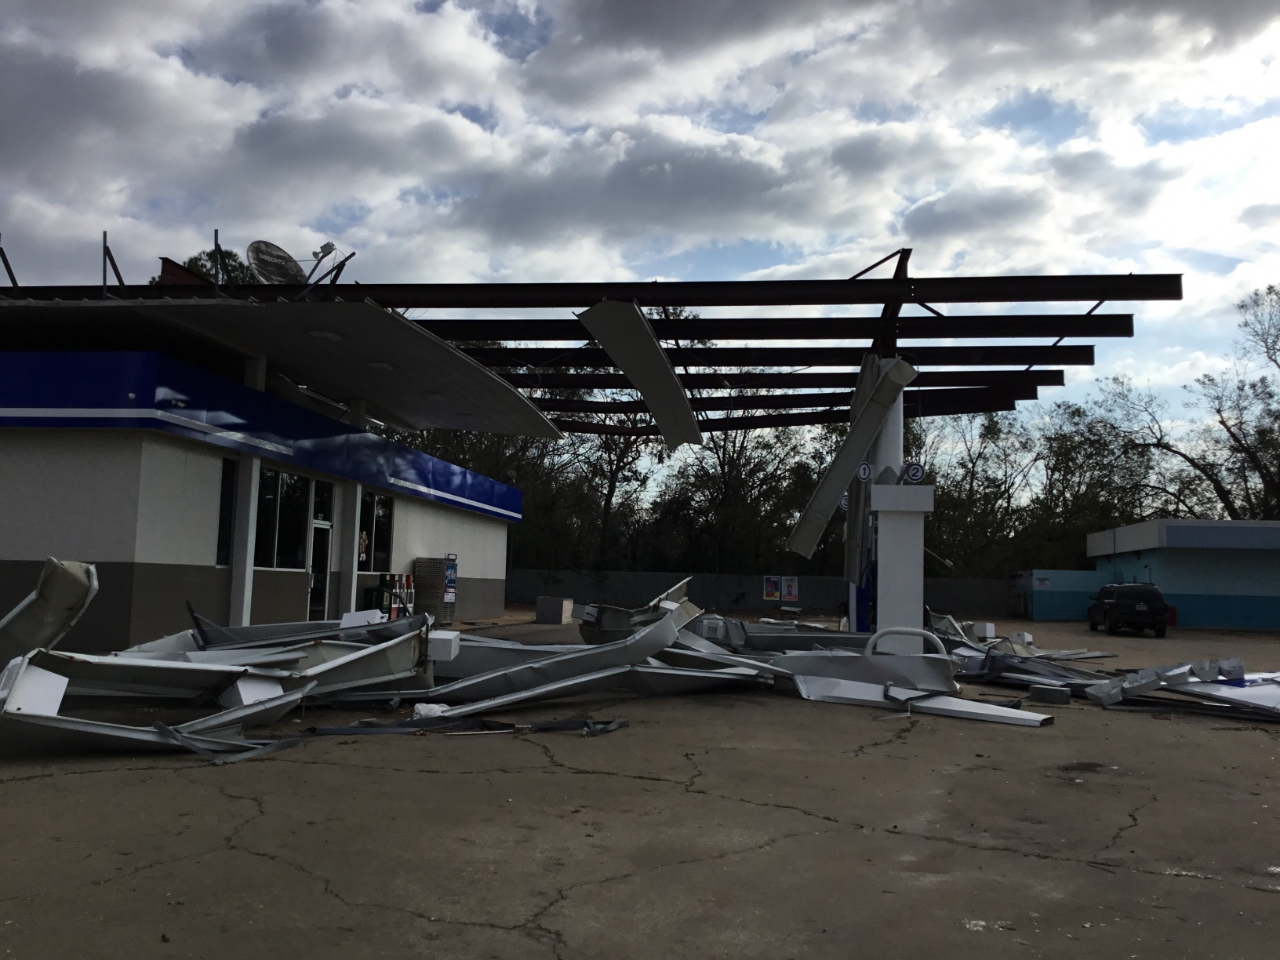 Donalsonville
69 / 75
Donalsonville
69 / 75
 Donalsonville
70 / 75
Donalsonville
70 / 75
 Donalsonville
71 / 75
Donalsonville
71 / 75
 Donalsonville
72 / 75
Donalsonville
72 / 75
 Donalsonville
73 / 75
Donalsonville
73 / 75
 Donalsonville
74 / 75
Donalsonville
74 / 75
 Albany
❮ ❯75 / 75
Albany
❮ ❯75 / 75
 Albany
Southeast Radar Loop
Long Range Radar Loop (EVX)
Short Range Radar Loop (EVX)
Visible Satellite
Infrared Satellite
Mexico Beach Drone Footage
Courtesy of FSU Disaster Incident Research TeamTyndall Air Force Base Damage
Courtesy of Tyndall Air Force Base
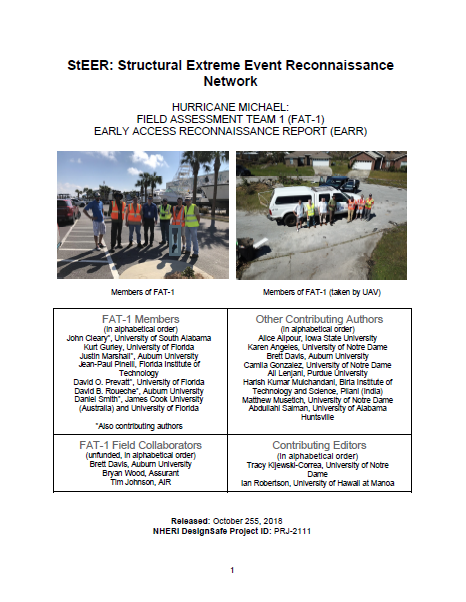
Early Access Reconnaissance Report
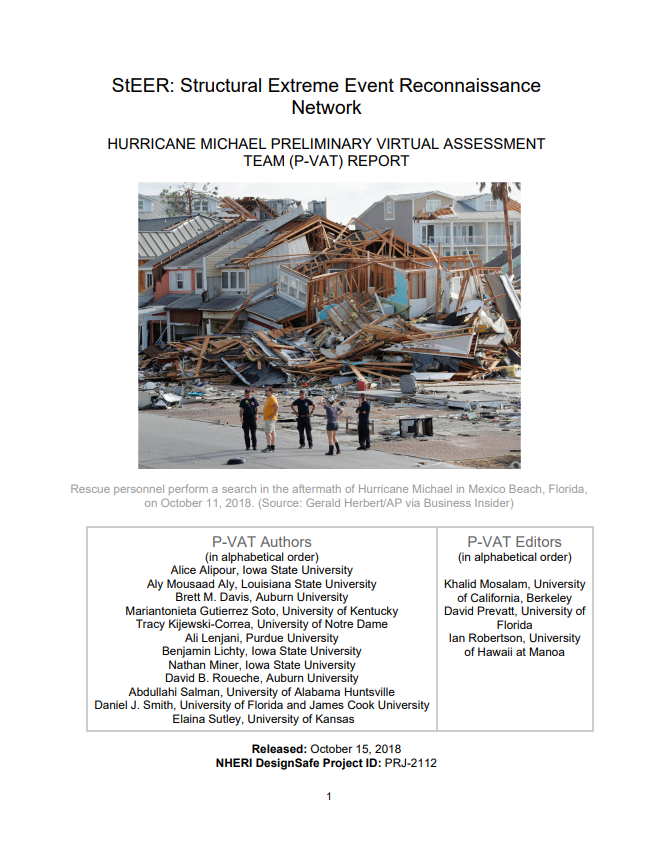
Preliminary Virtual Assessment Team Report


 Follow us on YouTube