| El Niño and its Effect on the Southeast U.S. |
In the central and eastern Pacific, there is a lot of year-to-year variability. Some years are much warmer and wetter (El Niño), and some years are much cooler and drier (La Niña). We have entered an El Niño phase of the ENSO (El Niño/Southern Oscillation) cycle. With El Niño present across the equatorial Pacific Ocean,
http://www.cpc.ncep.noaa.gov/products/precip/CWlink/MJO/enso.shtml
For latest Seasonal Outlooks, refer to NOAA's Climate Prediction Center:
El Niño has global impacts: some negative, some positive. Even for Florida and the Southeast U.S., some El Niño influences are beneficial; some not so beneficial.
Typical El Niño impacts for the Southeast U.S. during winter are shown in Figure 1. The Gulf Coast generally sees cooler and wetter conditions, not because of numerous arctic outbreaks, but because of the stronger influence of the subtropical jet stream. Storm tracks are farther south on average, producing more clouds, rain, and severe weather.
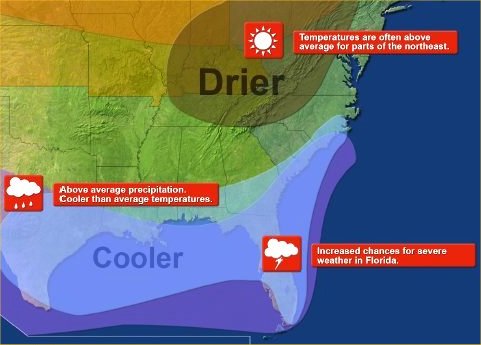
Figure 1. El Niño impacts for the Southeast United States.
Winter Precipitation
Florida winter rainfall distributions are explained in Figure 2. The plots are box and whisker diagrams where the maximum and minimum amounts are the top and bottom of the diagrams, and the box describes the middle 33% of the cases. In all four Florida locations, the rainfall distribution is higher in the El Niño years.

Figure 2. Box and Whisker plots of Florida rainfall during La Niña, Neutral, and El Niño Phases.
Figure 3 shows the El Niño winter rainfall anomalies for the continental United States. Many portions of the U.S. typically have near normal rainfall under El Niño conditions. However, the Ohio Valley is below normal, and the southern tier of States from California to Florida is above normal with some spots averaging as much as 5 inches above normal. Storms making landfall in California and storms developing in the Gulf of Mexico are the culprits.
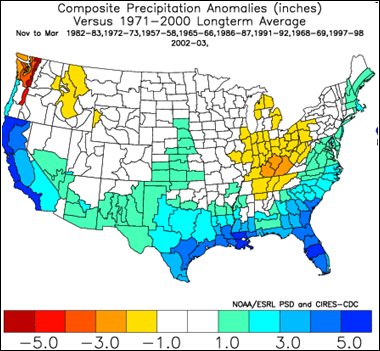
Figure 3. November to March El Niño precipitation anomalies versus long term average.
Winter Temperatures
With La Niña conditions, normally large amplitude troughs and ridges across the Pacific and North America can be expected, which results in more Arctic outbreaks, whereas in El Niño, flow is more zonal (west to east) across the Pacific and North America, which produces less Arctic outbreaks. Therefore, it is, on the average, warmer across the northern tier of the United States in La Niña winter, and because the subtropical jetstream is more dominant in El Ni?o winters, this produces more low pressure systems, rainfall, and clouds, and it is generally cooler in the southern U.S. Figure 4 graphically describes the temperature distribution across the U.S. during El Niño.

Figure 4. November to March El Niño temperature anomalies versus longterm average.
Severe Weather
With the influence of the subtropical jet stream and storm tracks being farther south, some of the negative aspects of El Niño will arise this winter. It is natural to assume that severe weather will also occur farther south. It does!! Figure 5 shows a comparison of storm tracks during El Niño versus La Niña years.

Figure 5. Winter storm tracks in El Niño versus La Niña years.
The El Niño severe weather signal is most pronounced in central and south Florida. Figure 6 illustrates this effect. Tornado reports from NOAA's Storm Data for the period, 1950-2009, shows that, on average, around 15 tornadoes can be expected per year under El Niño conditions, nearly twice that of Neutral and La Niña years. We have broken down El Niño into Weak (WE), Moderate (ME), and Strong El Niño (SE). Under a strong El Niño year, the average is 20 tornado events per year. An event is decribed in the following manner. For example, if there were 5 tornadoes reported in a county on a particular day, it was recorded as one event. Therefore, there will be more reported tornadoes than this figure depicts. The bottom line is, in central and south Florida, the tornado threat in an El Niño year is significantly greater.
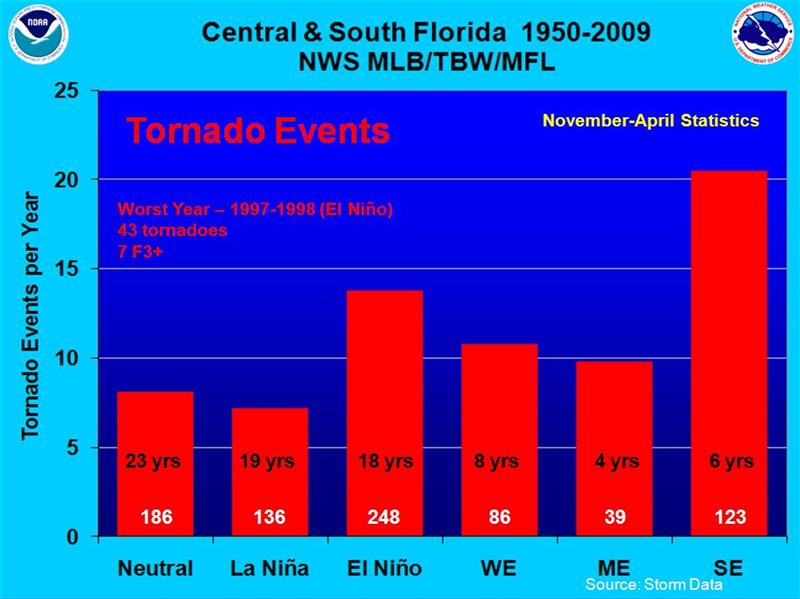
Figure 6. Tornado Events between November and April during Neutral, La Niña, and El Niño years for the period 1950 to 2009 in Central and South Florida (NWS Melbourne, Tampa and Miami Warning Areas).
The El Niño tornado signal is not as pronounced farther north as in central and south Florida. In north Florida, southeast Alabama, and south Georgia, the threat is always there during the winter, producing between 10 and 15 tornadoes events per year. Our severe weather season is normally from Christmas to late spring.
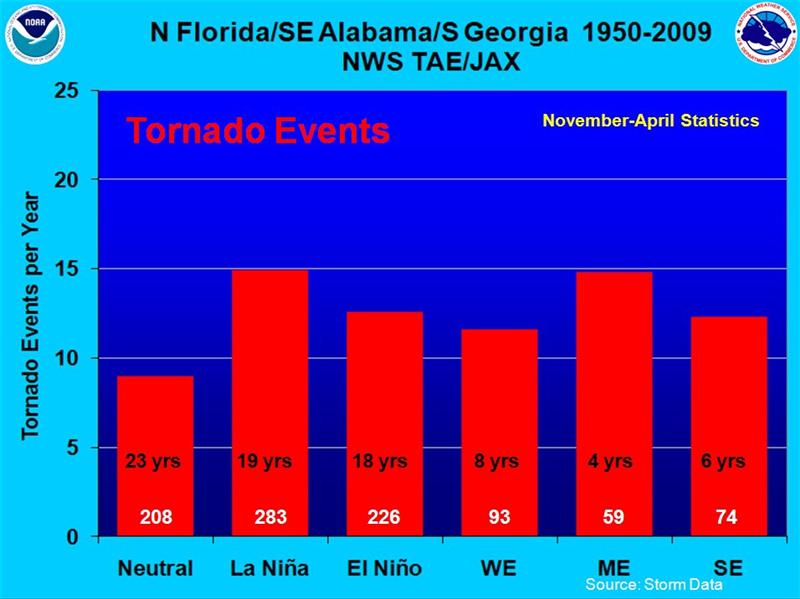
Figure 7. Tornado Events between November and April during Neutral, La Niña, and El Niño years for the period 1950 to 2009 in the NWS Tallahassee and Jacksonville Warning Areas.
Since the current structure of the National Weather Service has been in place since the early to mid 1990s, we examine only significant weather events since 1992 in Figure 8. The definition of a significant weather event is that there must be at least 20 storm reports and/or the report of a (E)F2 tornado or greater on a particular day in a NWS forecast office area. The four graphs show Neutral (7 years), La Niña (5 years), El Niño (6 years), and the devastating El Niño of 1997-98. Notice that not all El Niño years are alike with a normal of 2-3 events per year while 1997-98 had seven or greater events in central Florida. Notice that the tri-state area of Florida, Georgia, and Alabama averages around 3 events per year whether it is El Niño or La Niña. Neutral years could be a little less.

Figure 8. Significant Weather Events between November and April during Neutral, La Niña, and El Niño years for the period 1992 to 2009.
Flooding
With increased rainfall comes an increased possibility of flooding. Figure 9 is a figure from research conducted by the Southeast River Forecast Center (SERFC) showing yearly river flooding events across all of the SERFC area (top) and river flooding across Florida (bottom) for 1975-2006. Notice the flooding maximum in the early part of the year (week 9-11, late Feb-early Mar) on both graphs. In Florida, there is a second peak in September and October, which is related to tropical events. Reiterating, the more rainfall, the increased chances of flooding.
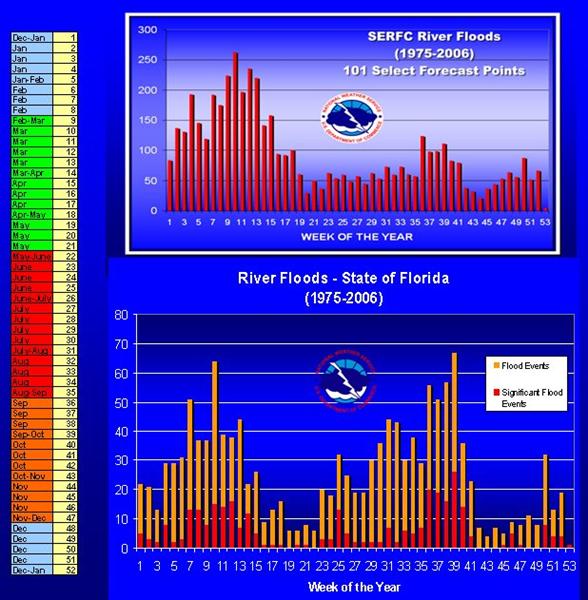
Figure 9. Yearly river flooding event time series separated by the week of the year for the period 1975-2006. Top graph is for all of the SERFC area. Bottom graph is Florida river flooding events (prepared by the Southeast River Forecast Center (SERFC)).
In Figure 10, Florida river flood events are compared to various phases of the ENSO (El Niño/Southern Oscillation) cycle. El Niño has averaged 23.3 flood events per year with a majority of the river flooding events occurring during the strong El Niño phase. During the Neutral phase, 4.9 events have occurred per year, whereas only 20 events have occurred in Florida during La Niña (8 years).

Figure 10. River flooding events (1975-2006) per year separated according to Strong El Niño (SE), Moderate El Niño (ME), Weak El Niño (WE), Neutral (N), Weak La Niña, (WL), Moderate La Niña, (ML), and Strong La Niña, (SL) prepared by the Southeast River Forecast Center (SERFC).


 Follow us on YouTube