| Tropical Storm Andrea Event Summary |
Tropical Storm Andrea was the first tropical cyclone of the 2013 Atlantic hurricane season. The storm developed in the east-central Gulf of Mexico during the late afternoon hours of June 5th and made landfall about 24 hours later in Dixie County, about 10 miles down the coast from Steinhatchee, FL. A Post Tropical Cyclone Report has been issued detailing the rather minimal impacts of Andrea on the NWS Tallahassee county warning area (WFO TAE CWA). Satellite and radar loops of Andrea are available below in Figure 1.
Figure 1. Loops of radar reflectivity from the KTLH doppler radar (top) and the GOES visible satellite (bottom).
One of our senior forecasters, Parks Camp, shared some video (Figure 2) that was taken while vacationing on St. George Island while Andrea churned offshore. The video was taken around 9:00 AM on the day of landfall and shows very rough surf. A stiff wind can be heard in the background. Probably the greatest impact on the area from this tropical storm was attributable to the long duration of onshore swell that cut channels through the offshore sandbars all along the Florida Panhandle gulf coast. The result was several days of strong rip currents that were responsible for multiple rescues and unfortunately several fatalities at area beaches through June 11th.
Figure 2. A video showing rough surf on St. George Island on the morning of June 6, 2013.
Storm surge was relatively minor along the Florida Big Bend coastline, estimated to be around 3 ft in Dixie County. The sea wall was not breached. A more substantial surge was recorded just south of the forecast area at the Cedar Key tide gage. As can be seen in the chart below (Figure 3), the storm tide reached a maximum height of about 6.2 ft above mean low low water (MLLW). It was fortunate that the peak surge of 4.5 ft occurred during the astronomical ebb tide. Otherwise, the storm tide could have been as much as 4 ft higher. The anemometer at this station showed that sustained winds barely reached tropical storm force (Figure 4), but gusts as high as 51 mph (44 kt) were recorded. The maximum wind gust measured within the WFO TAE CWA was 49 mph (43 kt) at Alligator Point, FL. The minimum barometric pressure was just over 998 mb at Cedar Key (Figure 5). The minimum pressure measured within the WFO TAE CWA was 993.4 mb at the Cross City, FL, ASOS.

Figure 3. Chart showing the predicted astronomical tide, observed tide and residual (surge) for the Cedar Key, FL, tide gage for June 6-7, 2013.

Figure 4. Chart showing sustained winds and gusts measured at the Cedar Key, FL, tide gage for June 6-7, 2013.

Figure 5. Chart showing barometric pressure measured at the Cedar Key, FL, tide gage for June 6-7, 2013.
Rainfall totals of 1.5 to 3 inches were common across the eastern portion of the CWA. The maximum measured storm total rainfall was 3.64 inches and occurred at Carrabelle, FL. Note that this is not depicted in Figure 6 below which represents the 24-hr period ending at 12 UTC on June 7th as most of the rain in Franklin County occurred prior to 12 UTC on June 6th. In fact, radar estimates in excess of 6 inches were indicated in some sparsely populated portions of the county in the Apalachicola National Forest (Figure 7). The emergency manager reported 4.5 inches of rain in just 5 hours 2 miles northeast of Carrabelle during the pre-dawn hours of June 6th. No flooding was reported during this event.
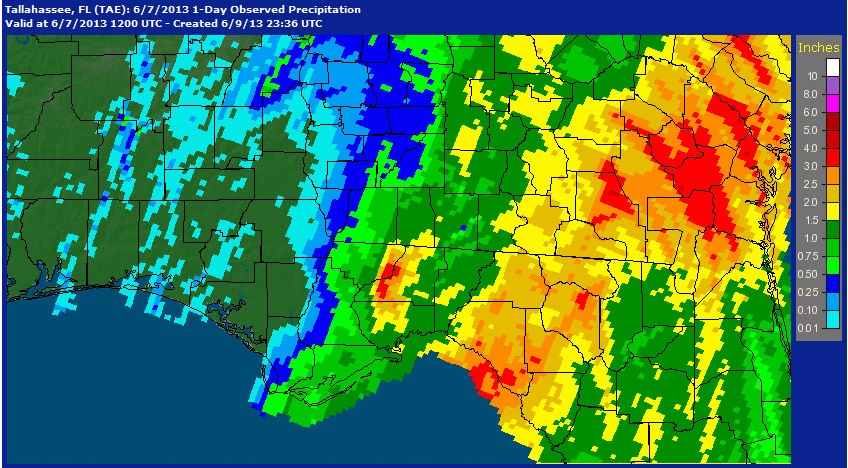
Figure 6. 24-hr AHPS precipitation analysis ending at 12 UTC June 7, 2013 courtesy of the Southeast River Forecast Center.
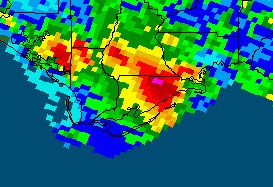
Figure 7. 24-hr AHPS precipitation analysis ending at 12 UTC June 6, 2013 courtesy of the Southeast River Forecast Center.
Page created by Mark Wool. Radar and satellite loops created by Alex Lamers.


 Follow us on YouTube