
Showers and thunderstorms capable of producing widespread heavy rainfall will be possible across much of Puerto Rico today. Heavy rainfall will likely lead to flash, urban and small stream flooding. Some areas may face life-threatening flooding. In the Southeast U.S., strong to marginally severe thunderstorms will be possible this afternoon. Read More >
Winter 2014 - 2015 Highlights
| Jump To: | Temperatures | Precipitation | Drought Progression |
| Tulsa - Averages & Records | Fort Smith - Averages & Records | Fayetteville - Averages & Records | |
| Weather Highlights | Spring 2015 Outlook |
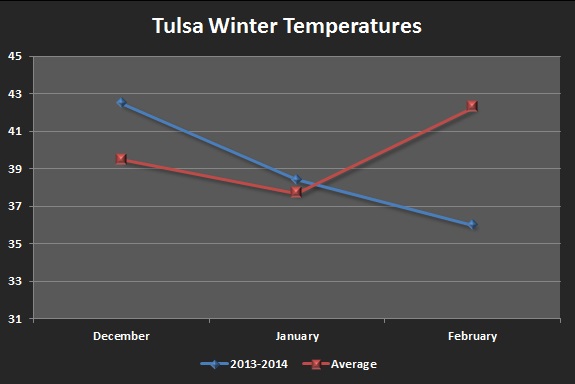
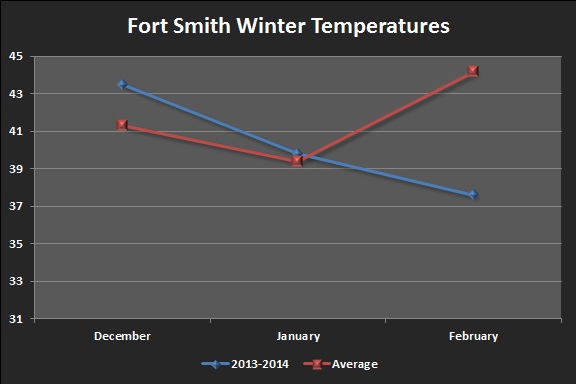
The following line graphs depict the mean temperature for the months of December - February (in blue) along with the expected mean temperature (in red) for Tulsa, OK, Fort Smith, AR and Fayetteville, AR. The mean temperatures were taken from 1980 - 2010.
 |
 |
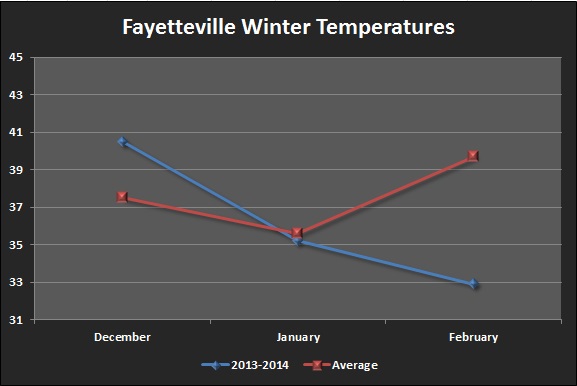 |
The winter months of 2014 - 2015 started out warmer than normal, with all three climate sites having above normal average temperatures for December 2014. Tulsa's temperatures were 3.0° above normal, Fort Smith's temperatures were 2.2° above normal, and Fayetteville's temperatures were 3.0° above normal. Conditions cooled near normal for January, with average temperatures within 1.0° of normal. Temperatures typically warm during the month of February across eastern Oklahoma and northwest Arkansas, however this year temperatures continued to drop. Several all time low temperature records were set during the month of February this year, with the average temperatures running well colder than usual. Tulsa's temperatures were 6.3° below normal, making February 2015 the 12th coldest on record. Fort Smith's temperatures were 6.6° below normal, making February 2015 the 14th coldest on record. And Fayetteville's temperatures were 6.8° below normal, making February 2015 the 4th coldest on record.
The following bar graphs depict the mean precipitation for the months of December - February (in blue) along with the expected mean precipitation (in red) for Tulsa, OK, Fort Smith, AR and Fayetteville, AR. The mean precipitation amounts were taken from 1980 - 2010.
 |
 |
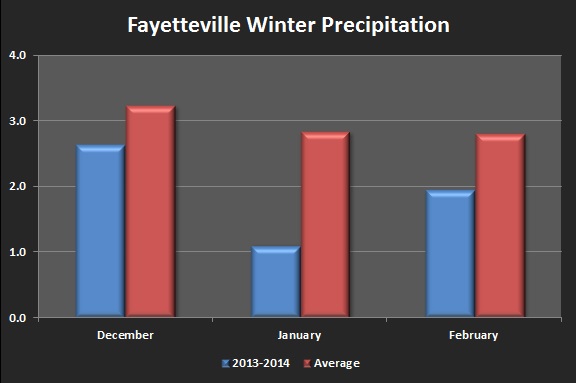 |
Below normal amounts of precipitation persisted through the winter months at all three of the climte sites, leading to increasing levels and coverage of drought conditions across the area. In Tulsa, December precipitation was 0.52" below normal, January was 0.91" below normal, and February was 0.28" below normal. For the season, the Tulsa area only received 72% of the expected precipitation. In Fort Smith, December precipitation was 0.98" below normal, January was 0.59" below normal, and February was 0.37" below normal. For the season, the Fort Smith area only recieved 78% of the expected precipitation. And in Fayetteville, December precipitation was 0.60" below normal, January was 1.73" below normal, and February was 0.86" below normal. For the season, the Fayetteville area only received 64% of the expected precipitation.
The following bar graphs depict the mean snowfall for the months of December - February (in blue) along with the expected mean snowfall (in red) for Tulsa, OK, Fort Smith, AR and Fayetteville, AR. The mean snowfall amounts were taken from 1980 - 2010.
 |
 |
 |
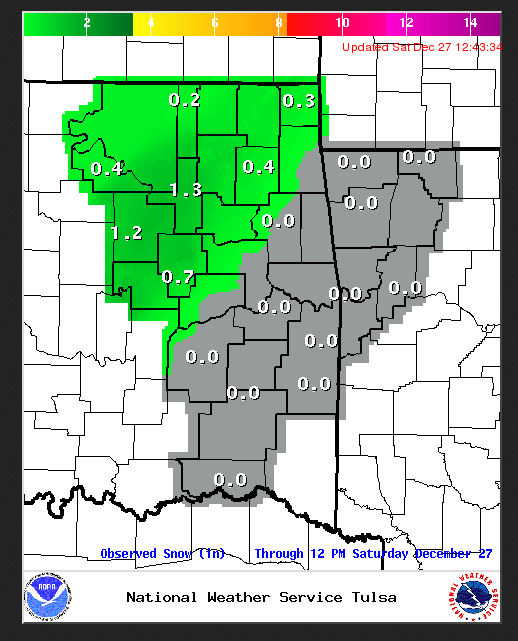
December and January brought little to no snowfall across much of eastern Oklahoma and northwest Arkansas, with only the Tulsa climate site seeing accumulating snowfall at the end of December (2 inches on December 27th). Only trace amounts of snow were recorded at Fort Smith and Fayetteville during December 2014 and January 2015. February 2015, however, brought well above normal amounts of snow, with several daily record snowfall accumulaitons set. The total snowfall amounts during February in Tulsa were 5.8" making it the 12th snowiest on record. In Forth Smith, 5.6" of snow fall during the month of February, making it the 17th snowiest on record. And in Fayetteville, 5.3" of snowfall were recorded, making it the 14th snowest February on record.
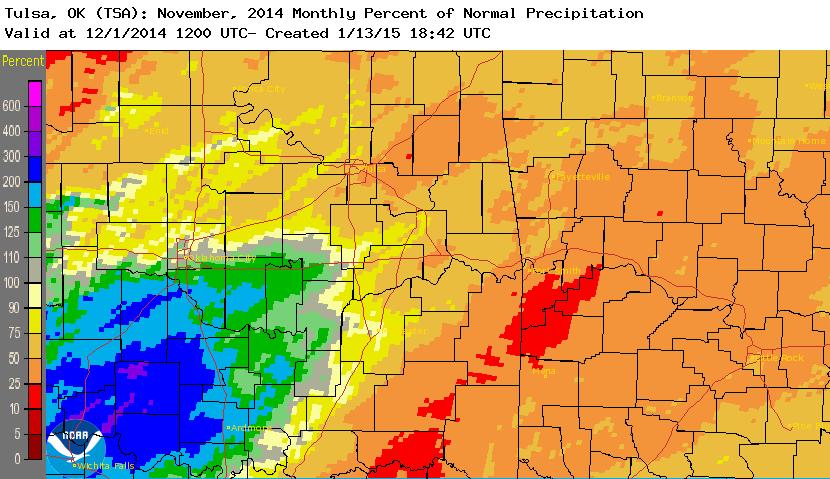
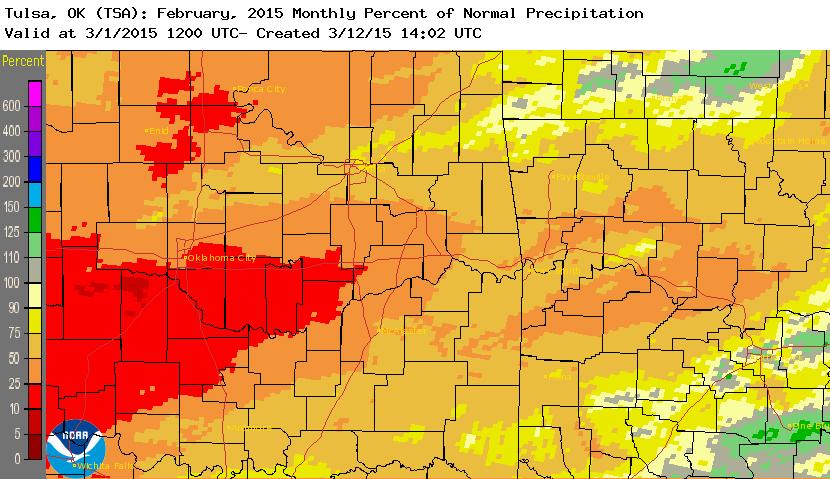
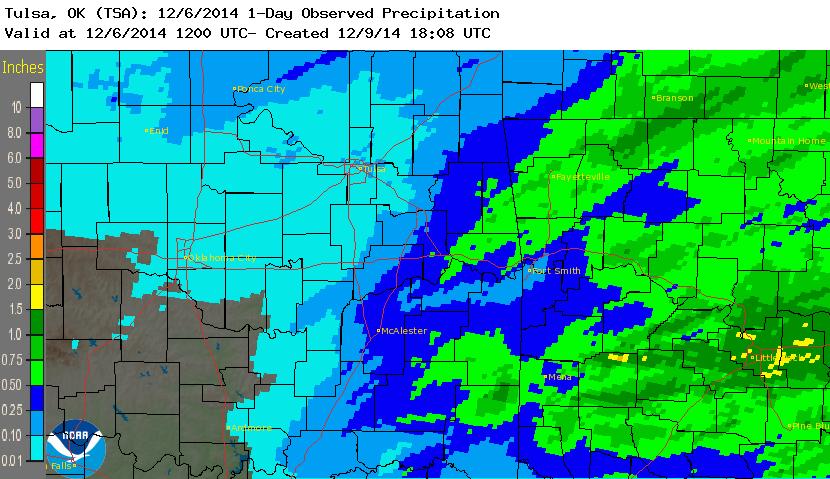
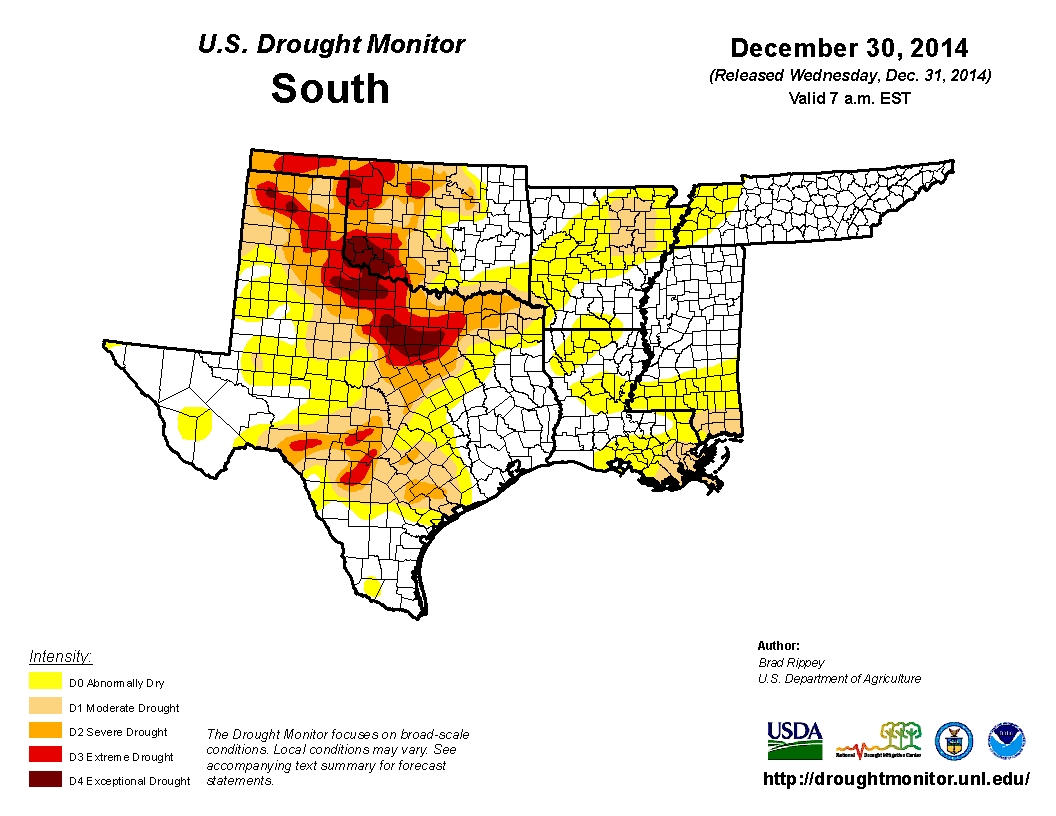
The following chart depicts the amount of precipitation that fell leading up to, and during the winter months of 2014 - 2015, and how that impacted the current drought across the area. The first image is the amount of rainfall that fell during the month (observed precipitation). The second image is the percentage of expected rainfall that fell during the month (percent of normal). The third image is the state of drought near the end of that month (drought progression).
| Observed Preciptation | Percent of Normal | Drought Progression | |
| November 2014 |  |
 |
|
| December 2014 |  |
 |
|
| January 2015 |  |
 |
|
| February 2015 |  |
 |
|
At the end of fall 2014, much of eastern Oklahoma and northwest Arkansas were drought free. There was a small area of D-0 drought, or "abnormally dry" conditions, across southeast Oklahoma within Pushmataha and Choctaw counties, as well as an area of D-0 to D-2, or "abnormally dry" to "severe drought", across portions of northeast Oklahoma, mainly within Osage, Pawnee, western Tulsa, and Creek counties. These drought conditions persisted into the end of December with little change, excpet the drought across Choctaw County increased to D-1 levels, or "moderate drought." Due to below normal precipitaiton amounts in December and January, the D-0 drought conditions, or "abnormally dry", had expanded east across much of eastern Oklahoma, as well as into western portions of Benton County in northwest Arkansas by the end of January 2015. The higher levels of drought across Osage, Pawnee, Tulsa, and Creek counties had also also expanded across more of the area. Although February 2015 brought above normal snowfall, the precipitation amounts were still slightly below normal, allowing the drought to persist into early spring across much of the forecast area. The D-0, or "abnormally dry" levels expanded into all of northwest Arkansas, and the D-1 to D-2, or "moderate drought" to "severe drought", expanded across more of northeast Oklahoma, into portions of Washington, Nowata, Rogers, and Wagoner counties.
Below are tables for Tulsa, OK, Fort Smith, AR and Fayetteville, AR with their monthly averages and records for temperatures and precipitation for the winter months of December - February, along with the winter seasonal average. Below the tables are the daily temperature and precipitation records set during the season.
Tulsa:
| Tulsa, OK |
Average Temperature |
Departure from Normal |
Rank | Record |
| December 2014 | 42.5°F | +3.0°F | 32nd hottest | 47.3°F in 1931 |
| January 2015 | 38.4°F | +0.7°F | 50th hottest | 48.4°F in 2006 |
| February 2015 | 36.0°F | -6.3°F | 12th coldest | 27.5°F in 1905 |
| Winter Season 2014-2015 | 39.1°F | -0.6°F | 43rd coldest | 30.4°F in 1978-79 |
* January 18, tied the high maximum temperature record of 72° (other record from 1951).
* January 26, tied the high maximum temperature record of 71° (other record from 1911).
* February 8, new high maximum temperature record of 79° (old record was 76° from 1990).
* February 27, new low maximum temperature record of 20° (old record was 23° from 1962).
* February 27, new low average temperature record of 17° (old record was 18° from 1962).
| Tulsa, OK | Precipitation | Departure from Normal | Rank | Record |
| December 2014 | 1.97" | -0.52" | 81st driest | 0.00" in 1889/1900 |
| January 2015 | 0.75" | -0.91" | 36th driest | 0.00" in 1986 |
| February 2015 | 1.57" | -0.28" | 71st driest | 0.00" in 1895 & 1904 |
| Winter Season 2014-2015 | 4.29" | -1.71" | 50th driest | 1.59" in 2005-06 |
* No daily precipitation records were set during the winter season in Tulsa, OK.
| Tulsa, OK | Snowfall | Departure from Normal | Rank | Record |
| December 2014 | 2.0" | -0.3" | 30th snowiest | 11.4" in 2000 |
| January 2015 | Trace | -2.7" | 88th snowiest | 12.7" in 1979 |
| February 2015 | 5.8" | +4.0" | 12th snowiest | 22.5" in 2011 |
| Winter Season 2014-2015 | 7.8" | +1.0" | - | - |
* December 27, new daily snowfall record of 2.0" (old record was 1.5" from 1988).
* February 16, new daily snowfall record of 2.7" (old record was 2.5" from 1952).
| Fort Smith, AR | Average Temperature | Departure from Normal | Rank | Record |
| December 2014 | 43.5°F | +2.2°F | 47th hottest | 57.7°F in 1889 |
| January 2015 | 39.8°F | +0.4°F | 62nd hottest | 48.9°F in 1923 |
| February 2015 | 37.6°F | -6.6°F | 14th coldest | 31.5°F in 1905 |
| Winter Season 2014-2015 | 40.4°F | -1.2°F | 41st coldest | 33.1°F in 1978-79 |
* February 27, new low maximum temperature record of 25° (old record was 33° from 1934).
* February 27, new low average temperature record of 21.5° (old record was 24.0° from 1934).
| Fort Smith, AR | Precipitation | Departure from Normal | Rank | Record |
| December 2014 | 2.31" | -0.98" | 59th driest | 0.09" in 1908 |
| January 2015 | 2.22" | -0.59" | 69th driest | 0.20" in 1986 |
| February 2015 | 2.39" | -0.37" | 74th driest | 0.14" in 1947 |
| Winter Season 2014-2015 | 6.92" | -1.94" | 50th driest | 2.56" in 1962-63 |
* No daily precipitation records were set during the winter season in Fort Smith, AR.
| Fort Smith, AR | Snowfall | Departure from Normal | Rank | Record |
| December 2014 | Trace | -0.8" | 52nd snowiest | 8.3" in 1916 |
| January 2015 | Trace | -2.4" | 87th snowiest | 13.6" in 1918 |
| February 2015 | 5.6" | +4.5" | 17th snowiest | 18.3" in 1921 |
| Winter Season 2014-2015 | 5.6" | +1.3" | - | - |
* February 22, new daily snowfall record of 2.0" (old record was 0.3" from 1971).
| Fayetteville, AR | Average Temperature | Departure from Normal | Rank | Record |
| December 2014 | 40.5°F | +3.0°F | 18th hottest | 45.8°F in 1984 |
| January 2015 | 35.2°F | -0.4°F | 28th coldest | 23.7°F in 1979 |
| February 2015 | 32.9°F | -6.8°F | 4th coldest | 28.9°F in 1978 |
| Winter Season 2014-2015 | 36.3°F | -1.2°F | 17th coldest | 30.7°F in 1977-78 |
* February 8, tied the high maximum temperature record of 70° (other record from 1999).
* February 17, tied the low minimum temperature record of 7° (other record from 1980).
* February 23, new low maximum temperature record of 23° (old record was 31° from 1975).
* February 23, new low average temperature record of 20.0° (old record was 22.0° from 1989).
* February 27, new low maximum temperature record of 20 (old record was 30 from 1962).
* February 27, new low average temperature record of 15.5 (old record was 20.5 from 1962).
| Fayetteville, AR | Precipitation | Departure from Normal | Rank | Record |
| December 2014 | 2.64" | -0.60" | 32nd driest | 0.26" in 1955 |
| January 2015 | 1.11" | -1.73" | 15th driest | 0.10" in 1986 |
| February 2015 | 1.95" | -0.86" | 27th driest | 0.22" in 1996 |
| Winter Season 2014-2015 | 5.70" | -3.19" | 12th driest | 2.84" in 1958-59 |
* No daily precipitation records were set during the winter season in Fayetteville, AR.
| Fayetteville, AR | Snowfall | Departure from Normal | Rank | Record |
| December 2014 | Trace | -1.5" | 34th snowiest | 7.0" in 2013 |
| January 2015 | Trace | -2.3" | 43rd snowiest | 14.0" in 1977 |
| February 2015 | 5.3" | +3.7" | 14th snowest | 18.8" in 2011 |
| Winter Season 2014-2015 | 5.3" | -0.1" | - | - |
* December 1, tied the daily snowfall record of a Trace (other records from 1955, 1974, 1985, 1996).
* February 28, new daily snowfall record of 1.7" (old record was a Trace from 1959, 1960, 1962, 1963, 1968, 1971, 1984, 1986, 1987, 1990).
Here are a few of the more significant events of the winter season 2014 - 2015, including severe weather, , as well as several snow storms.
December:
 |
 |
 |
|
December 3 - 5 Rainfall Photo Credit: NWS |
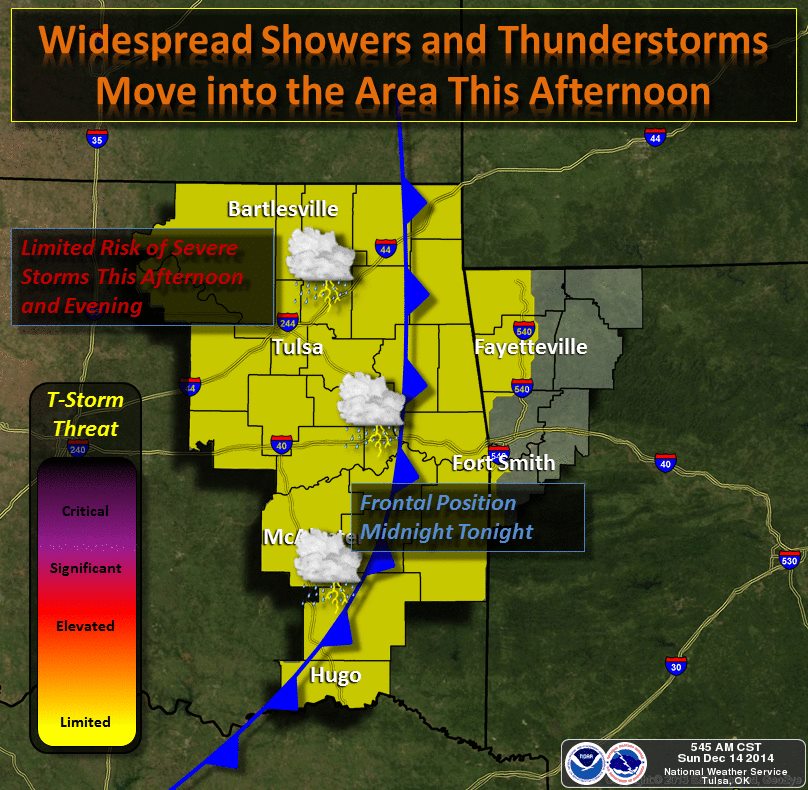
December 14 Severe Weather Photo Credit: NWS Tulsa |
December 27 Snowfall Photo Credit: NWS Tulsa |
The first part of December started out dreary and wet, with slightly above normal temperatures. A prolonged period of light to moderate rainfall developed between December 3-5, bringing between 0.20" and 0.50" of rain to much of the forecast area (see image above left). Slightly higher amounts, up to 1.00" were reported across far eastern Oklahoma and into western Arkansas. Warmer temperatures along with an approaching upper level disturbance triggered showers and thunderstorms during the afternoon hours of December 14th (see image above center). Some of the storms become strong to severe, with several locations reporting wind damage within eastern Oklahoma and western Arkansas. Temperatures turned colder by the end of the month, allowing precipitation to switch over from rain to snow during the afternoon hours of December 27th. A heavier band of snow developed just south of Interstate-44, where between 0.5" and 2.0" fell (see image above right).
January:
|
January 1 - 3 Winter Precip Photo Credit: NWS Tulsa |
January Photo Credit: NWS Tulsa |
January Photo Credit: NWS Tulsa |
February:
 |
 |
 |
|
February 16 Snowfall Photo Credit: NWS Tulsa |
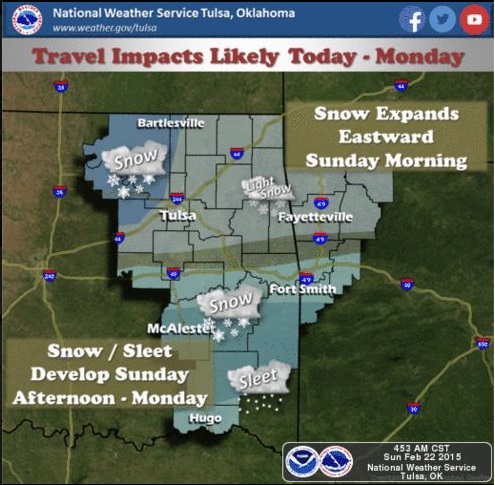
February 22 - 23 Snowfall Photo Credit: NWS Tulsa |
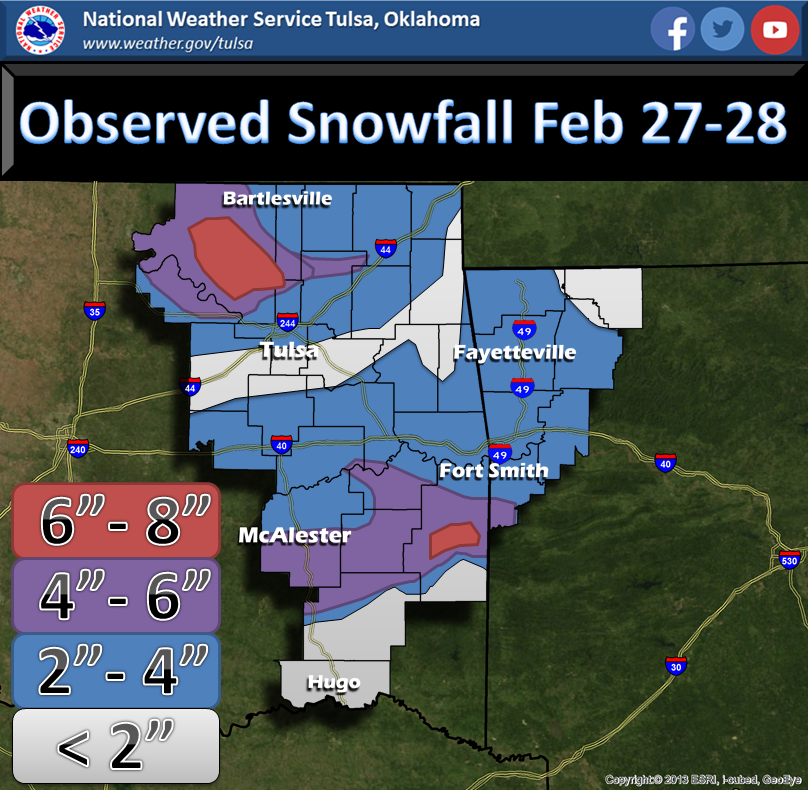
February 27 - 28 Snowfall Photo Credit: NWS Tulsa |
The first half of February for the most part was dry and quiet, with only a few days in early February receiving any precipitation. On February 15th, precipitation developed across the area as an upper level disturbance moved into the region. The precipitation initially started as rain, but as temperatures dropped during the evening, the rain switched over to a mix of sleet and freezing rain. Overnight temperatures dropped further, leading to a mix of sleet and snow by the morning of February 16th. Snowfall amounts were highest across northeast Oklahoma into northwest Arkansas, where 4-6 inches of snow were reported (see image above left). A strong arctic cold front brought cold air into the region on February 22nd as precipitation developed across the area. The precipitation started as rain, but quickly transitioned over to a mix of sleet and snow as the colder air surged southward. Two rounds of a sleet/snow mix occurred, with the first affecting the northern half of the area, and the second spreading across southeast Oklahoma. While an inch or less fell across northeast Oklahoma and northwest Arkansas, between 1-3 inches accumulated along and south of Interstate 40 (see image above center). A third winter storm moved into the area during the early afternoon hours of February 27th, and persisted into the afternoon hours of February 28th before ending. Two intense bands developed, with the first band extending across northeast Oklahoma, within portions of Pawnee and Osage counties, where between 5-8 inches of snow fell. A second band formed over portions of southeast Oklahoma into western Arkansas, across Pittsburg, Latimer, and into Le Flore counties, where between 4-6 inches of snow fell (see image above right).
Below is a chart with the Climate Prediction Center's forecast for both temperatures and precipitation for the next three months (April - June), along with the Seasonal Drought Outlook for the spring and early summer months through June 30. For temperatures (left), all of eastern Oklahoma and northwest Arkansas fall within the "EC" or "equal chances" area. This means that there are no indications that the temperatures for the spring and early summer months will be either above or below normal, thus, normal, below normal, and above normal temperatures are all equally likely. For precipitation (center), again, all of eastern Oklahoma and northwest Arkansas show an "equal chances" rating. This means that there are no indications that the precipitation amounts will be either above or below normal, thus, normal precipitation, below normal, and above normal are all equally likely. The third image (right) depicts the Seasonal Drought Outlook for the nation through the end of June. The green area across portions of northeast Oklahoma indicates that the D-1 and D-2 drought conditions that developed during the end of February and into early March are expected to improve. The white area across the rest of eastern Oklahoma and northwest Arkansas indicates that no D-1 drought conditions are present, and none are expected to develop.
 |
 |
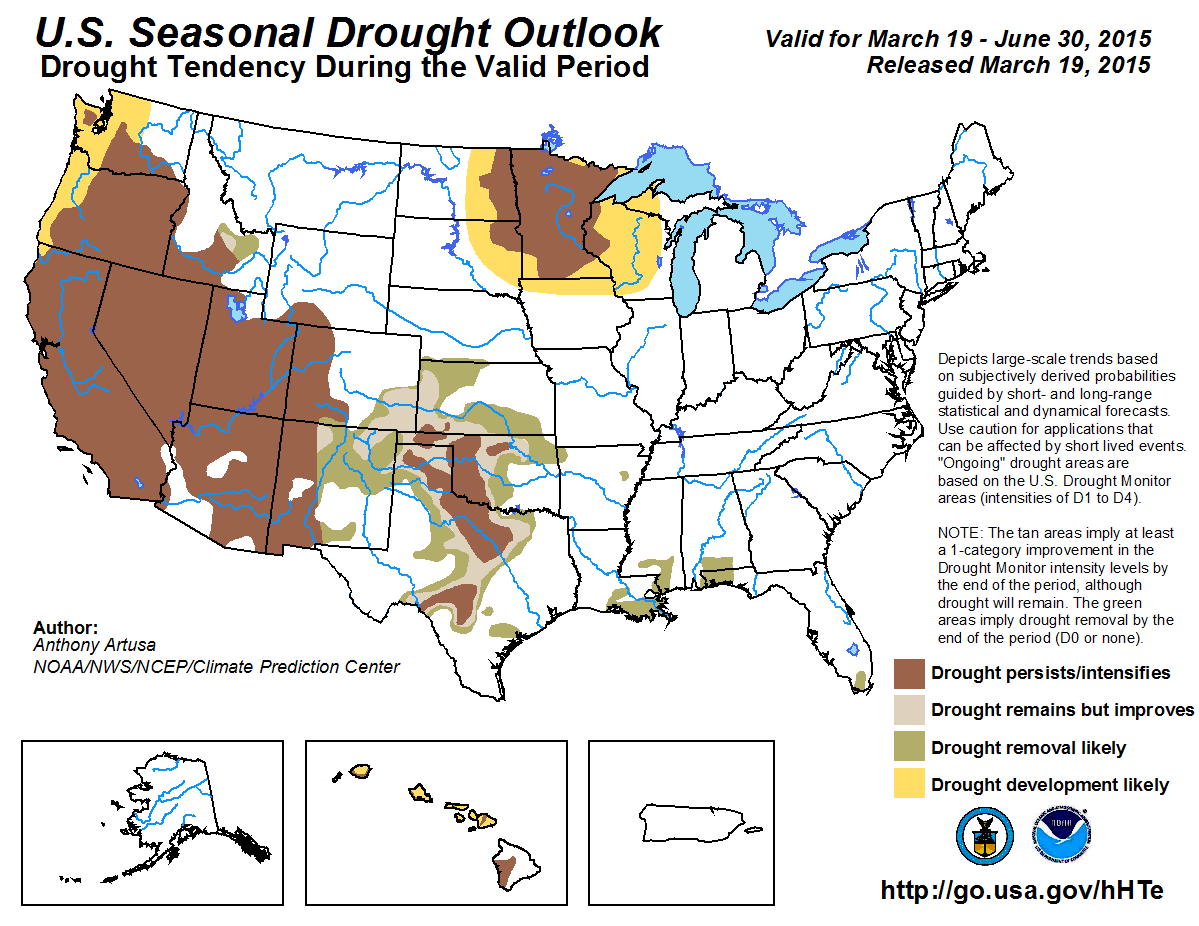 |
| Spring 2015 Temperature Outlook | Spring 2015 Precipitation Outlook | Spring 2015 Drought Outlook |
Updated: April 29, 2015


 Follow us on YouTube