| Temperatures | Precipitation | ||||||
| Month | High | Low | Average | Departure | Total | Departure | Snow |
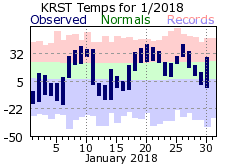
| January | 22.9 | 6.3 | 14.6 | -1.1 | 1.42 | +0.56 | 16.2 |
| February | 24.1 | 6.6 | 15.3 | -5.0 | 1.08 | +0.25 | 9.5 |
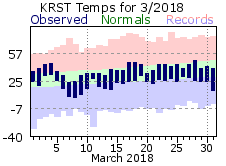
| March | 38.7 | 22.4 | 30.5 | -1.9 | 0.91 | -0.97 | 7.0 |
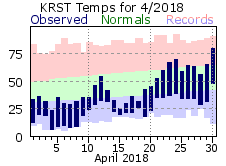
| April | 44.5 | 24.5 | 34.5 | -12.2 | 3.18 | -0.06 | 17.0 |
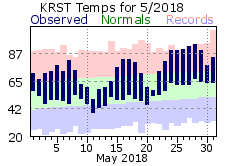
| May | 74.8 | 53.5 | 64.1 | +6.0 | 5.19 | +1.56 | 0.0 |
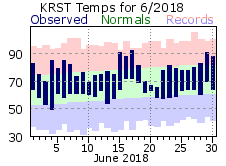
| June | 78.9 | 61.3 | 70.1 | +2.5 | 6.38 | +1.70 | ... |
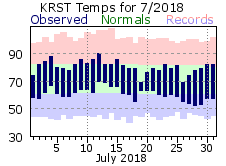
| July | 80.3 | 60.6 | 70.4 | -1.0 | 2.88 | -1.67 | ... |
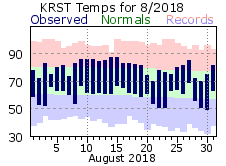
| August | 79.7 | 59.7 | 69.7 | +0.6 | 3.22 | -1.30 | ... |
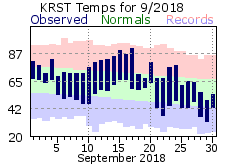
| September | 73.2 | 52.9 | 63.1 | +2.2 | 7.58 | +4.13 | ... |
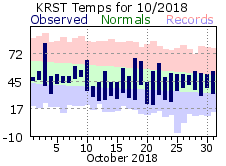
| October | 54.0 | 35.2 | 44.6 | -3.8 | 3.63 | +1.39 | 1.6 |
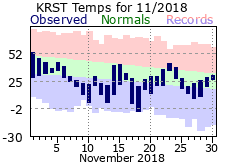
| November | 32.3 | 19.4 | 25.9 | -8.0 | 1.61 | -0.30 | 4.0 |
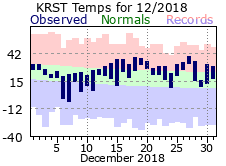
| December | 29.4 | 17.9 | 23.7 | +3.9 | 2.10 | +0.87 | 9.7 |
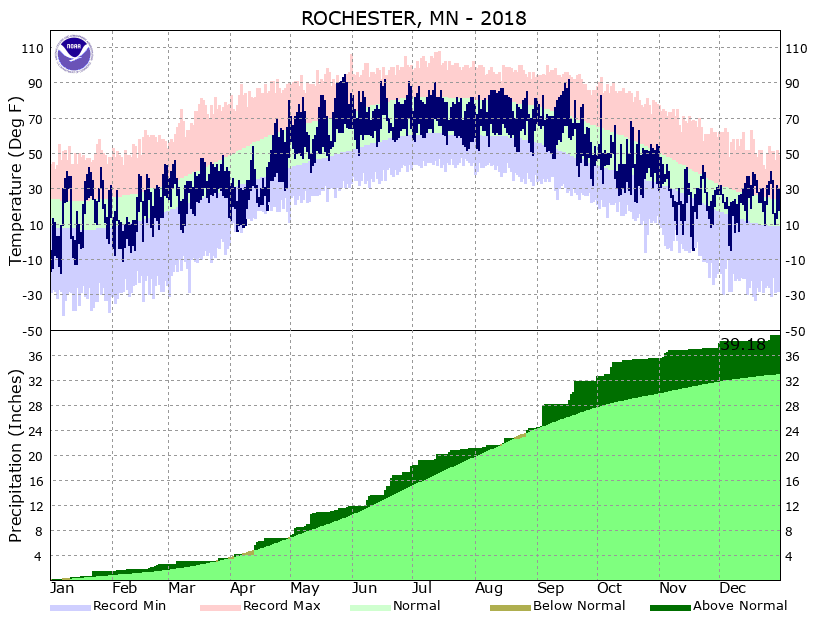
| TOTALS: | 52.7 | 35.0 | 43.9 | -1.5 | 39.18 | +6.16 | *** |
Records
Temperature...
Highs:
Lows:
Highest Lows:
Lowest Highs:
Monthly:
Seasonal:
Yearly:
Precipitation...
One-day pcpn:
One-day snowfall:
Monthly pcpn:
Monthly snowfall:
Seasonal precipitation:
Yearly precipitation:
|
It was a chilly start to 2018 with single digit high temperatures on 4 of the first 6 days, with lows mostly in the teens below zero. In fact, 2018 wouldn’t even climb above zero until well into the day on the 2nd. That would quickly change as we entered the second week of January as much milder air spread into the region and then settled in for much of the rest of the month. Highs reached 35 or warmer 10 times in January (average is 5), climbing into the 40s 3 times. Despite the warmth, there were still enough colder days to keep the month on a whole around 1 degree below its normal. Precipitation for the month finished a bit above normal, mostly thanks to the 22nd when 0.91 inches of rain fell (64% of the monthly total). Snowfall was a few inches above normal for January, highlighted by the 8.1 inches that dropped on the 22nd. Outside of that day, measurable snowfall occurred on 7 days, but only amounted to an inch or more on 2 of them.
|
 |
|
Winter returned for the first of half of February with highs only in the teens (or lower) on 11 of the first 12 days with lows below zero on those same days. More seasonable air returned for the rest of the month with highs even jumping into the 40s for the last 2 days. However, that wasn’t enough to keep the average monthly temperature from finishing 5 degrees below normal. Shovels saw a lot of use for the start of February with at least a trace of snowfall falling from the 2nd through the 9th. Accumulations were minor over this period, only amounting to 4.6 inches. On the whole, there were 13 days with accumulating snow for February, tied for most on record for Rochester (normal is 6). However, no day recorded over 2 inches (max was 2 inches on the 24th) and the month only finished an inch above normal. |
 |
|
March hung right around its normal for temperatures all month long, averaging plus or minus 5 degrees of its daily normal on 24 of the 31 days. It was a relatively dry month, finishing almost an inch below normal. There were 6 days with accumulating precipitation, with 2 days accounting for over 88% of the total. In fact, there was a stretch of 14 consecutive days when not even a flurry fell. Despite the 7 inch total for snowfall, it was a “snow free” March on the whole. There were only 3 days with measurable snow, and 6.3 of those inches came on the 5th. After the 11th, nary a trace of snow fell. |
 |
|
April in Rochester felt more like March, Part 2 as temperatures averaged under 35 degrees for the entire month. The 34.5 degree average made it the coldest April on record, easily beating the previous record by 3 degrees. High temperatures were held under 40 degrees 15 times with lows below 20 on 9 days. Both are records for April. The first 20 days were so cold that average temperatures were held well below freezing (27.0), crushing the previous coldest start to an April by over 7 degrees. There was a taste of summer for the last day of April though as highs climbed to 80 degrees. It was not only winter temperatures for the start of April, but a lot of snow too. Measurable snow fell 7 times in April, all during the first 18 days. The 17 inch total set the all-time record for an April, blowing past the normal of just over 3 inches, and also made it the 47th snowiest month on record in Rochester. A sizable feat for an April. The month did end dry though with no rain or snow falling from the 22nd onward. |
 |
|
As the calendar flipped to May, so did the seasons – from winter to summer. Spring seemed to get left out this year. The average temperature for May was 64.1 degrees, 6 degrees above normal and also the 3rd warmest on record. In fact, the average was so mild it was only a few+ degrees below what can be expected for a normal June! Highs reached or topped 80 degrees 12 times (tied for 4th most in a May), reaching or exceeding 90 degrees 6 times (2nd highest total for a May). The summer temperatures also brought a lot of summer-like rain with measurable rains on 16 days. The 5.19 inch total marked it as the 20th wettest May on record for Rochester. The rainfall was fairly spread out with the longest stretch between measurable rains of only 6 days. |
 |
|
The warmth would continue for the start of the summer months with just over a week’s worth of below normal days in June. The 70.1 degree monthly average tied it for the 13th warmest on record. It was another wet month with 16 more days of measurable rainfall (tied for 5th most in a June) with 6 of those days recording over 1/2” (tied for 4th most). The 6.38 inch total snuck it into the top 20 wettest Junes (19th). A thunderstorm did bring the highest wind gust for 2018 – 69 mph from the southwest on the 30th. |
 |
|
July was fairly seasonable when it came to temperatures, rounding out just 1 degree below normal. 20 of those days were within plus or minus 3 degrees of normal with no notable warm or cold streaks of note for the entire month. It was a relatively dry with the 2.88 inch total over 1 1/2 inches below normal.
|
 |
|
August was another month that hovered right around its seasonable norms, finishing within a degree (above) its normal without any large fluctuations day-to-day. Despite 14 days of measurable rain, the month would finish over an inch below its normal. 7 or those days recorded less than 1/10 of an inch. |
 |
|
September got the fall months off on mild but very wet foot. The first half was especially mild as highs reached or topped 80 degrees 9 out of the first 17 days. The last 90 degree day for 2018 occurred during this period, hitting 92 on the 17th – nearly a month later than average and 14th latest last occurrence on record for Rochester. It was a soaker of a September with 7.58 inches falling, 6tth wettest on record. That said, two periods accounted for nearly the entire amount. Over the 3rd-5th 3.71 inches fell, with an additional 3.73 inches from the 17th-20th. The 3.32” that came on the 4th not only set a record for that day, but was the 5th highest daily amount in a September day and 21st wettest day on record for Rochester. Conversely, there was a streak of 11 dry days (6th through 16th) early in the month with only 0.04 inches falling from 21st onward. Feast or famine. |
 |
|
It stayed wet in October, and also turned cold. Highs were held under 60 on 25 days, 3rd most on record for an October (16 is average). There were freezing temperatures on 13 days. Temperatures did manage to crack 80 degrees for the last time in 2018 on the 3rd, just a few days later than the average. Overall, the 44.6 average for the month was nearly 4 degrees below normal and was the 14th coldest October on record. It was a soggy start to the month with at least a trace of rain falling through the first 11 days. 80% of the 3.63 inch monthly total fell during this period. The latter half of the month was relatively dry with only 4 days of measureable precipitation after the 14th, accounting for only 1/3rd of an inch. The first flakes of the new snowfall season came on the 11th, quickly followed by the first measureable snow on the 14th (1.6”). This was the 7th quickest first snow for Rochester, and about a month earlier than average. |
 |
|
After a fairly wet but seasonable first week for November, temperatures would take a tumble, not warming above freezing on 18 of the remaining 23 days. This tied for the most days in a November where temperatures could not warm above 32. Average is only 7. On the flipside, highs only warmed to 50 degrees or greater once (on the 1st), tied for 2nd least on record and well below the average of 8. On the whole, the month was 8 degrees below normal and the 11st coldest November in Rochester. As mentioned, it was a soggy start to the month as almost 1 ¼ of rain fell from the 3rd through 6th. After that there were 7 days with measurable precipitation, but all but one received less than 1/10 of an inch. There were 6 days with measurable snow, but mostly less than an inch for a monthly total of 4 inches – right on the November normal. On the whole, it was a wet fall (Sep-Oct-Nov) with the 12.82 inches over those 3 months making it the 5th wettest fall for Rochester on record. |
 |
|
It was a seasonable to cool start to December in Rochester, mostly near or below normal through the 11th. After that, milder air settled in and held through the rest of the month. Temperatures were above normal for all but 2 days. Highs reached 40 on the 27th while lows were closer to average highs about half the time over this span. A winter storm got the month off to a snowy start, dropping 7.4 inches on the 1st and 2nd. Snow was a lot harder to come by after that with measurable snows on only 6 more days with only one recording more than an inch (1.1” on the 26th). |
 |
|
2018 will be remembered as a wet year, along with a much abbreviated spring season. The yearly tally of 39.18 inches made it the 14th wettest on record for Rochester. There were 26 days with over ½ inch of precipitation falling – 8th most on record. As for the lack of a spring, as the calendar flipped from March to April and thoughts turned to flowers, budding trees and milder temperatures, Mother Nature had a decidedly different plan in store. Record cold and snow gripped the area for much of the month, with April recording the most snow out of any month for the 2017-18 snowfall season. The only other time this occurred was during the 1982-83 season. Moving into May, temperatures quickly rebounded to more summer-like readings. In fact, not only was it the 3rd warmest May on record, but its monthly average was only 3 ½ degrees colder than an average June. |
 |
| Highest temperature for 2018 | 95 on May 28th |
| Lowest temperature for 2018 | -18 on January 6th |
| Highest one-day precipitation | 3.32 inches on September 4th |
| Highest one-day snowfall | 7.4 inches on April 3rd |
| Number of days with highs at or above 90 degrees | 12 |
| Number of days with highs at or below 32 degrees | 95 |
| Number of days with zero or below temperatures | 27 |
| Peak wind gust | 69 mph from the SW on June 30th |
| Number of days with measurable precipitation | 129 |
| Percentage of days with measurable precipitation | 35% |
| Number of days with above normal temperatures | 161 |
| Percentage of days with above normal temperatures | 44% |

