A historic flooding event affected the Carolinas from October 1-5, 2015. A stalled front offshore combined with deep tropical moisture streaming northwest into the area ahead of a strong upper level low pressure system to the west and Hurricane Joaquin well to the east. This led to historic rainfall with widespread amounts of 15-20 inches and localized amounts over 25 inches, mainly in the Charleston tri-county area. Flash flooding was prevalant and led to significant damage to numerous properties and roads and many people having to be rescued by emergency personnel. In addition, tides were high due to the recent perigean spring tide and persistent onshore winds, excacerbating the flooding along the coast, especially in downtown Charleston.
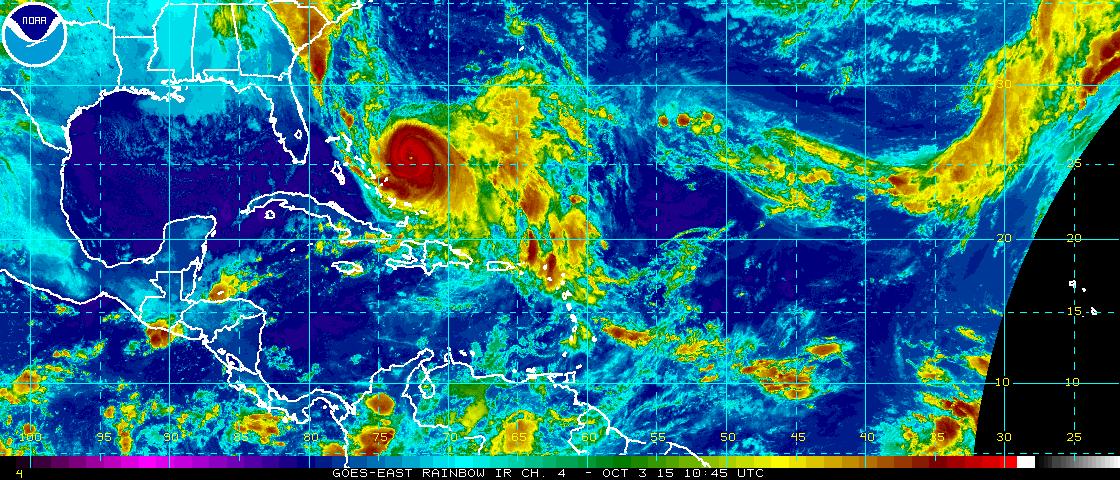 |
NOAA infrared satellite image from 1045 UTC (645 EDT) on October 3, 2015 showing the connection between the convection/rainfall over South Carolina and Hurricane Joaquin near the Bahamas.
Infrared satellite loop showing the longevity of the cold cloud tops (indicative of heavy rain) across southeast South Carolina.
Regional radar imagery from October 1-5 showing the relentless rainfall across the area. (courtesy of College of DuPage)
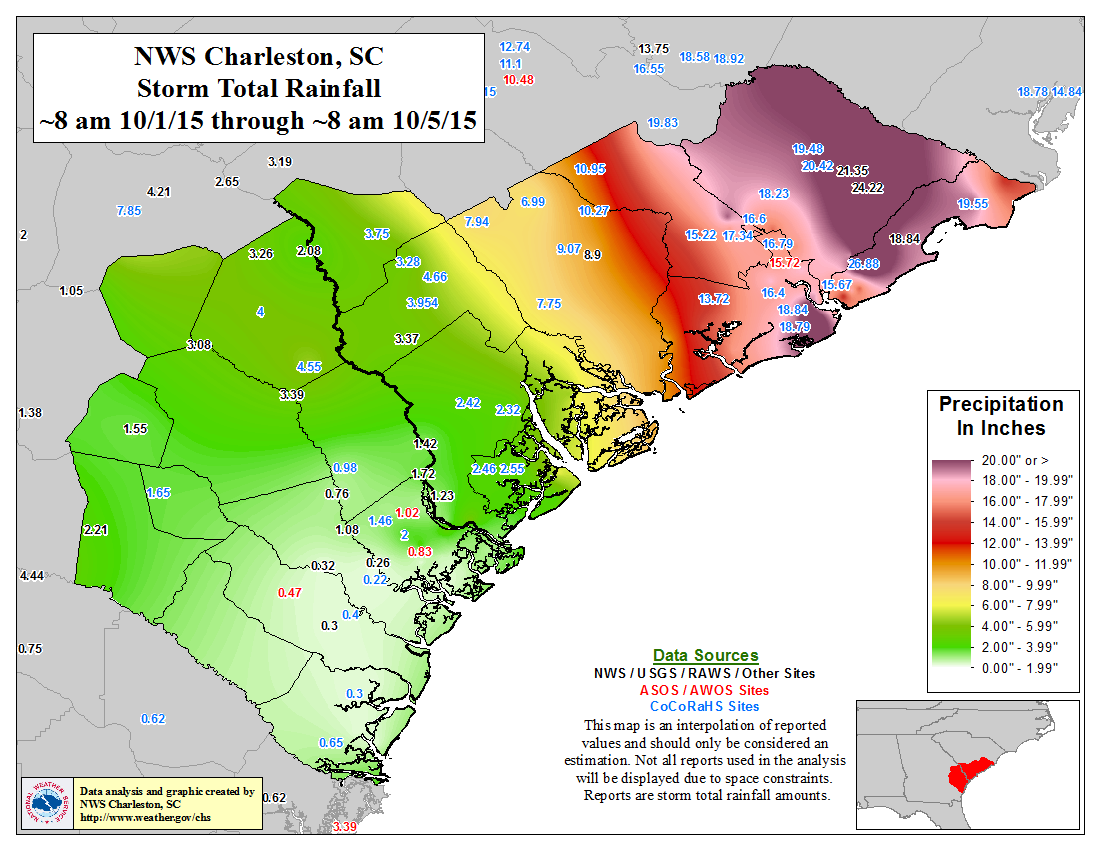
Click here for a complete listing of rainfall totals and here for a listing of the multiple rainfall records that were set at Charleston Airport (KCHS) and Downtown Charleston (KCXM).
Recent perigean spring tides combined with persistent onshore winds to produce very high tide levels along the South Carolina and Georgia coasts. Such high tides excacerbated the freshwater flooding from the heavy rainfall and led to significant flooding of properties and roads, especially in downtown Charleston. In fact, tide levels peaked at 8.29 feet Mean Lower Low Water (MLLW) in Charleston Harbor at 142 PM EDT on October 3. The chart below shows the observed water levels (red) compared to astronomical (normal) tide levels (blue) at the Charleston Harbor tide gauge from October 1 through October 8. Note the significant tidal departures through the entire period.

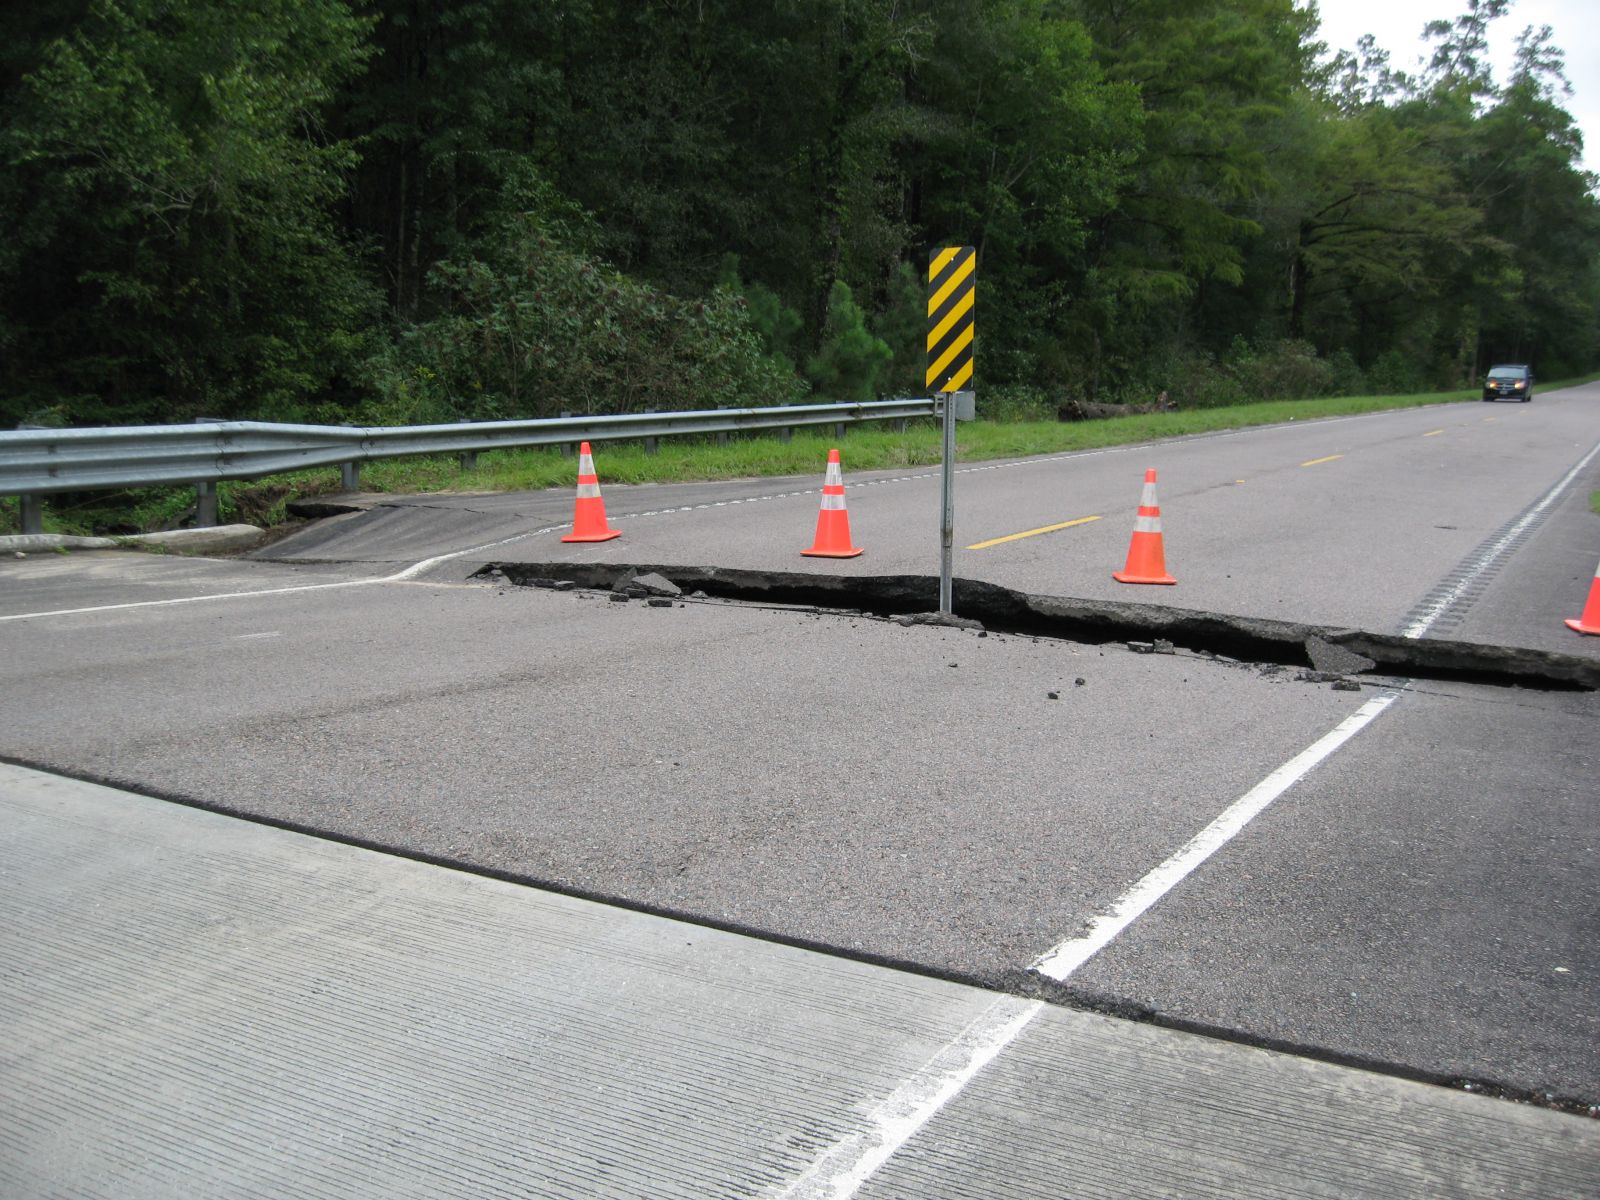
Images courtesy of NWS Charleston, SC - Click to enlarge
 |
 |
 |
 |
 |
|
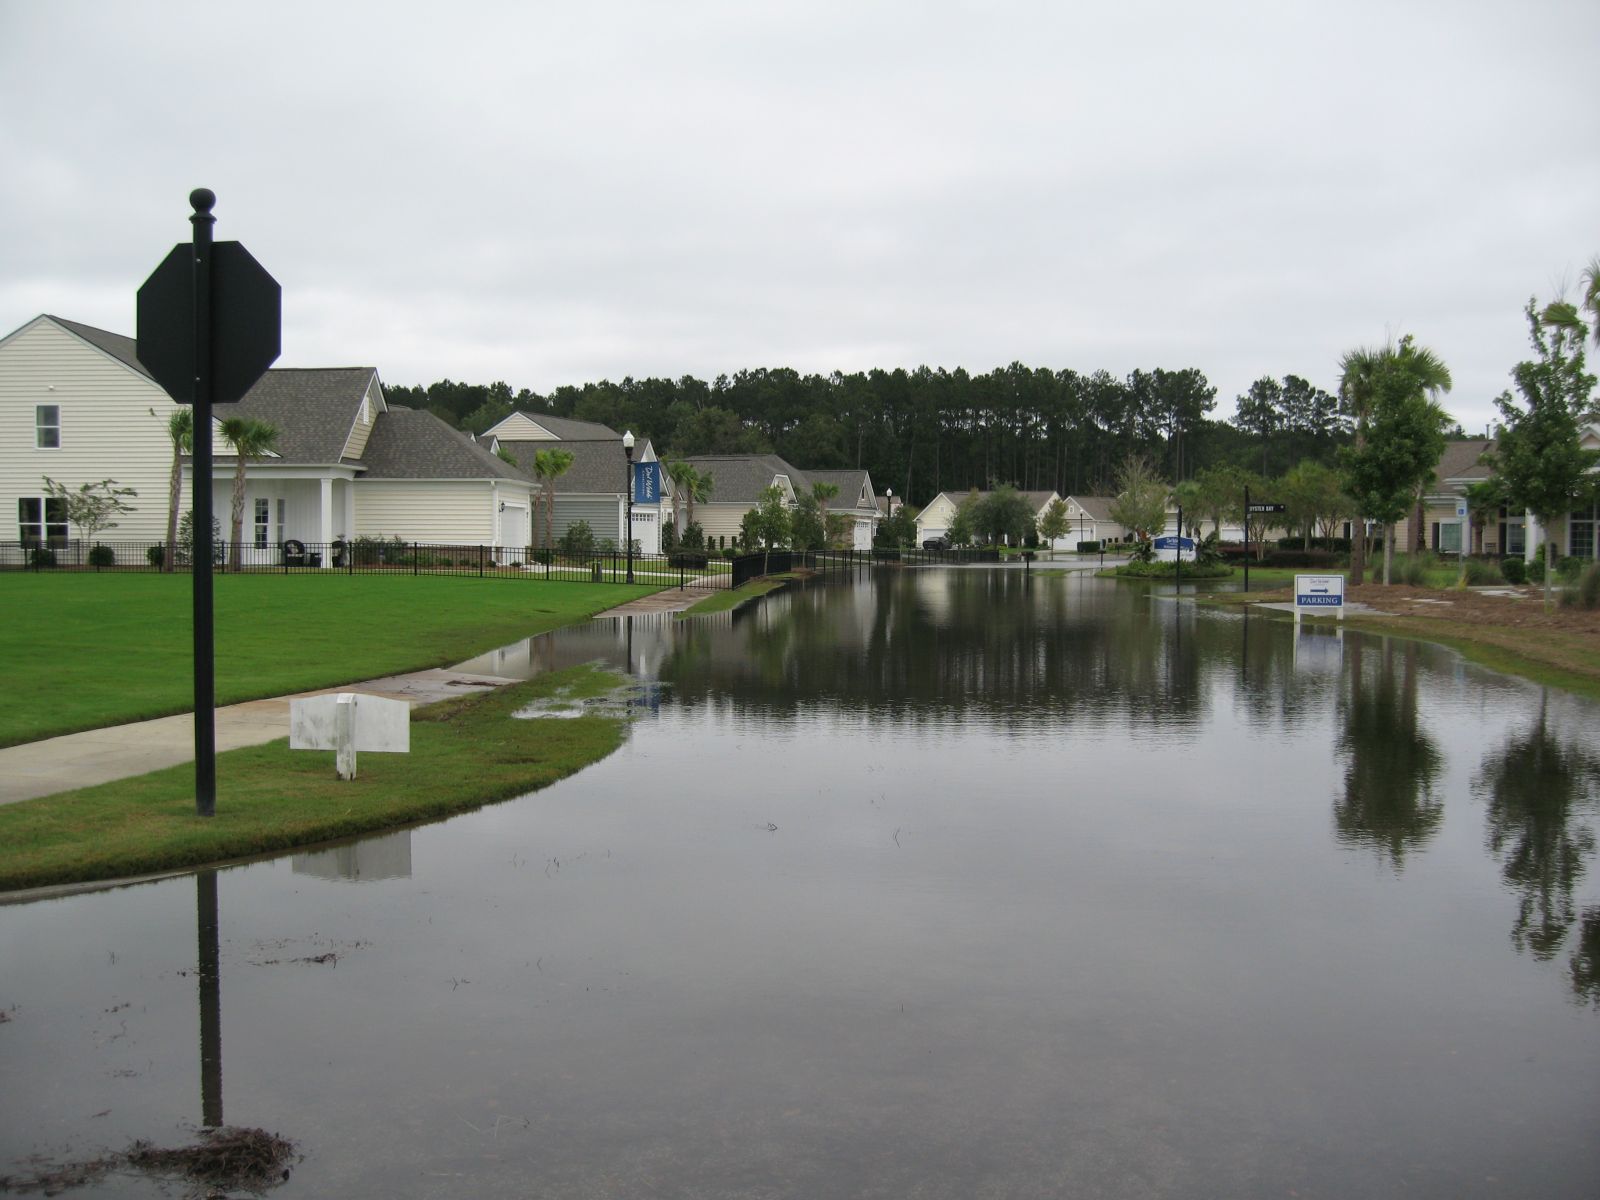
Cane Bay subdivision, Summerville, SC |
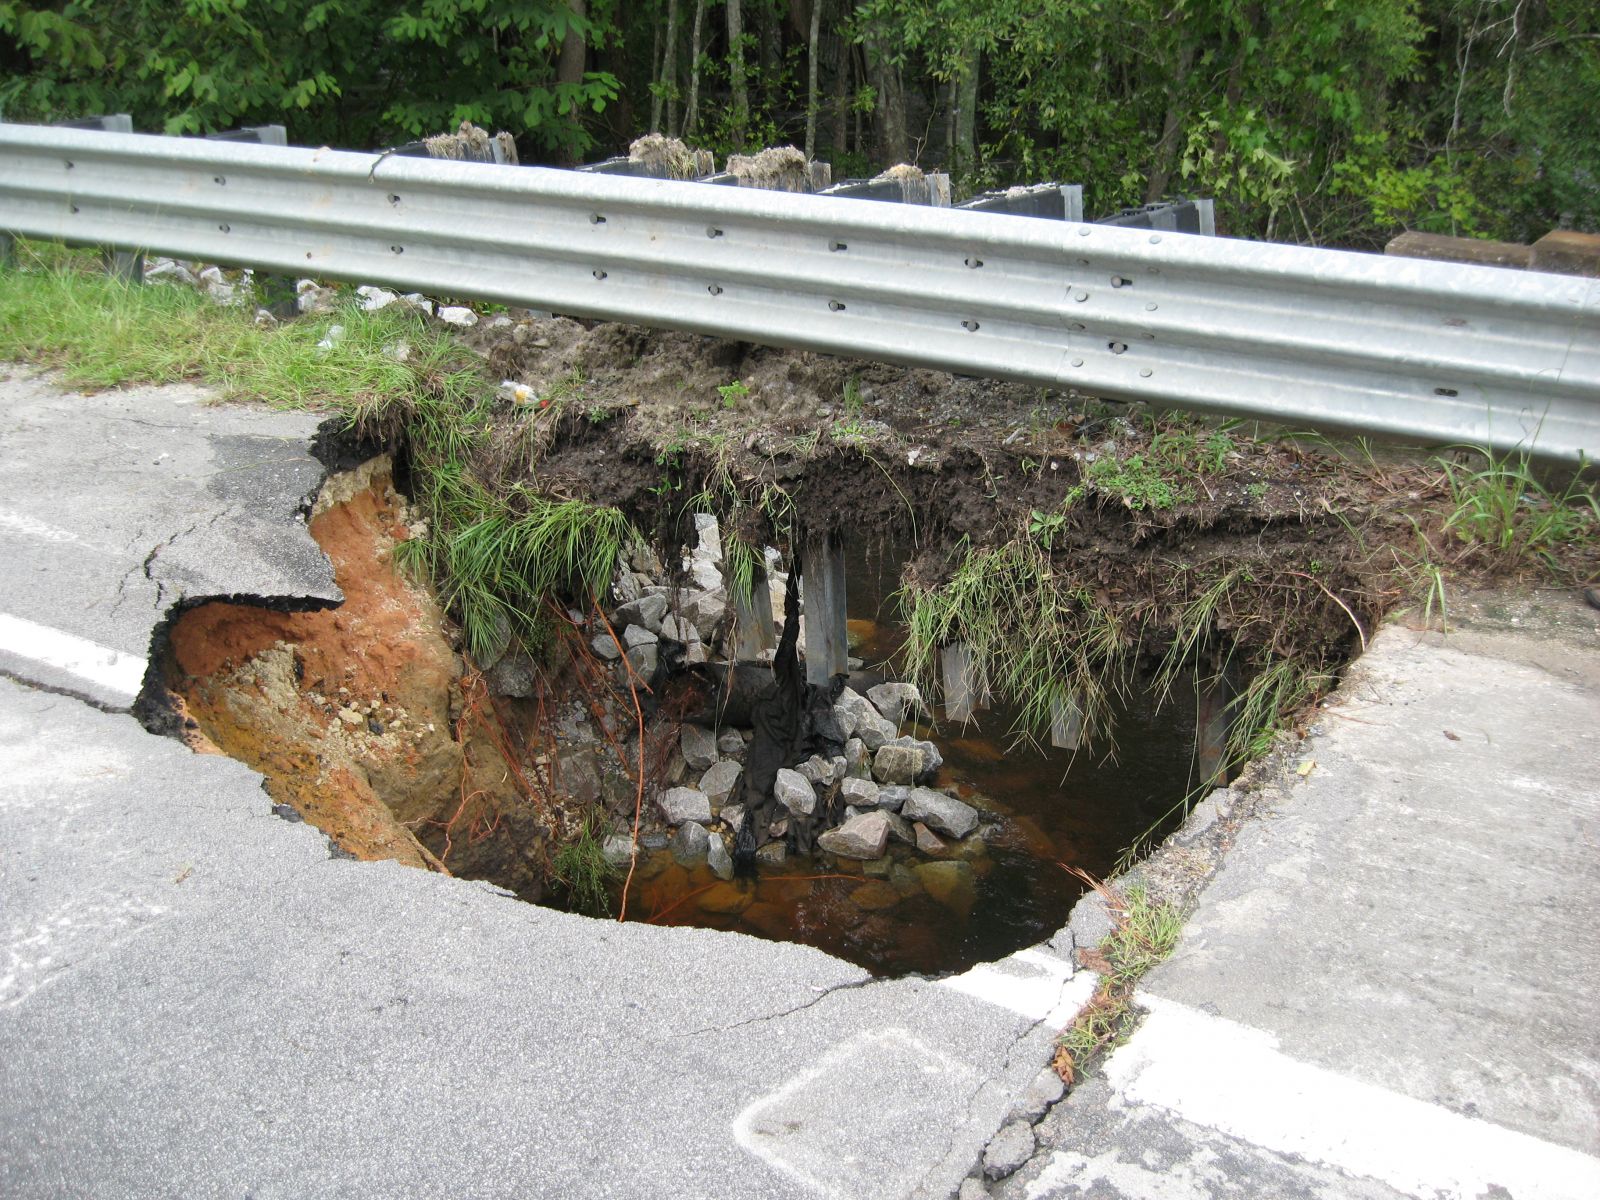
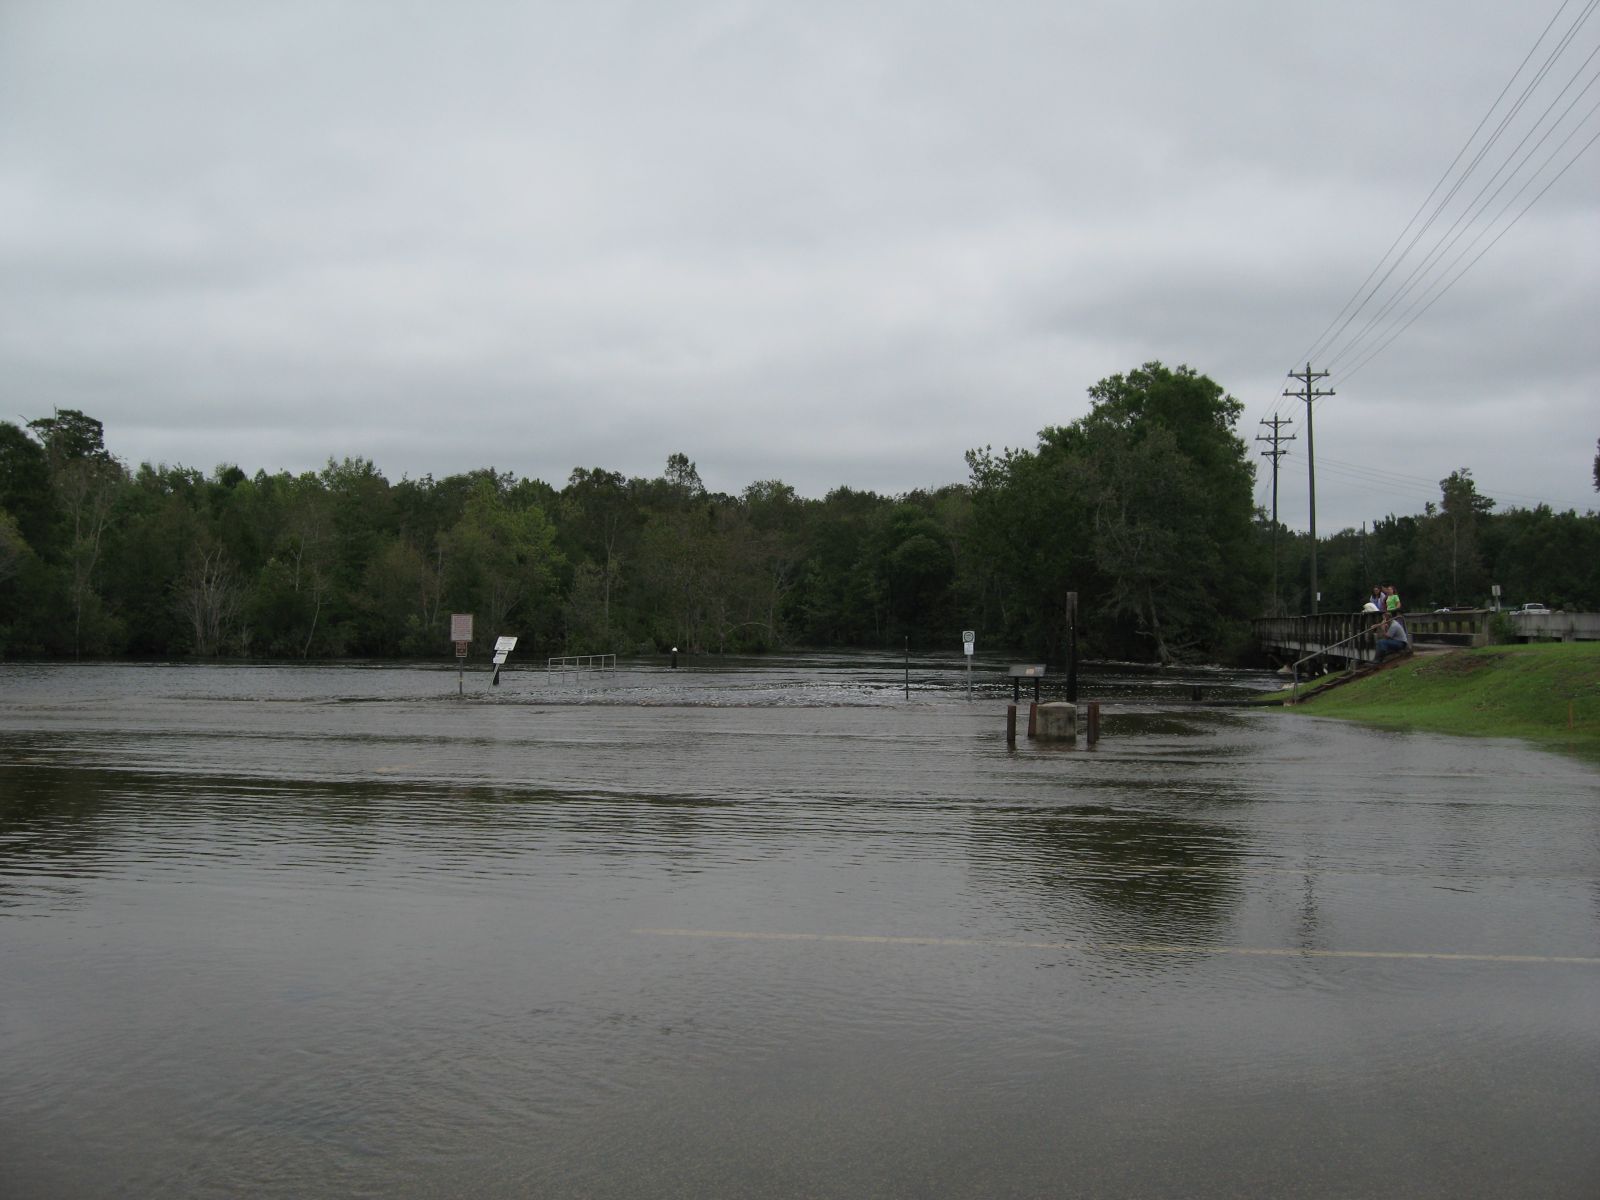
Wadboo Creek Bridge @ Hwy 17A, Bonneau, SC | Hwy 402 Wadboo Creek Bridge, Moncks Corner, SC | Old Black Oak Rd, Moncks Corner, SC |
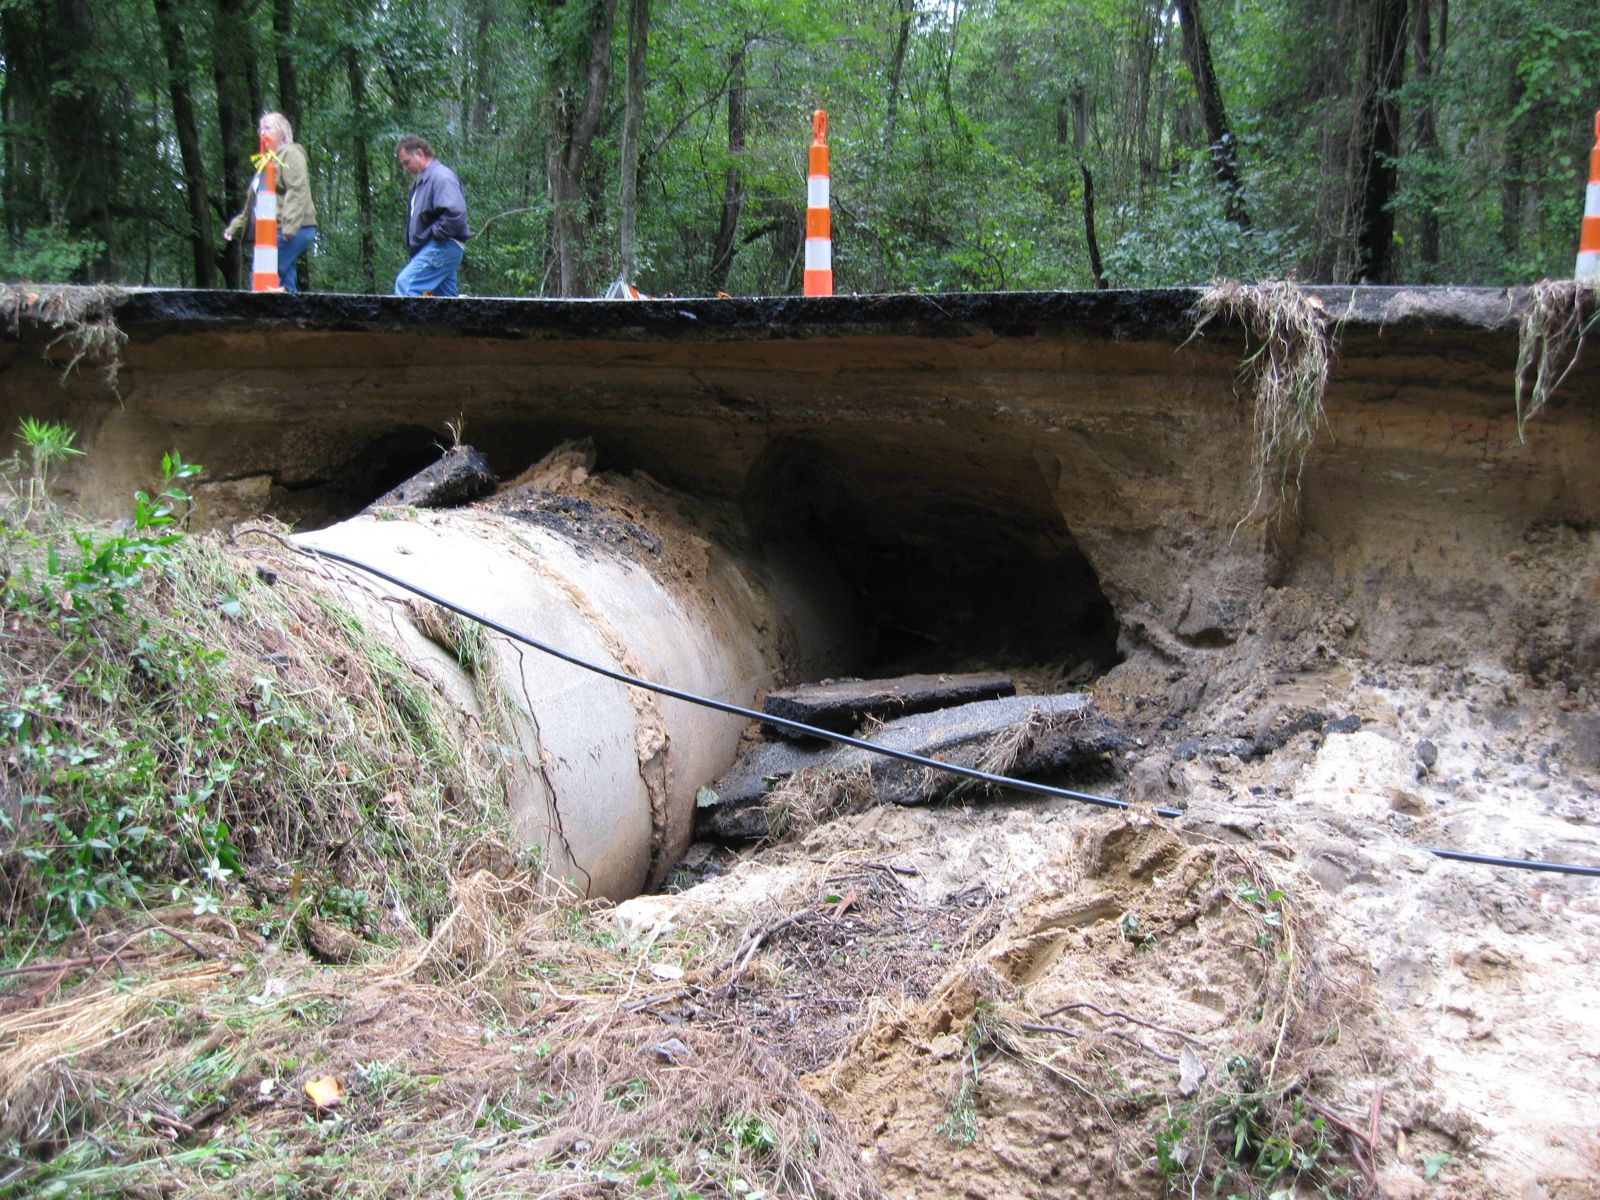
Hwy 41 Turkey Creek Bridge, Huger, SC |
Last Updated: September 3, 2022


 Coastal Flood
 Follow us on YouTube