Between the months of October and April, cold fronts routinely move through Corpus Christi, Texas. Strong gusty north or northwest (and sometimes even northeast) winds can last from less than a few hours to more than 12 hours well behind these cold fronts (i.e., "northers"). It is not uncommon for peak wind gusts to exceed 40 mph or more behind some of the stronger cold fronts which move through Corpus Christi during the cooler months of the year. This study has catalogued the strongest post-frontal peak wind gusts which have been measured at the official climatological station in Corpus Christi. A cataloging of peak wind gusts associated with tropical cyclones and severe thunderstorms has also been produced.
 |
Wind Damage from strong post-frontal winds - 02/25/2013 |
Only post-frontal wind gusts higher than 50 mph were used in this study except in a few unique situations as noted below. Post-frontal wind events which attributed most of their wind due to influences from thunderstorms were removed from consideration since the gradient winds were often times overwhelmed by thunderstorm influences. Other non-frontal wind events such as onshore flow and gravity wave-induced winds were also excluded from this study.
The entire climatological record for Corpus Christi dating back to February 1st, 1887 was used. Only measured wind gusts from official National Climatic Data Center records were used. The main observing station in Corpus Christi has moved several times since 1887 as outlined at the National Weather Corpus Christi’s station history web page. Observations from other Corpus Christi locations such as the Naval Air Station, Cabaniss Field or other Corpus Christi co-operative stations were NOT included in this wind study. The methods to measure peak wind gusts have changed over the years. The fastest 2-minute, fastest 1-minute, fastest 5-second, fastest 3-second and/or the instantaneous wind gust were all encountered in the climatological record. The highest and most recent value was used in this study.
| Peak Wind Gust (mph) | Date | Miscellaneous Information |
|---|---|---|
| 63 | 02/25/2013 | ∼ 12 hours gusting 40 mph+; ∼ 3 hours gusting 50 mph+; Several small fires; ∼ 3 hours of Blowing Dust (Mouse over to view Satellite Loop) |
| 62 | 11/20/1887 | |
| 60 | 02/27/1987 | Rain at the time of frontal passage |
| 60 | 11/16/1987 | Rain at the time of frontal passage |
| 59 | 01/18/1943 | Arctic Front |
| 57 | 02/26/1984 | ∼ 24 hours gusting 40 mph+; ∼ 5 hours of Blowing Dust |
| 57 | 02/21/1990 | ∼ 2 hours gusting 40 mph+; Raining |
| 56 | 12/24/2009 | ∼ 6 hours gusting 40 mph+; ∼ 1 hour of Blowing Dust; Rain several hours after frontal passage |
| 56 | 02/14/2010 | Arctic Front; ∼ 4 hours gusting 40 mph+; Rain several hours after frontal passage |
| 55 | 11/15/2006 | ∼ 7 hours gusting 40 mph+; ∼ 1.5 hours of Blowing Dust with 2 1⁄2 miles visibility |
| 54 | 02/21/1974 | ∼ 6 hours gusting 40 mph+ |
| 54 | 03/28/1991 | Raining |
| 54 | 11/30/2006 | ∼ 4 hours gusting 40 mph+; Raining |
| 53 | 12/06/1972 | Arctic Front; Raining |
| 53 | 01/20/1973 | ∼ 3 hours gusting 40 mph+ |
| 53 | 03/27/1977 | Rain and Thunderstorms; ∼ 8 hours after frontal passage |
| 52 | 01/20/1985 | Arctic Front; ∼ 7 hours gusting 40 mph+ |
| 52 | 12/06/1969 | |
| 52 | 01/31/2008 | |
| 52 | 01/31/1992 | |
| 52 | 03/12/1993 | Beginning of the 1993 Super Storm in the Northwest Gulf; Thunderstorms but winds stayed up well behind front |
| 52 | 02/06/1967 | Thunderstorms at frontal passage but winds stayed up well behind front |
| 52 | 03/12/1975 | Thunderstorms ∼ 1.5 hours after frontal passage but winds remained strong behind front |
| 51 | 01/12/2012 | Arctic Front |
| 51 | 02/28/2011 | Rain at the time of frontal passage but winds remained strong behind front |
| 51 | 10/09/2009 | Raining |
| 51 | 02/11/1999 | ∼ 2 hours gusting 40 mph+; Raining |
| 51 | 10/06/1998 | ∼ 12 hours of Rain and Thunderstorms |
| 51 | 10/22/2007 | ∼ 4 hours gusting 40 mph+; ∼ 30 minutes of Rain at the time of frontal passage |
| 51 | 02/21/1971 | Dust at the time of frontal passage |
| 51 | 01/22/1999 | ∼ 3 hours gusting 40 mph+ |
| 51 | 01/20/1979 | ∼ 4 hours gusting 40 mph+; Rain at the time of frontal passage |
| 51 | 04/01/1983 | ∼ 5 hours gusting 40 mph+; ∼ 5 hours of Blowing Dust as low as 8⁄10 mile visibility |
| 49* | 03/08/1998 | ∼ 3 hours gusting 40 mph+ ∼ 10 hours after frontal passage; Thunderstorm at the time of frontal passage |
| 48* | 02/15/1987 | ∼ 4 hours gusting 40 mph+ and Blowing Dust |
| 48* | 04/02/2009 | ∼ 5 hours gusting 40 mph+; Lagarto Fire (Mouse over to view Satellite Loop) |
An * indicates that these three post-frontal wind events were included in this study because they had a similar weather pattern as many of the other post-frontal high wind events. There were many other post-frontal wind events which recorded a peak wind gust of either 48 or 49 mph. Many of these sub-50 mph wind events were excluded from consideration given the large number of events in the climatological record and they did not match the weather pattern exhibited by other post-frontal high wind events.
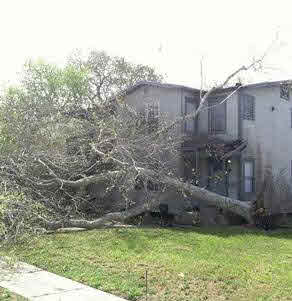 |
Tree blown down from winds - 02/25/2013 |
On February 25th, 2013 at 429 PM CDT, a truly historic event occurred in Corpus Christi. A 63 mph (55 knots) peak wind gust was measured at Corpus Christi International Airport. The 63 mph wind gust represents the strongest wind gust ever measured behind a cold front at the official station in Corpus Christi!
Earlier that day, a Pacific cold front moved through South Texas and helped to usher in very dry air from West Texas and Mexico. Despite the frontal passage, temperatures warmed up into the middle 70s. This was due to a combination of the mild Pacific airmass behind the front and subtle downslope warming effects from the northwest winds. The very dry air (humidities dropped to around 8 percent) and very strong winds resulted in extreme fire danger for most of South Texas. The very strong winds picked up loose soil and sediment (due to ongoing extreme to exceptional drought conditions) and lofted it into the air many miles downstream. Blowing dust was reported for nearly 3 hours at the Corpus Christi International Airport. Blowing dust was also observed in several other locations across South Texas as seen from satellite.
 |
Blowing Dust from the strong winds - 02/25/2013 (Mouse over for satellite view) |
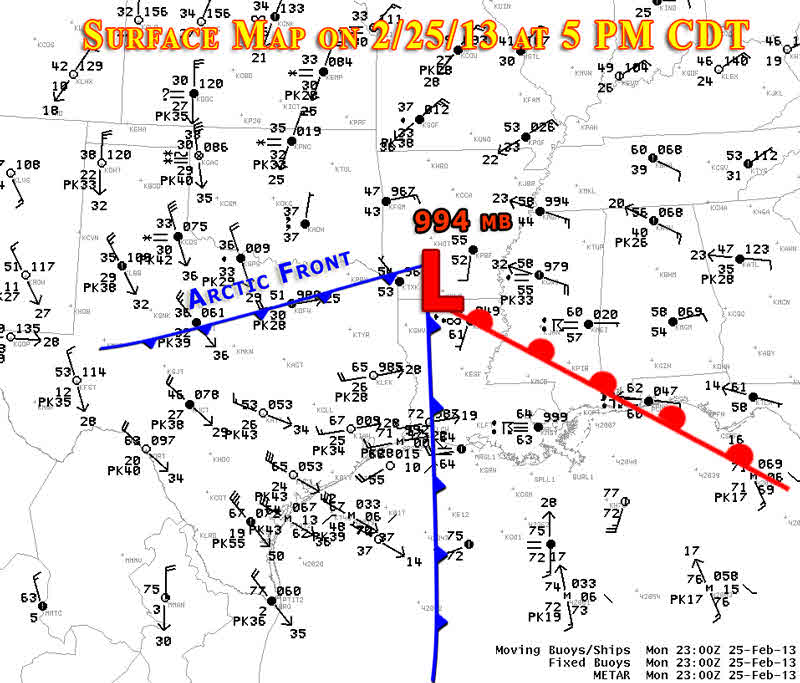
Throughout the day on the 25th, a surface low pressure area strengthened from 999 to 994 millibars (mb). The surface low pressure area moved from just west of Wichita Falls, TX in the morning of the 25th to southern Arkansas by the early evening of the 25th. Further deepening to 992 mb of the surface low pressure area occurred overnight on the 25th as it moved into southeast Missouri. At the 300 mb level, a 120-130 knot jet was situated right over South Texas throughout the day. At the 500 mb level, a strong closed low deepened from 540 to 534 dekameters (dam) as it moved from west Texas into northeast Texas and southeast Oklahoma during the day. Meanwhile at the 850 mb and 925 mb levels, an area of northwest winds of 40-50 knots was observed behind the front. Given the dry adiabatic conditions and resulting excellent mixing processes, much of these higher wind speeds above the surface were transported to the ground in the afternoon and early evening hours. Of particular note was the fact that the afternoon prediction from the morning run of the GFS model on the 25th forecast a peak wind gust of 54 knots while the observed peak wind gust was 55 knots!
 |
 |
| 300 mb Graphic on 02/25/2013 at 600 AM | 300 mb Graphic on 02/25/2013 at 600 PM |
 |
 |
| 500 mb Graphic on 02/25/2013 at 600 AM | 500 mb Graphic on 02/25/2013 at 600 PM |
 |
 |
| 850 mb Graphic on 02/25/2013 at 600 AM | 850 mb Graphic on 02/25/2013 at 600 PM |
 |
 |
| 925 mb Graphic on 02/25/2013 at 600 AM | 925 mb Graphic on 02/25/2013 at 600 PM |
A recurring meteorological weather pattern was identified with many of the strongest post-frontal high wind events which have occurred in Corpus Christi. Composites were developed (using the NCEP/NCAR Reanalysis data) from 17 post-frontal high wind events which exhibited similar weather features. While other weather patterns such as Arctic fronts can produce strong post-frontal high wind events, the weather pattern explained in the next section is by far the most common among these strong post-frontal high wind events.
| * 02/25/2013 | * 02/27/1987 | 02/26/1984 | * 12/24/2009 | 11/15/2006 | * 02/21/1974 | 01/20/1973 | 12/06/1969 | 01/31/2008 |
| 01/13/1992 | 02/21/1971 | * 01/22/1999 | 01/20/1979 | * 04/01/1983 | 03/08/1998 | 02/15/1987 | 04/02/2009 |
An * indicates that almost an exact match of weather patterns occurred with these particular high wind events.
This weather pattern manifests itself initially with a deepening surface low pressure area located over the Texas Panhandle with a trailing Pacific cold front stretching from west Texas into northern Mexico. Sometimes, a secondary Arctic cold front with much colder Arctic air behind it will be drawn into this system from the north. Approximately 12 hours later in time, the Pacific cold front moves through Corpus Christi while the deepening surface low pressure area moves into north Texas. Peak post-frontal winds are usually achieved around 12 hours after this frontal passage. At the time of peak post-frontal winds, the cold front is moving through Louisiana while the deepening surface low pressure area is located in either southern Arkansas or northern Louisiana. If an Arctic cold front is present, it is usually moving southeastward through north Texas while peak post-frontal winds are being experienced in Corpus Christi. The surface low pressure area continues to deepen for another 12-24 hours as it moves northeast into the Ohio Valley region with the trailing cold front pushing through the southern States. Meanwhile at the the 500 millibar (mb) level, an initially open trough axis deepens into a closed low as it moves eastward from the southern Rockies into the southern Plains. At the time of peak post-frontal winds in Corpus Christi, the deepening closed low is usually located in Oklahoma. This closed low deepens further 12-24 hours later as it moves northeastward into Missouri and Illinois.
The composite weather pattern indicates that an 85 to 90 knot jet streak at 300 mb moves from northern Mexico and the Big Bend region into South Texas. At the time of peak post-frontal winds, the 300 mb jet streak is situated right over South Texas. The jet streak then slowly moves eastward towards the northern Gulf coast. Meanwhile at the 500 mb level, an impressive 60 to 65 knot jet streak takes a similar path as the 300 mb jet streak. It moves from northern Mexico towards South Texas. Once again, at the time of peak post-frontal winds the jet streak (at 500 mb) is situated right over South Texas. The 500 mb jet streak then slowly moves east-northeastward towards the Deep South.
The primary reason for the strong post-frontal winds is the tightening pressure gradient around a deepening surface low pressure area. The presence of Pacific air behind these fronts means that the airmass is warmer than the airmass behind a more traditional cold front moving in from the northern Rockies and/or northern Plains. A northwest and even west direction once the front moves through can lead to minor downslope or compressional warming. These higher temperatures produce a well mixed boundary layer and thus increase the potential of higher winds above the surface transferring to the ground surface. As explained earlier, this is exactly what happened during the 02/25/2013 post-frontal high wind event. The airmass behind these Pacific cold fronts typically has a dry origin from arid and semi-arid regions of west Texas and northern Mexico. Humidities can drop to less than 40 percent at times and in rare circumstances below 10 percent. As a result, these strong post-frontal wind events can often be accompanied by extreme fire danger conditions. In fact, the 02/25/2013 and 04/02/2009 events both experienced humidities around 8 percent with winds peaking at 63 mph and 48 mph, respectively. The Lagarto fire occurred on 04/02/2009 and destroyed around 40 homes due to the very strong post-frontal winds and extremely low humidities. If a prolonged drought is ongoing and/or the soil moisture is low, then often times blowing dust is produced due to the strong post-frontal winds. The poorest visibility observed due to blowing dust was observed with the 04/01/1983 event. A visibility as low as 8⁄10 mile occurred on this particular day. Blowing dust occurred for an incredible 5 hours on that day.
 |
 |
| Surface low and frontal positions at the time of peak winds | 500 millibar closed low and trough axis positions at the time of peak winds |
 |
 |
| 500 millibar winds (U-Component in m/s) at the time of peak winds | 300 millibar winds (U-Component in m/s) at the time of peak winds |
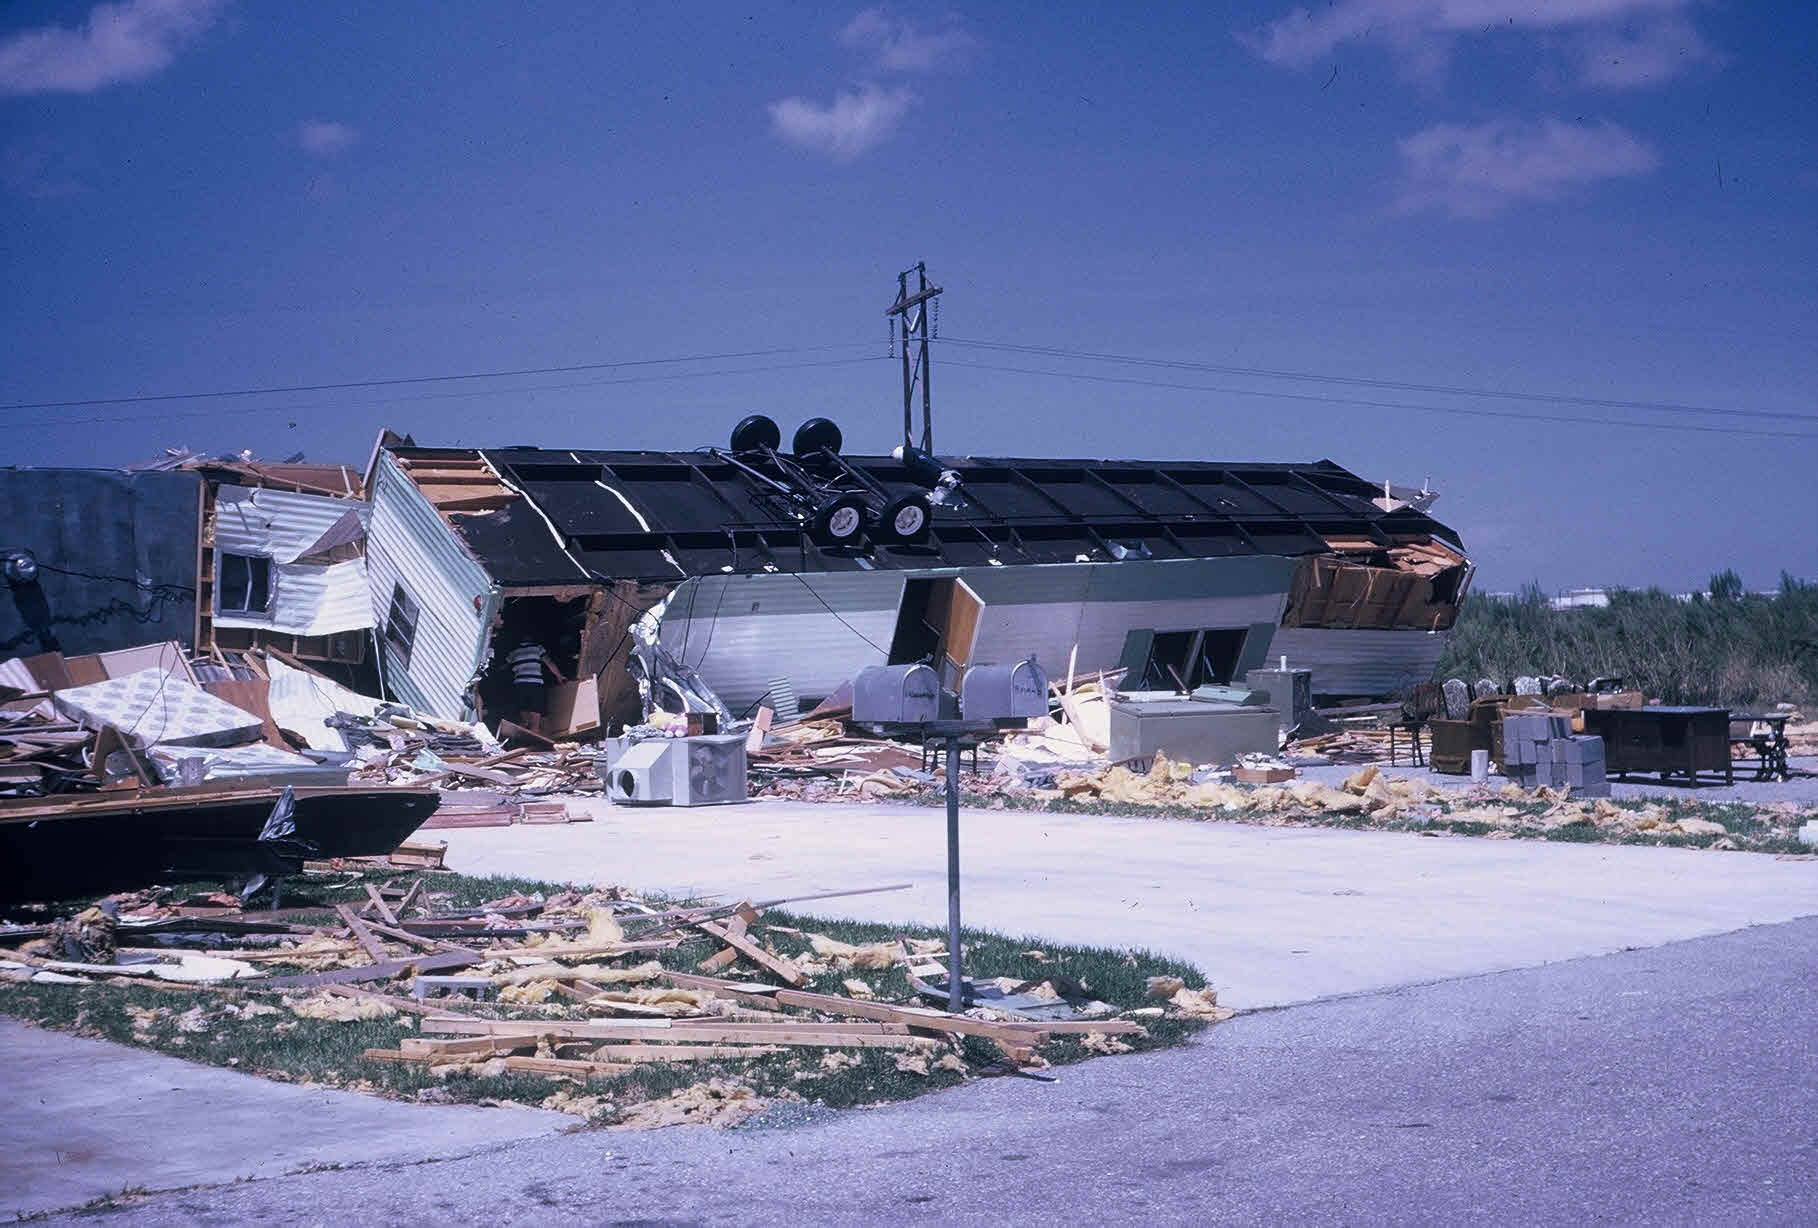 |
Wind Damage from Hurricane Celia - 08/03/1970 |
Tropical cyclones have periodically affected Corpus Christi since record keeping began. Official measured wind gusts from tropical cyclones which have affected Corpus Christi date back to the 1916 Hurricane. Prior to 1916, it is difficult to determine the measured peak wind gusts from tropical cyclones. Due to the fact that observations prior to 1933 were taken only twice a day, it is difficult to capture the peak wind gusts during this time. The June 26th, 1902 hurricane, the September 14th, 1910 hurricane, and the October 16th, 1912 hurricane most likely had higher winds than the official observations indicate due to the twice-a-day limitation. Of worthy note is the second Indianola hurricane (August, 20th, 1886) which occurred before official observations began at Corpus Christi (February 1st, 1887). According to David Roth's Texas Hurricane History, northwest winds of 75 mph occurred in Corpus Christi from this hurricane.
By far, the strongest tropical cyclone wind measured by the official Corpus Christi station was 161 mph associated with Hurricane Celia on August 3rd, 1970. Celia remains the last hurricane to make a direct hit in the Coastal Bend. Another storm of note is the 1st major hurricane of 1945 which made landfall at Port Aransas in the early morning hours on August 27th, 1945. The hurricane then proceeded to move north towards Port O’Connor during the morning of the 27th. Winds were estimated as high as 135 mph in Seadrift and Port Lavaca with this storm. Other notable wind gusts from other tropical cyclones are listed below.
| Peak Wind Gust (mph) | Date | Tropical Cyclone Name |
|---|---|---|
| 161 | 08/03/1970 | Hurricane Celia |
| 110 | 09/14/1919 | 1919 Hurricane |
| 100 | 08/18/1916 | 1916 Hurricane |
| 92 | 08/10/1980 | Hurricane Allen |
| 86 | 09/11/1961 | Hurricane Carla |
| 75 | 08/20/1886 | 2nd Indianola Hurricane |
| 75 | 08/29/1895 | 1st Hurricane of 1895 |
| 72 | 09/20/1967 | Hurricane Beulah |
| 70 | 08/26/1945 | 2nd Major Hurricane of 1945 |
| 70 | 09/10/1971 | Hurricane Fern (Tropical Storm Fern when it affected Corpus Christi) |
| 70 | 08/09/1980 | Hurricane Allen |
| 68 | 06/22/1921 | 1st Hurricane of 1921 |
| 66 | 08/27/1909 | 2nd Major Hurricane of 1909 |
| 64 | 09/11/1971 | Hurricane Fern (Tropical Storm Fern when it affected Corpus Christi) |
| 61 | 08/30/1942 | Only Major Hurricane of 1942 |
| 61 | 09/21/1967 | Hurricane Beulah |
| 61 | 09/17/1988 | Hurricane Gilbert |
| 60 | 09/14/1910 | 1st Hurricane of 1910 |
| 60 | 09/05/1955 | Hurricane Gladys |
| 57 | 09/05/1933 | 2nd Major Hurricane of 1933 |
| 57 | 07/31/1978 | Tropical Storm Amelia |
| 57 | 09/16/1988 | Hurricane Gilbert |
| 56 | 07/25/1934 | 3rd Hurricane of 1934 |
| 55 | 06/27/1936 | 1st Hurricane of 1936 | 55 | 08/22/1999 | Hurricane Bret |
| 55 | 09/07/2010 | Tropical Storm Hermine |
| 54 | 08/23/1999 | Hurricane Bret |
| 53 | 07/24/2008 | Hurricane Dolly |
 |
 |
| Hurricane Bret: 08/22/1999 at 929 PM | Hurricane Bret: 08/23/1999 at 625 AM |
 |
 |
| Tropical Storm Hermine: 09/07/2010 at 608 AM | Hurricane Dolly: 07/24/2008 at 424 AM |
 |
Wind Damage from a Severe Squall Line - 01/09/2011 |
The official station in Corpus Christi has experienced seventeen severe thunderstorm wind gusts dating back to 1888. Severe thunderstorm winds are defined as 58 mph or greater. Many more severe thunderstorms have undoubtedly occurred in Corpus Christi and produced severe thunderstorm wind gusts in other parts of the city. These particular events were not considered since actual severe thunderstorm winds were never observed at the official station in Corpus Christi. The June 2nd, 2010 double squall line event was such an event where portions of the south side of Corpus Christi experienced winds around 90 mph while the official station at Corpus Christi International Airport only measured a peak wind gust of 54 mph. Many other similar examples exist in the climatological record and will not be considered since this study limited its findings to measured peak wind gusts for the official climatological station.
Many of the highest winds were associated with approaching squall lines from the west or north. Bowing segments along these squall lines were often observed and indicative of strong straight-line winds. Squall lines with bowing segments are often referred to in the meteorological community as a quasi-linear convective system (QLCS). The January 9th, 2011 severe thunderstorm wind event was associated with an approaching QLCS from the west. Other severe wind events were associated with either the forward flank downdraft or rear flank downdraft from an approaching supercell thunderstorm. Below are the severe thunderstorm events which produced the strongest measured wind gusts at the official station in Corpus Christi.
| Peak Wind Gust (mph) | Date | Miscellaneous |
|---|---|---|
| > 75 | 05/20/1947 | Cold front; Sustained Winds of 70 mph at 400 PM |
| 75 | 10/23/2002 | Peak gust at 419 AM |
| 69 | 01/09/2011 | Cold front; Peak gust at 402 AM |
| 69 | 05/28/1888 | Cold front; 1925 & 1927 LCDs indicated 80 mph winds but were later revised downward to 69 mph. |
| 68 | 03/19/2016 | Severe Bow Echo; Peak gust at 1242 AM |
| 67 | 03/06/2008 | Pair of supercells with winds due to the rear-flank downdraft of one and the forward-flank downdraft from another; Peak gust at 221 PM |
| 67 | 04/15/1994 | Cold front; Peak gust at 1018 PM |
| 63 | 05/18/1999 | Cold front; Peak gust at 305 AM |
| 62 | 05/21/1980 | Peak gust at 742 AM |
| 62 | 05/26/1974 | Cold front; Peak gust at 548 PM |
| 61 | 06/03/1988 | Peak gust at 328 AM |
| 60 | 05/10/2012 | Peak gust at ∼1030 PM |
| 60 | 03/10/2008 | Cold front; Peak gust at 232 PM |
| 60 | 05/08/2005 | Rear-flank downdraft from a southeast-moving supercell; Peak gust at 712 PM |
| 60 | 05/21/1985 | Peak gust at 327 AM |
| 60 | 06/11/1906 | Cold front; Peak gust ∼ 8 PM |
| 59 | 08/25/2011 | Peak gust at 358 PM |
| 58 | 09/09/2001 | Cold front; Peak gust at 115 PM |
 |
 |
| 10/23/2002 at 417 AM | 1/9/2011 at 404 AM |
 |
 |
| 3/6/2008 at 220 PM | 5/18/1999 at 305 AM |
 |
 |
| 5/10/2012 at 1027 PM | 3/10/2008 at 233 PM |
 |
 |
| 05/08/2005 at 713 PM | 08/25/2011 at 380 PM |
 |
|
| 09/09/2001 at 114 PM |


 Follow us on YouTube