|
|
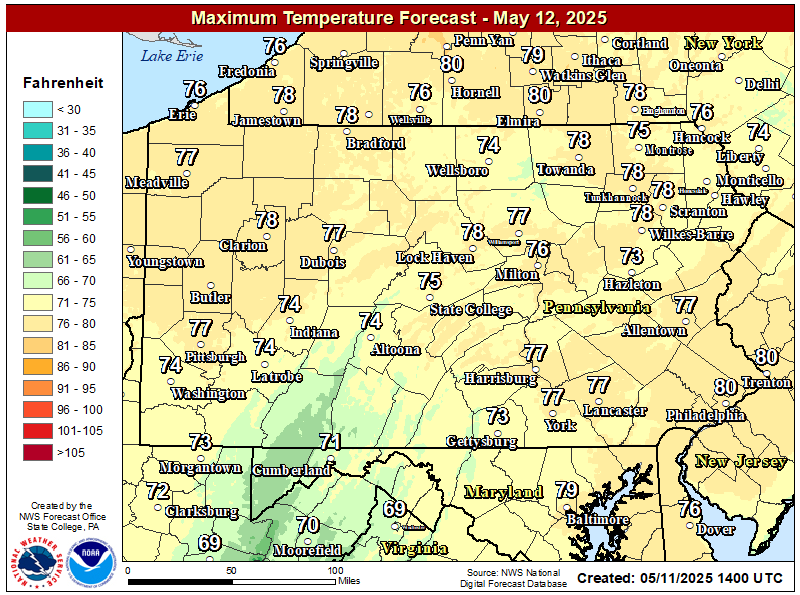
Today's Maximum TemperatureMap displays 24 hour Maximum Temperature for Day 1. Map is updated every time the forecaster issues a new forecast. |
|
Tomorrow's Maximum TemperatureMap displays 24 hour Maximum Temperature for Day 2. Map is updated every time the forecaster issues a new forecast. |
|
|
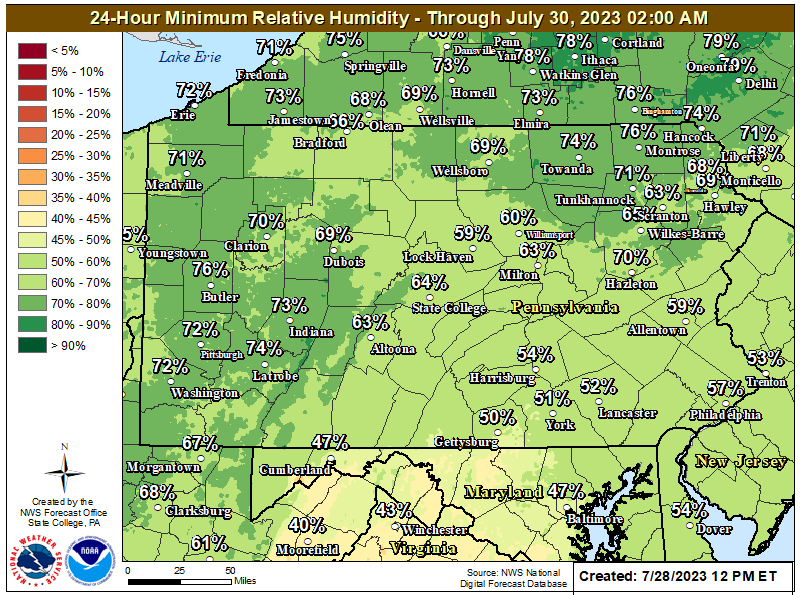
Today's Minimum Relative HumidityMap displays 24 hour minimum relative humidity values for Day 1. Map is updated every time the forecaster issues a new forecast. |
 |
Tomorrow's Minimum Relative HumidityMap displays 24 hour minimum relative humidity values for Day 2. Map is updated every time the forecaster issues a new forecast. |
|
|
|||
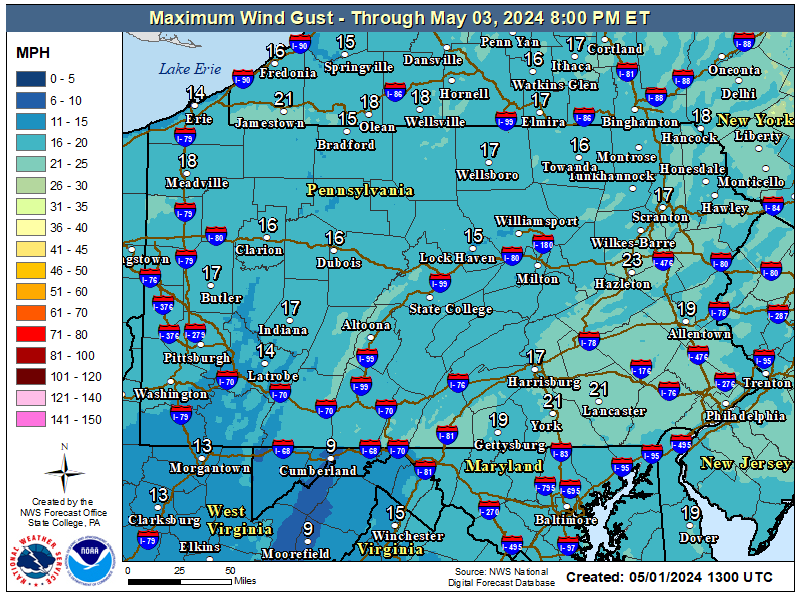 |
Today's Maximum Wind Gust
Map is updated every time the forecaster issues a new forecast. |
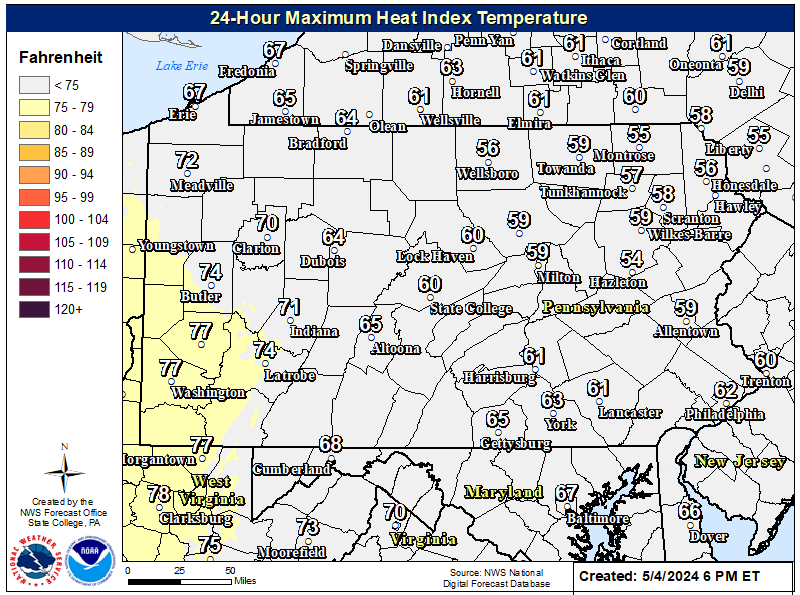 |
24 Hour Maximum Heat Index TemperatureMap displays the maximum heat index temperature for the next 24 hours. Map is updated every time the forecaster issues a new forecast. |
|
|
|||
Today's OutlookThe Day 1 Outlook covers the 24-hour period from 12Z on the morning of product issuance to 12Z the following morning, with the update covering the 19-hour period from 17Z at issuance to 12Z the following morning. |
|
Tomorrow's OutlookThe Day 2 Outlook covers the following 24-hour period after Day 1 out to 48 hours. The Day 2 Fire Weather Outlook is scheduled for issuance at 10Z and is updated at 20Z. |
|
|
|
Day 3-8 OutlookThe Day 3-8 Outlook covers the period of 48 to 192 hours from 12Z on the morning of product issuance. The Day 3-8 Fire Weather Outlook is scheduled for issuance at 22Z. |
 use Firefox to view
|
Short-Range Ensemble Forecast (SREF)Short-Range Ensemble Forecast is produced by postprocessing the 21 members NCEP SREF plus the operational WRF-NAM for a total of 22 members. Special emphasis is placed on high-impact, mesoscale guidance including fire weather. |
Weather HazardsMap displays active watch, warnings, advisories and short term forecasts in the lower 48 states. Map automatically refreshes every five minutes. |
Surface AnalysisThe Weather Prediction Center (WPC) produces surface maps which depicts the analysis of highs, lows, fronts, troughs, outflow boundaries, squall lines, and drylines. |
|
|
River Forecast PointsMap displays river points in Central Pennsylvania. Just click on the point where you want a forecast. Map is updated every time a new observation or forecast is generated. |
|
Observed PrecipitationMap displays observed precipitation in the last 24 hours. |
|
|
National Rainfall Forecasts
National Rainfall Forecasts. Mouse over each day for a quick view and click on the links to see a larger image for that day. |
|
Multi-Day Rainfall Forecasts
Multi-Day National Rainfall Forecasts. 2-Day, 3-Day, or 5-Day Total Amount Mouse over each day for a quick view and click on the links to see a larger image for that day. |
|
|
24 Hour Total Precipitation ForecastMap displays 24hr forecast precipitation amounts. Map is updated every time the forecaster issues a new forecast. |
|
Total Precipitation ForecastMap displays a Storm Total forecast of precipitation amounts. Map is updated every time the forecaster issues a new forecast. |
|
|
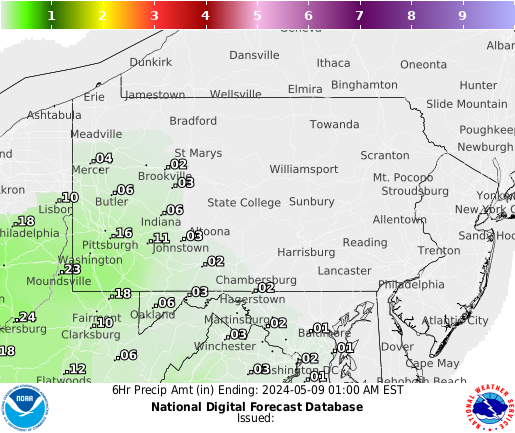
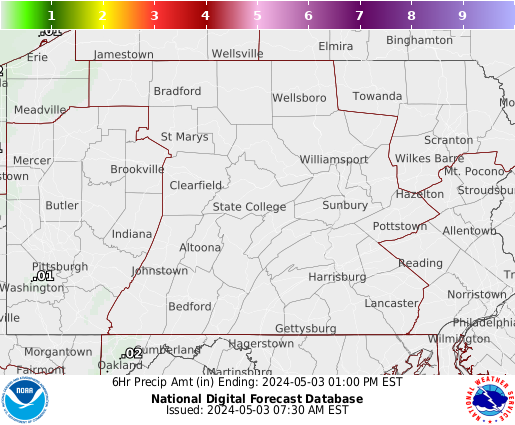
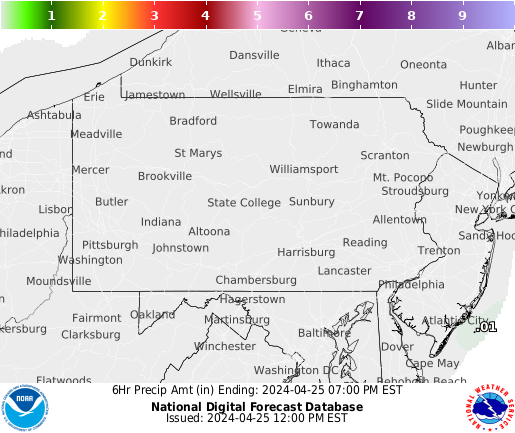
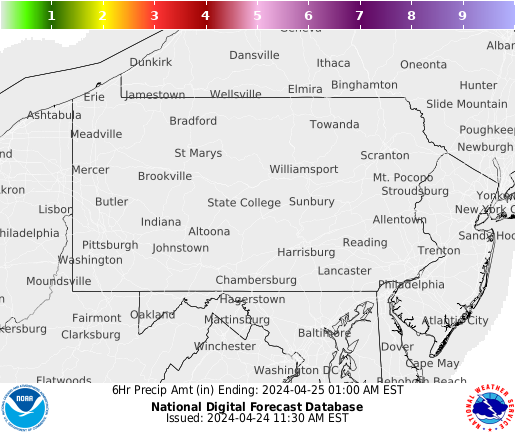
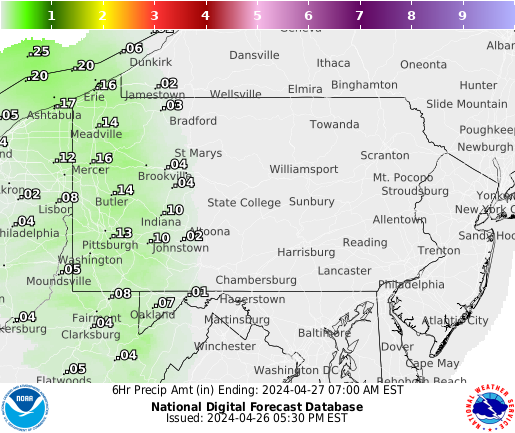
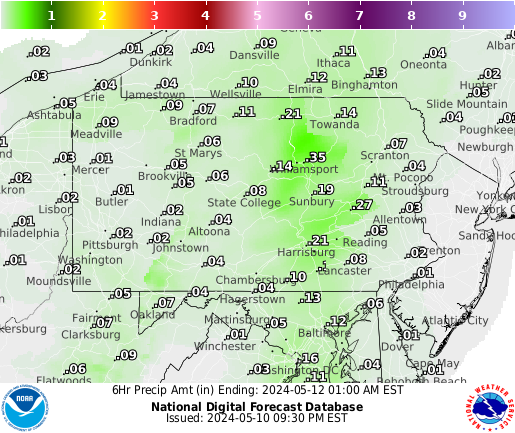
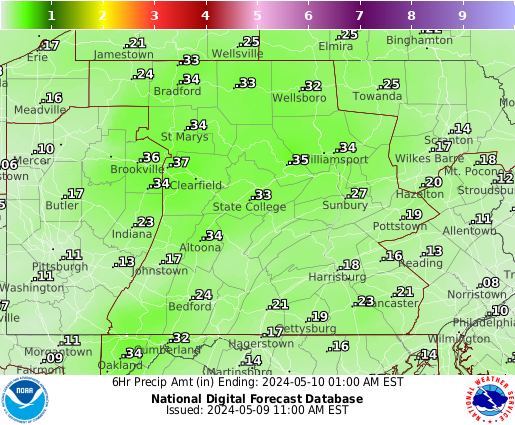
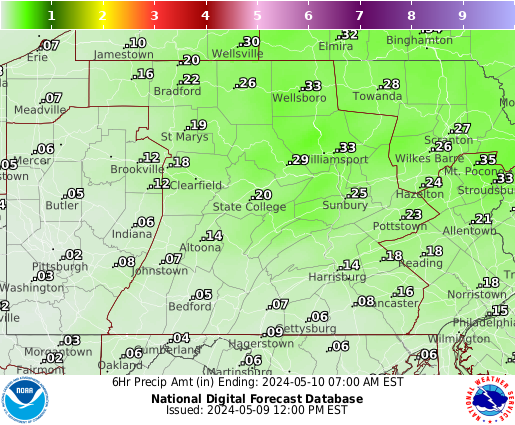
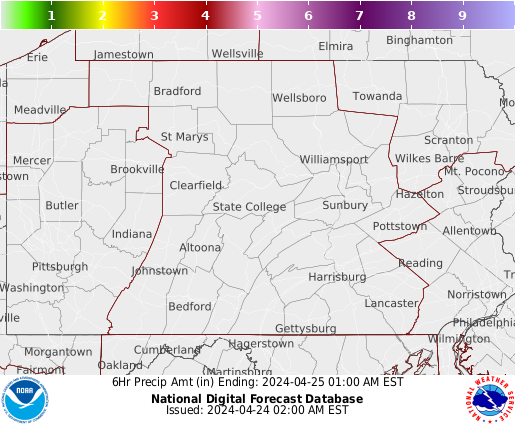
6 Hour Precipitation Forecast
Map displays 6hr forecast precipitation amounts. Mouse over each period for a quick view and click on the links to see a larger image for that period.
|
|
6 Hour Precipitation Forecast for County Warning AreaMap displays 6hr forecast precipitation amounts for Central Pennsylvania. Mouse over each period for a quick view and click on the links to see a larger image for that period. |
|
|
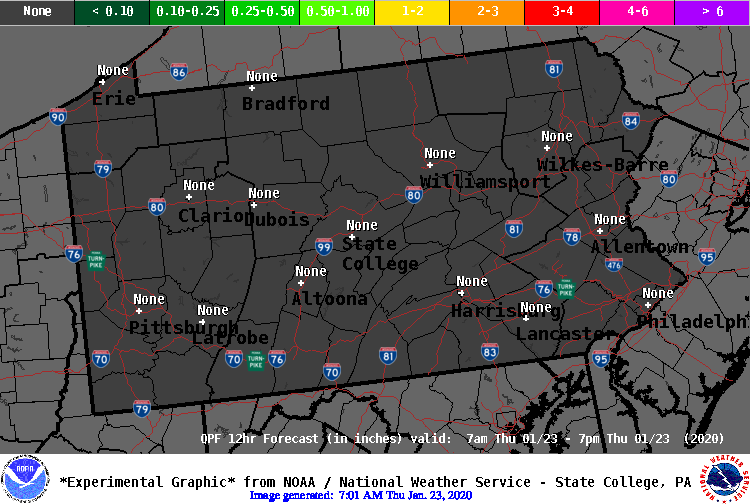
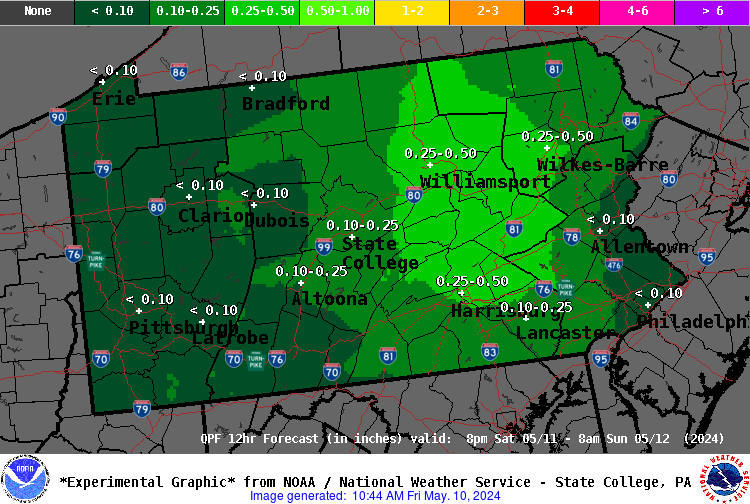
12 Hour Precipitation Forecast
Map displays 12hr forecast precipitation amounts. Mouse over each period for a quick view and click on the links to see a larger image for that period. |
|
|
Severe Storm Reports
|
 |
Rain, Snow, Ice and Wind Reports
|
|
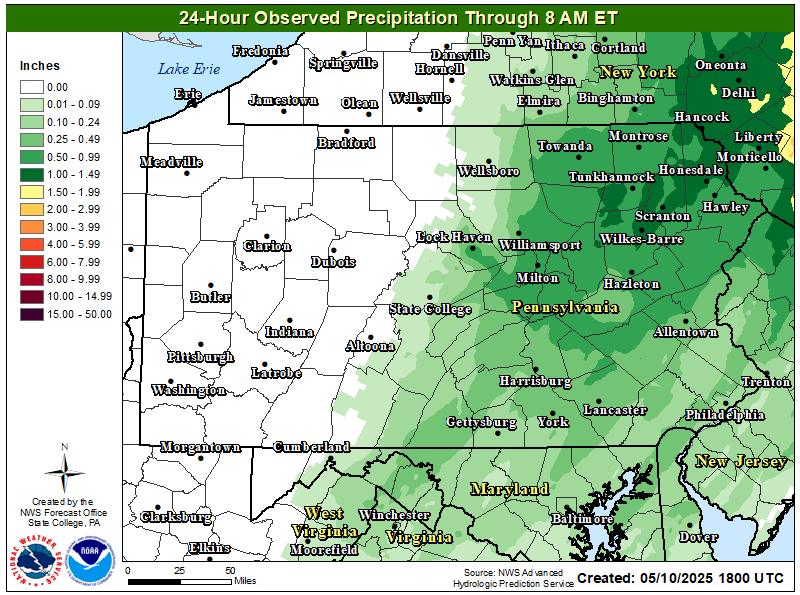 |
24 Hour Observed Precipitation
Map displays 24 hour observed precipitation amounts. |
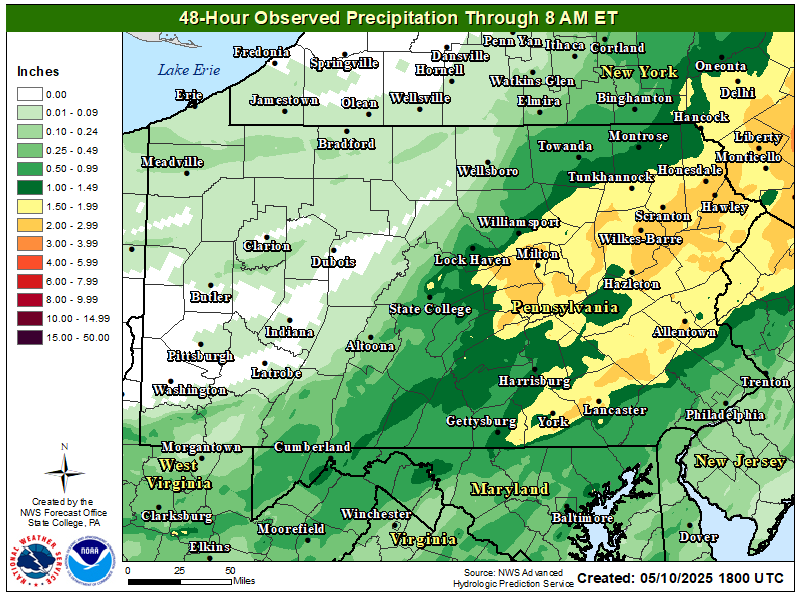 |
48 Hour Observed Precipitation
Map displays 48 hour observed precipitation amounts. |
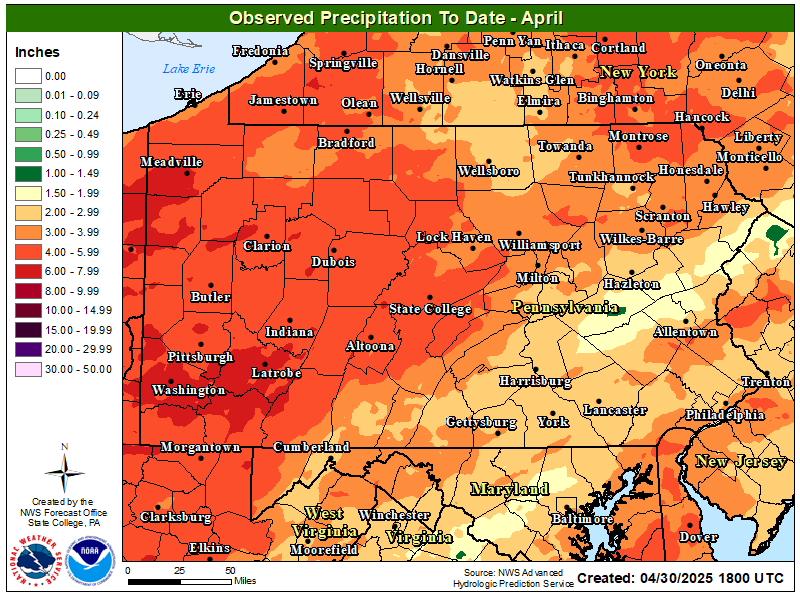 |
Month To Date Precipitation
Displays precipitation total from the first of the month to the current day. |
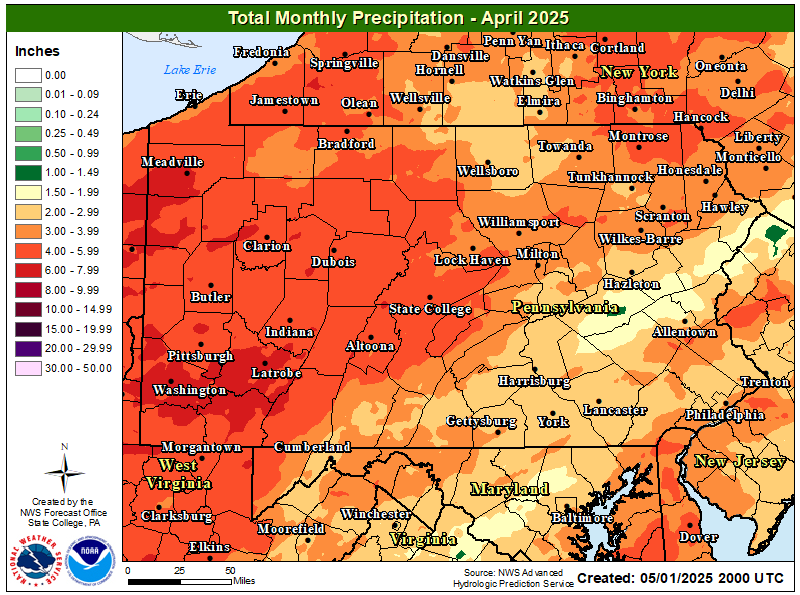 |
Monthly Precipitation from Previous Month
Displays 30 day precipitation total from the previous month. |
|
|
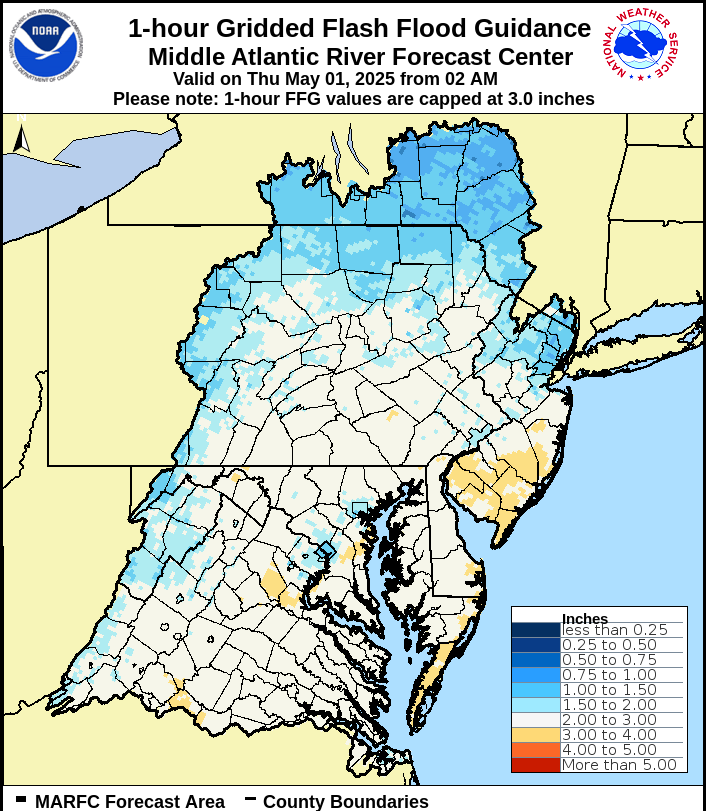
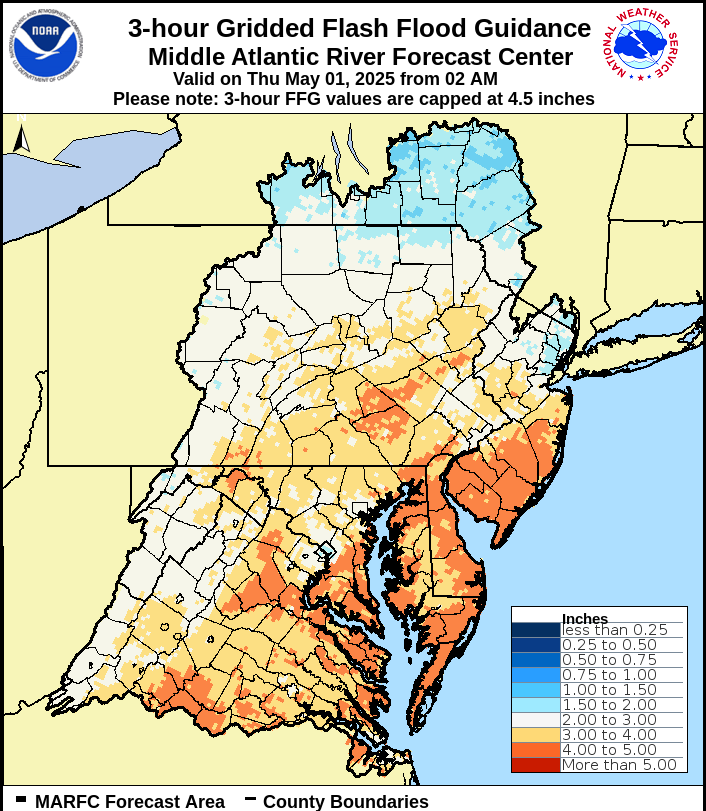
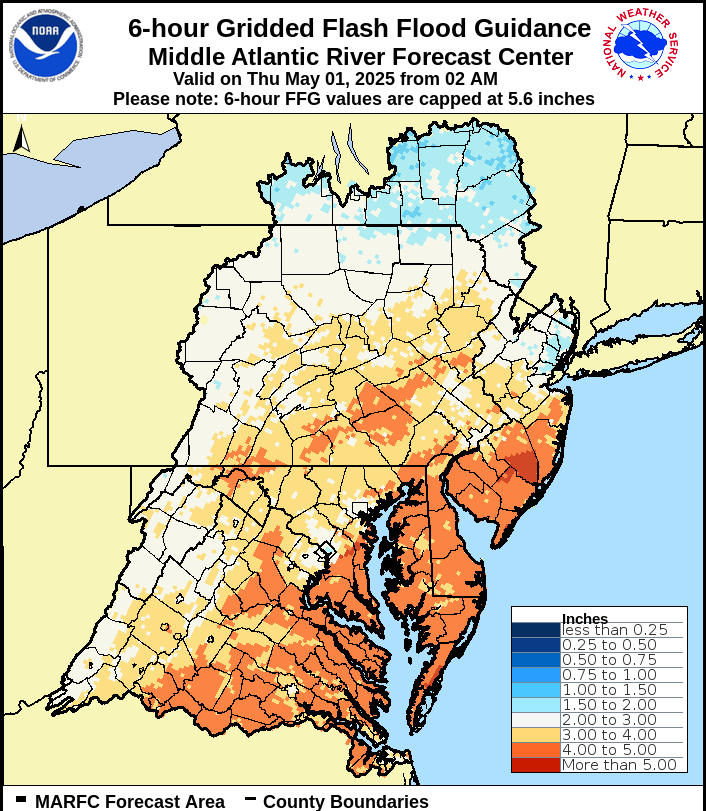
Flash Flood GuidanceFlash Flood Guidance is an estimate of the amount of rainfall required over a given area during a given duration to cause small streams to flood. Mouse over each period for a quick view and click on the links to see a larger image for that period. |
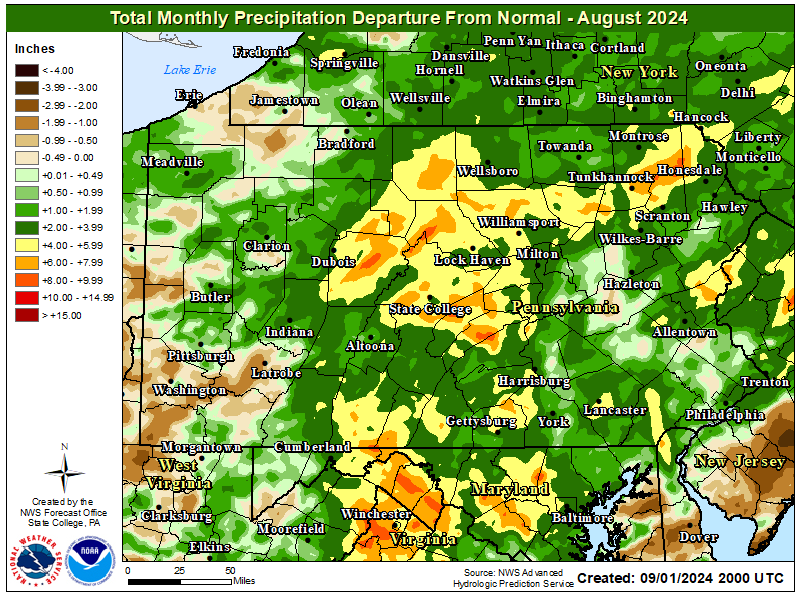 |
Precipitation / Departure
Precipitation Departure from Normal |
 |
Weather HazardsMap displays active watch, warnings, advisories and short term forecasts in the lower 48 states. Map automatically refreshes every five minutes. |
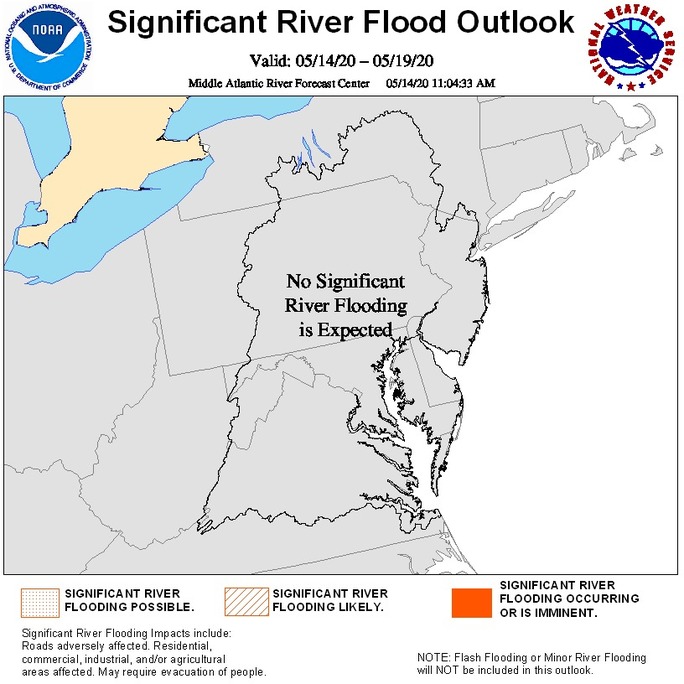 |
Significant River Flood OutlookThisFlood Outlook is intended to provide a general outlook for significant river flooding. It is not intended to depict all areas of minor flooding or small-scale events such as localized flooding and/or flash flooding. |
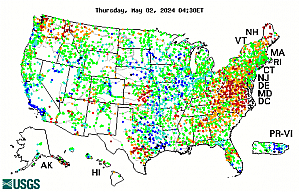 |
Historical StreamflowMap of real-time streamflow compared to historical streamflow for the day of the year. |
 |
National Snow AnalysesIncludes data on snow water equivalent, snow depth and more. The data can be view for a day or animated for a two week period or a seaon. |
|
|
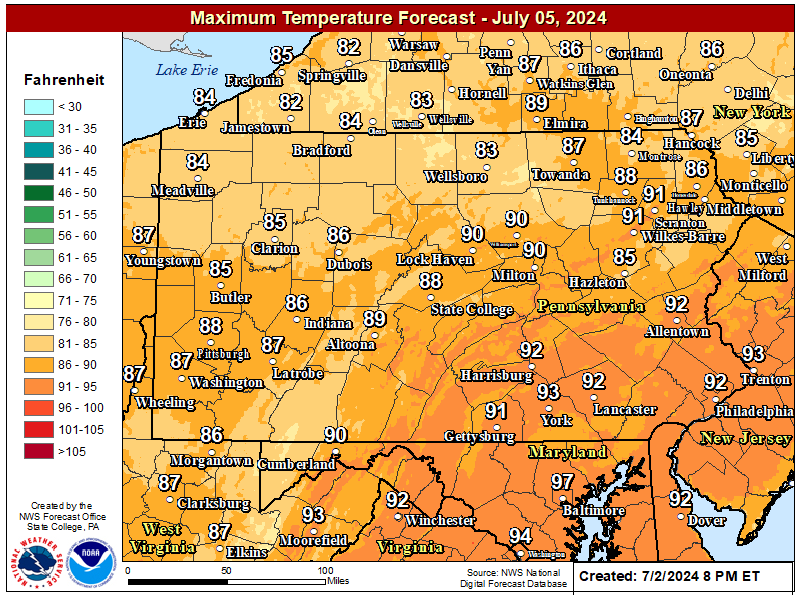
Today's Maximum Temperature
Map is updated every time the forecaster issues a new forecast. |
|
Tomorrow's Maximum TemperatureMap displays the maximum temperature for day two. Map is updated every time the forecaster issues a new forecast. |
 |
Day 3 Maximum TemperatureMap displays the maximum temperature for day three. Map is updated every time the forecaster issues a new forecast. |
|
24 Hour Maximum Heat Index TemperatureMap displays the maximum heat index temperature for the next 24 hours. Map is updated every time the forecaster issues a new forecast. |
|
|
|||
Weather HazardsMap displays active watch, warnings, advisories and short term forecasts in the lower 48 states. Map automatically refreshes every five minutes. |
Surface AnalysisThe Weather Prediction Center (WPC) produces surface |
State College Radar
|
Pittsburgh Radar |
Ohio Valley |
Northeast |
 |
Convective OutlookDay 1
Convective outlook for organized severe thunderstorms over the region for Day 1. |
 |
Convective OutlookDay 2
Convective outlook for organized severe thunderstorms over the region for Day 2. |
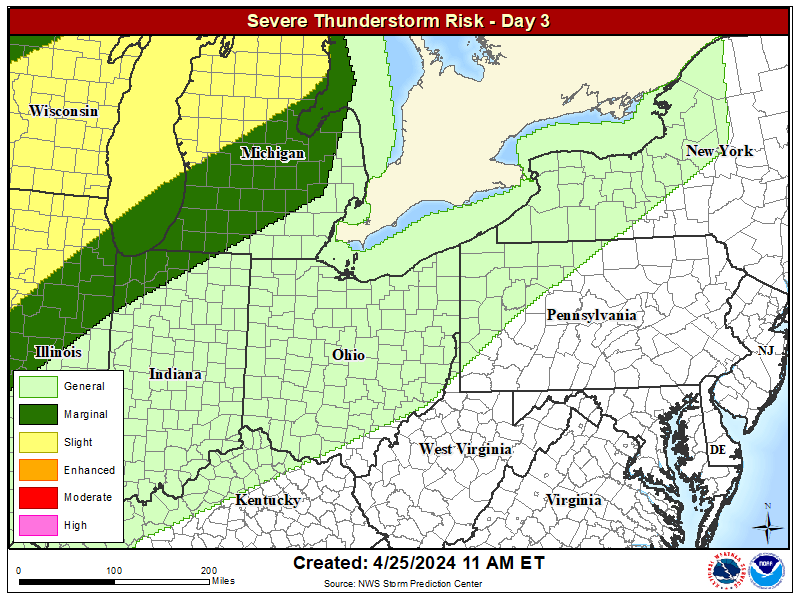 |
Convective OutlookDay 3
Convective outlook for organized severe thunderstorms over the region for Day 3. |
 |
Storm Prediction Center Overview Graphic / MapRadar of the contiguous United States with Storm Prediction Center (SPC) products - Day 1. |
|
|
Convection OutlooksConvective outlook for organized severe thunderstorms over the contiguous United States. |
|
Current WatchesGraphic showing any severe thunderstorm and tornado watches which are in effect over the contiguous United States. |
Surface AnalysisThe Weather Prediction Center (WPC) produces surface maps which depicts the analysis of highs, lows, fronts, troughs, outflow boundaries, squall lines, and drylines. |
 |
Mesoscale DiscussionsDescribe what is currently happening, what is expected in the next few hours, the meteorological reasoning for the forecast, and when / where SPC plans to issue the watch. |
|
 |
Upper Air SoundingsSkew-T charts for all observed soundings across the United States. An archive of seven days of data is available. |
|
Storm ReportsThese reports are preliminary and are plotted and listed "as is" from NWS Local Storm Reports usually sent in realtime. |
Severe Storm Reports
|
|||
|
|
Forecast ToolsIncluding upper air maps, upper air soundings, mesoanalysis graphics, Short-Range Ensemble Forecast (SREF), Storm-Scale Ensemble of Opportunity (SSEO) and Compmap. |
|
Mesoscale AnalysisNine fixed regional sectors and a national sector provide hourly gridded mesoanalysis graphics across the CONUS. |
|
|
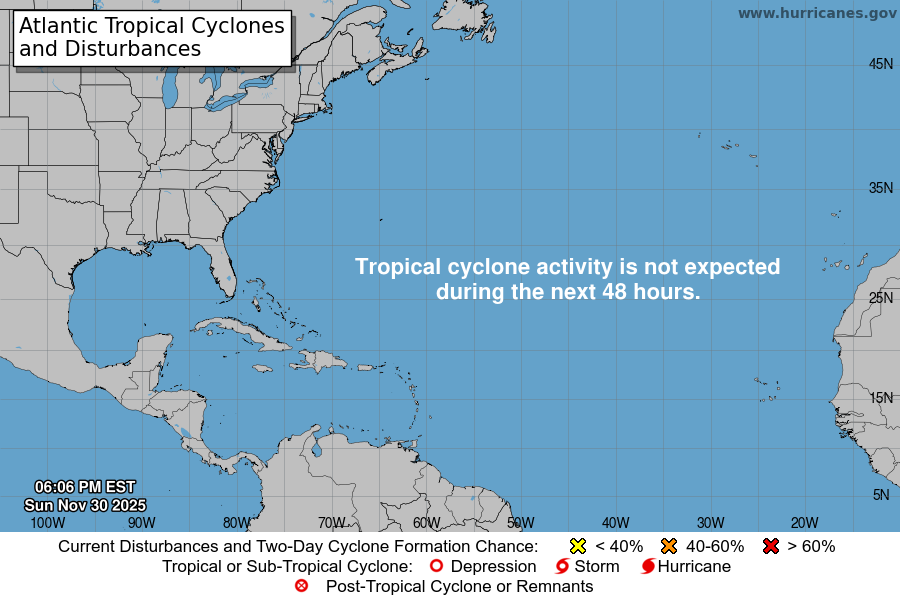
Active Tropical CyclonesIndicates areas/chances of tropical/sub-tropical cyclone development over the next 48 hours. |
|
Graphical Tropical Weather OutlookHighlights the location of areas of disturbed weather and shows the 48 hour probabilistic genesis potential. |
||||||||||||||||
|
|
Tropical Cyclone Potential ImpactsThe TCI Graphics web site is an internet-based decision-support service consisting of at least four graphics: high wind impacts, coastal flooding impacts, inland flooding impacts, and tornado impacts. |
|
NHC's Tropical Satellite Imagery Page
Numerous images and loops for various sectors can be found here
|
||||||||||||||||
|
|
Tropical Atlantic Weather MapSurface analysis of weather features across the tropical Atlantic. |
|
NHC's Tropical Satellite Imagery Page
Numerous images and loops for various sectors can be found here
|
||||||||||||||||
Surface AnalysisThe Weather Prediction Center (WPC) produces surface maps which depicts the analysis of highs, lows, fronts, troughs, outflow boundaries, squall lines, and drylines. NOAA nowCOAST - GIS mapping Portal |
 |
RadarWSR-88D Doppler Radar State College | Loop |
|||||||||||||||||
|
|
Weather HazardsMap displays active watch, warnings, advisories and short term forecasts in the lower 48 states. Map automatically refreshes every five minutes. |
|
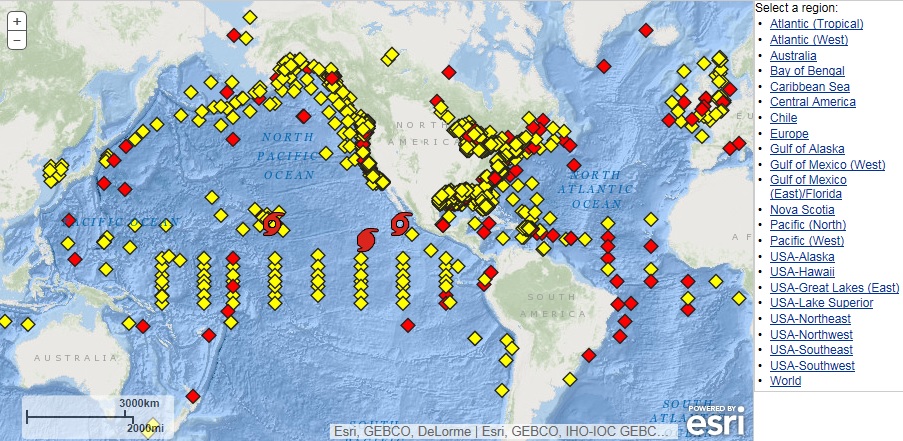
National Data Buoy CenterNDBC provides hourly observations from a network of about 90 buoys and 60 Coastal Marine Automated Network stations. All stations measure wind (speed/direction/gust) and barometric pressure and air temperature. |
||||||||||||||||
|
|
Storm SurgeAlong the coast, storm surge is often the greatest threat to life and property from a hurricane. The size of a storm surge for a particular location depends on a number of factors. Storm surge is very sensitive to the shape of the coast, and to changes in storm track, intensity, forward speed, and size. Tidal height at the time of maximum storm surge is an important factor. |
|
Saffir-Simpson Hurricane Wind ScaleCategory 1 to 5 rating based on a hurricane's sustained wind speed. |
||||||||||||||||
Tropical Cyclone ClimatologyThe official hurricane season for the Atlantic Basin (the Atlantic Ocean, the Caribbean Sea, and the Gulf of Mexico) is from June 1st to November 30th. The peak of the season is from mid-August to late October. However, deadly hurricanes can occur anytime in the hurricane season. |
|
Historical Hurricane TracksNOAA Historical Hurricane Tracks Tool - interactive database. More than 6,000 tropical cyclones, ranging from 1842 and occurring in over seven major ocean basins around the world, are now searchable thanks to the incorporation of NOAA’s International Best Track Archive for Climate Stewardship (IBTrACS) data set. |
|
|
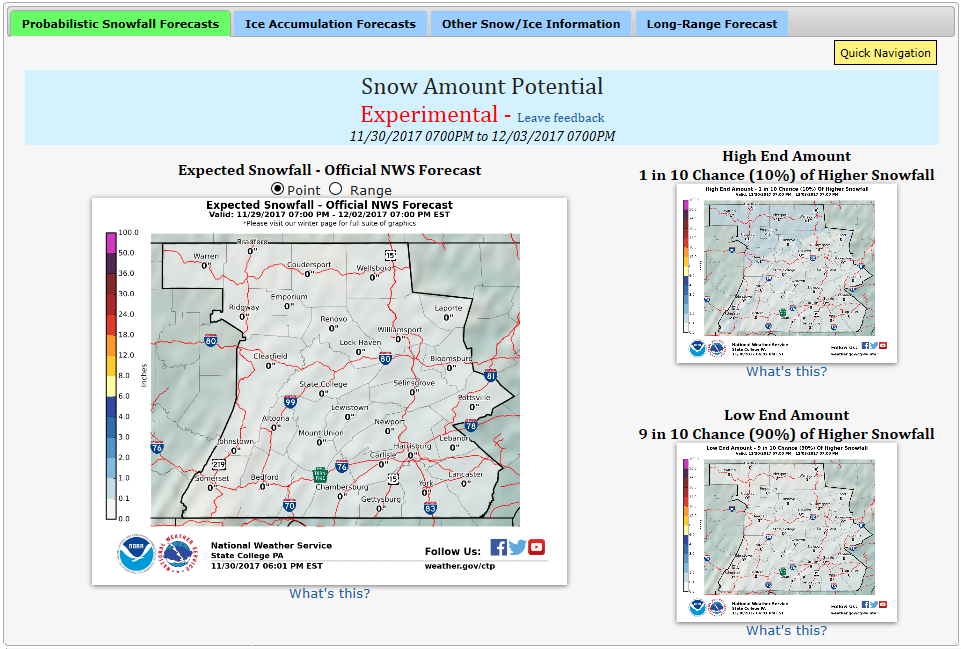
Storm Total Snow ForecastShows current Storm Total Snow forecast. Map is updated every time the forecaster issues a new forecast. |
 |
Storm Total Ice ForecastShows current Storm Total Snow forecast. Map is updated every time the forecaster issues a new forecast. |
|
Snow, Ice and Wind Reports
|
|
Probability Snow and Ice
Shows the probability of Snow or Ice accumulation for various ranges of snow or ice for an impending storm. Displays minimum amount, maximum amount, and most likely amount snowfall graphics. Updated 2 times per day. |
|
|
|||
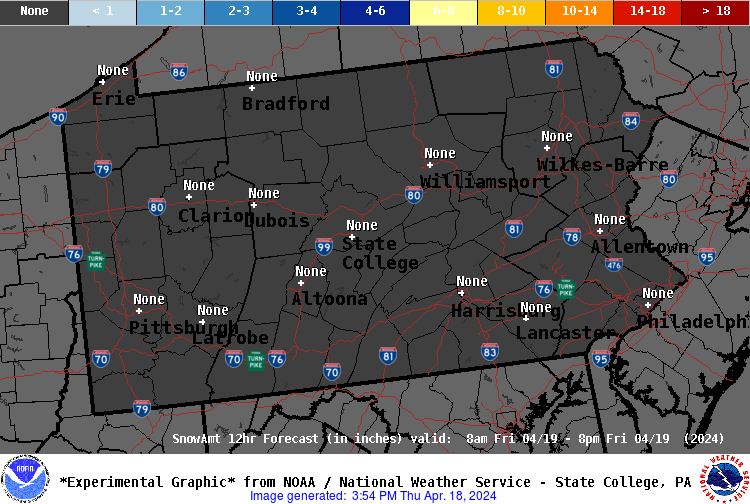
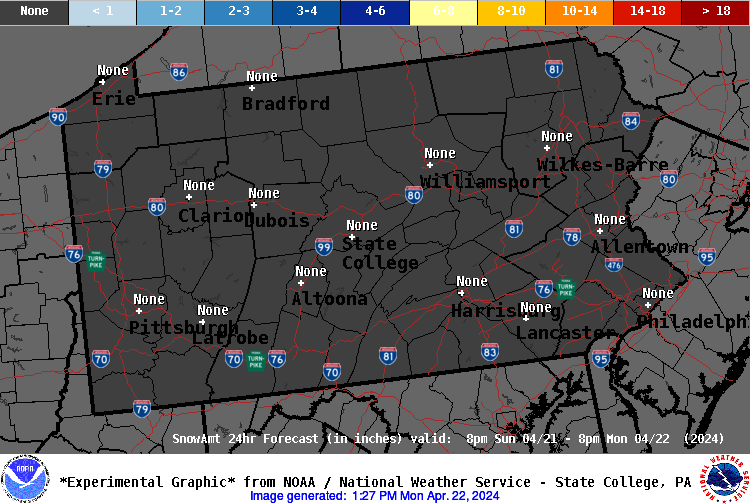
12 Hour Snowfall ForecastShows forecast snowfall accumulations in 12 hour increments. Mouse over each period for a quick view and click on the links to see a larger image for that period. Map is updated every time the forecaster issues a new forecast. |
|
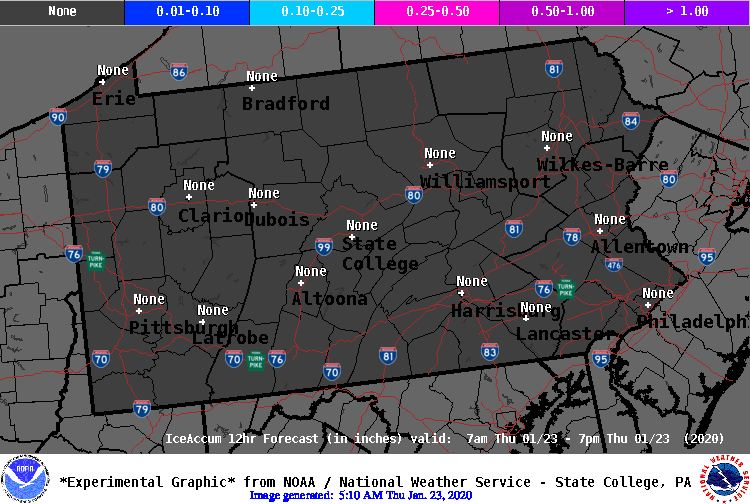
12 Hour Ice Accumulation ForecastShows forecast ice accumulations in 12 hour increments. Mouse over each period for a quick view and click on the links to see a larger image for that period. Map is updated every time the forecaster issues a new forecast |
|
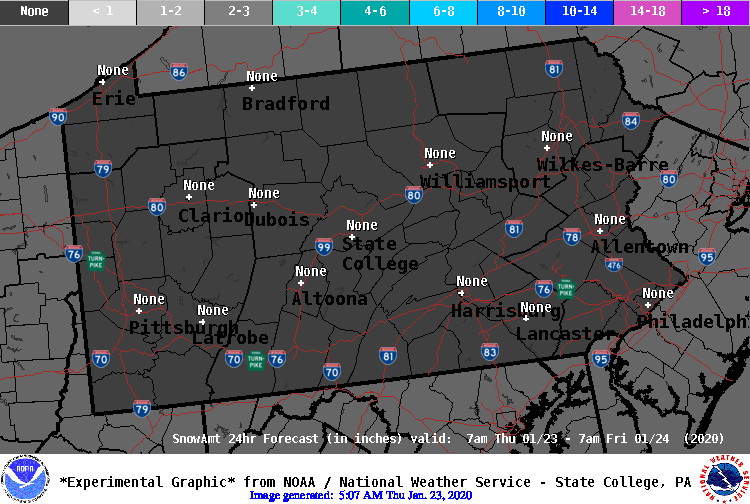
24 Hour Snow Accumulation ForecastShows forecast snow accumulations in 24 hour increments for the next 2 periods. Mouse over each period for a quick view and click on the links to see a larger image for that period. Map is updated every time the forecaster issues a new forecast. |
|
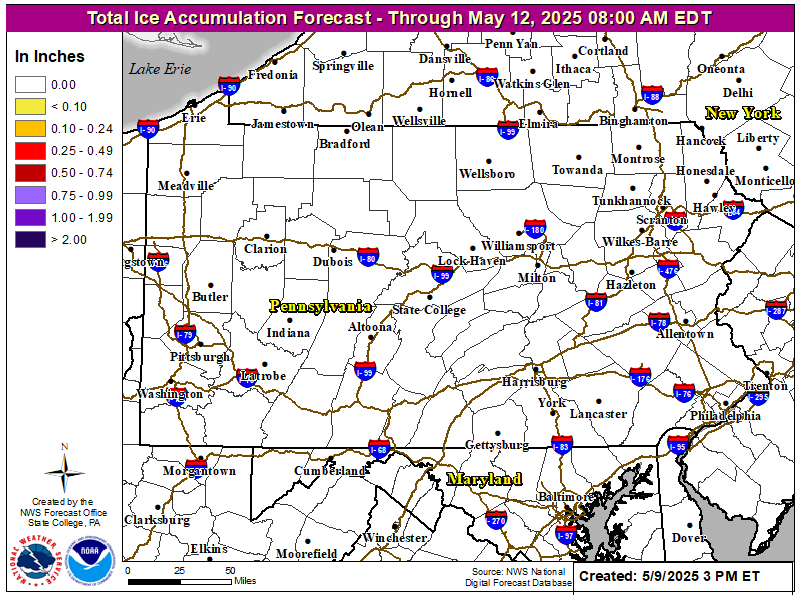
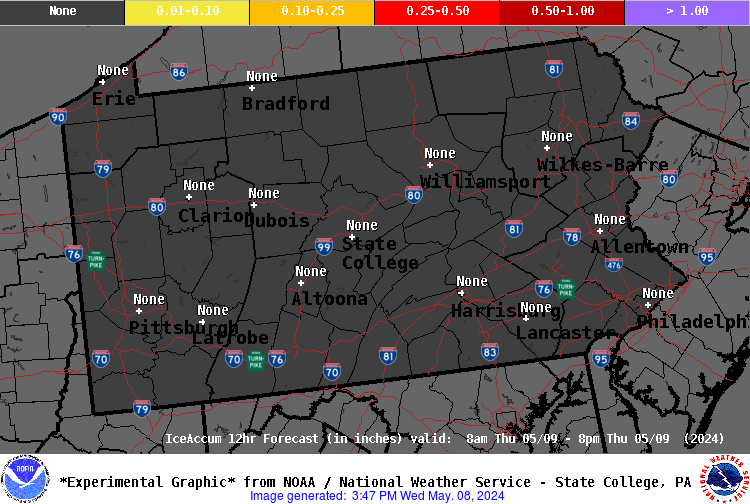
24 Hour Ice Accumulation ForecastShows forecast ice accumulation for the next 24 hours. Map is updated every time the forecaster issues a new forecast. |
|
 |
48 Hour Snowfall ForecastShows forecast snowfall for the next 48 hours. Map is updated every time the forecaster issues a new forecast. |
|
|
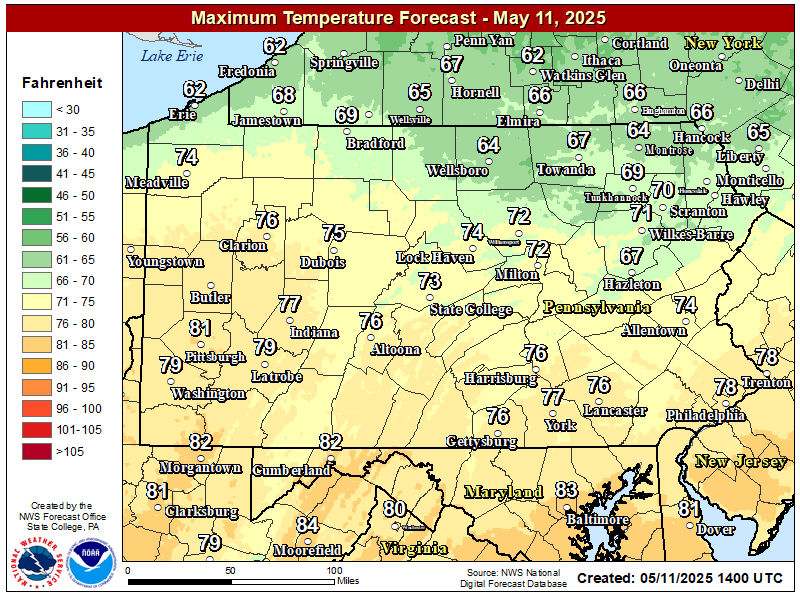 |
Today's Maximum TemperatureMap displays the maximum temperature for day one. Map is updated every time the forecaster issues a new forecast. |
 |
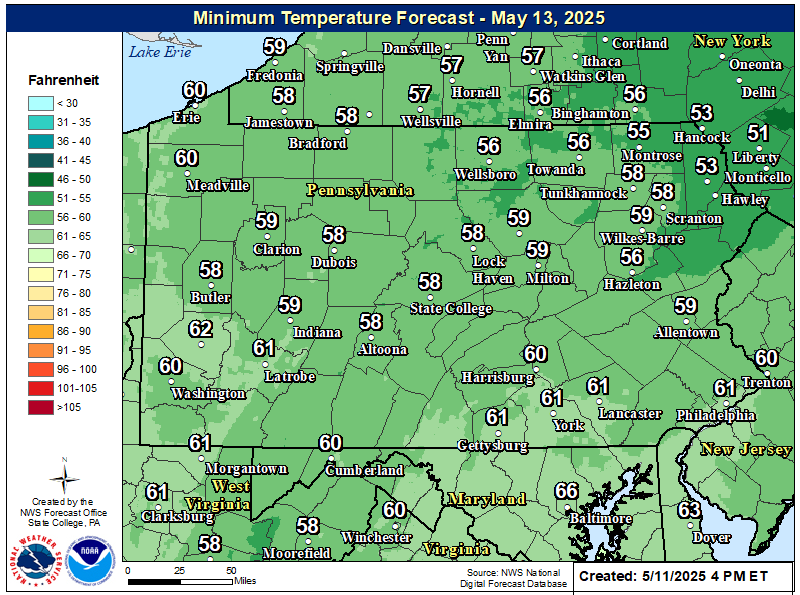
Today's Minimum TemperatureShows forecasted minimum temperature for the first day of the forecast. Map is updated every time the forecaster issues a new forecast. |
 |
Tomorrow's Maximum TemperatureMap displays the maximum temperature for day two. Map gets updated every time the NWS in Burlington produces a new grid. Map is updated every time the forecaster issues a new forecast. |
|
Tomorrow's Minimum TemperatureShows forecasted minimum temperature for the second day of the forecast. Map is updated every time the forecaster issues a new forecast. |
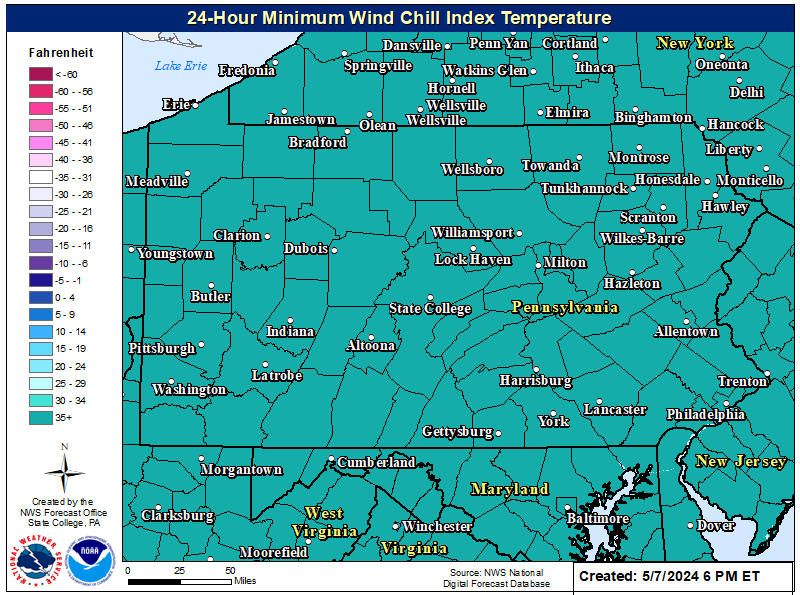 |
24 Hour Minimum WindchillMaps displays the lowest windchill in the next 24 hours. Map is updated every time the forecaster issues a new forecast. |
|
24 Hour Maximum Wind GustMap display the highest wind gusts expected in the next 24 hours Map is updated every time the forecaster issues a new forecast. |
State College Radar |
Pittsburgh Radar |
Ohio Valley |
Northeast |
|
|
National Snow AnalysesIncludes data on snow water equivalent, snow depth and more. The data can be view for a day or animated for a two week period or a season. |
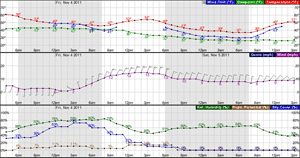 |
Hourly Weather GraphShows hourly information for locations across Pennsylvania. |
|
Overview of Storm Total Forecasts
|
|||
|---|---|---|---|
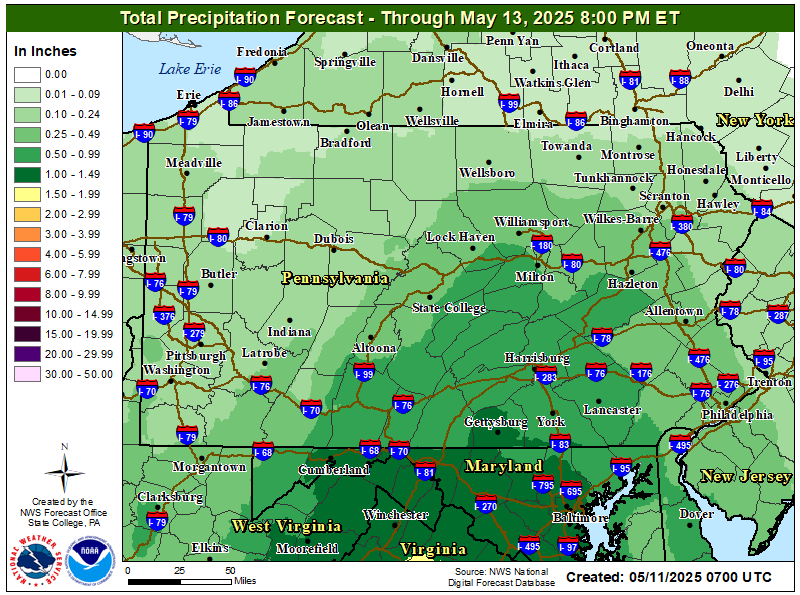 |
Storm Total QPF ForecastMap shows the expected storm total precipitation.
|
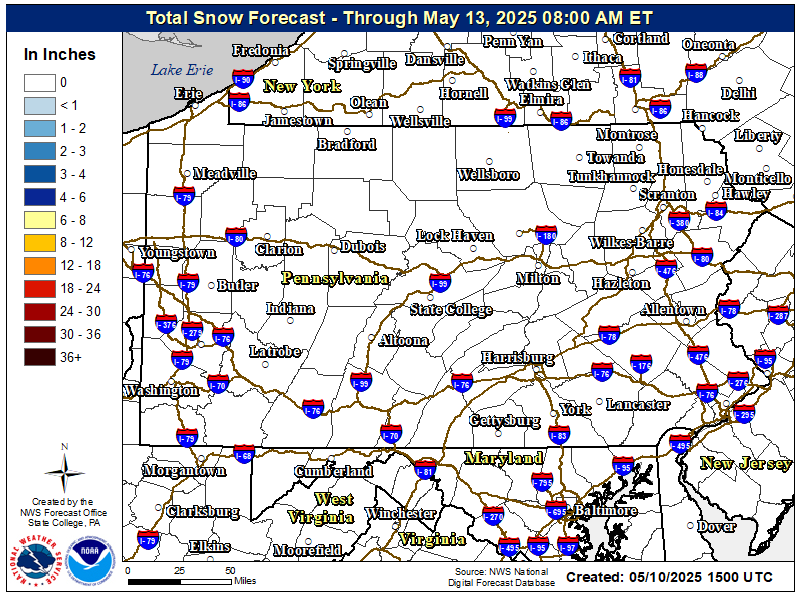 |
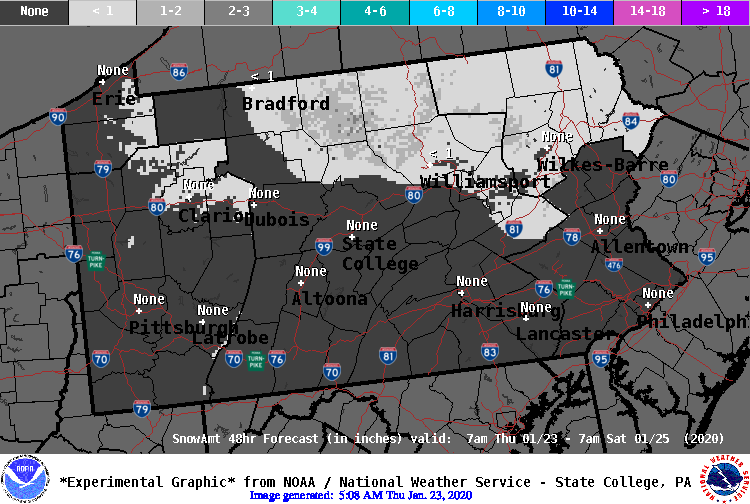
Storm Total Snow ForecastMap shows the expected storm total snowfall.
|
|
Storm Total IceAccum ForecastMaps shows the expected storm total ice accumulation.
|
|
|
|
|
|||
|
QPF Forecasts
|
|||
|---|---|---|---|
 |
12 Hour QPF Forecast
|
|
Storm Total QPF ForecastMap shows the expected storm total precipitation.
|
 |
12 Hour QPF Forecast
|
 |
24 Hour QPF Forecast |
 |
12 Hour QPF Forecast
|
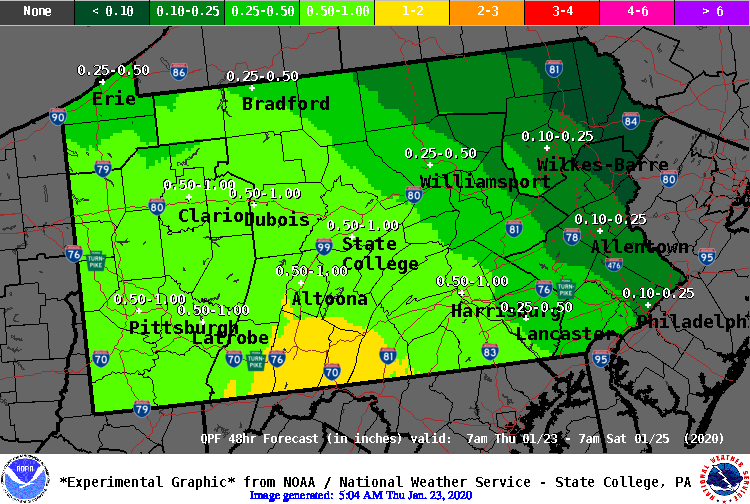 |
48 Hour QPF Forecast |
 |
12 Hour QPF Forecast
|
||
 |
12 Hour QPF Forecast
|
|
|
 |
12 Hour QPF Forecast
|
|
|
|
Snow Amount Forecasts
|
|||
|---|---|---|---|
 |
12 Hour Snow Forecast
|
|
Storm Total Snow ForecastMap shows the expected storm total snowfall. |
 |
12 Hour Snow Forecast
|
 |
24 Hour Snow Forecast |
 |
12 Hour Snow Forecast
|
|
48 Hour Snow Forecast |
 |
12 Hour Snow Forecast
|
||
 |
12 Hour Snow Forecast
|
|
|
 |
12 Hour Snow Forecast
|
||
|
Ice Accumulation Forecasts
|
|||
|---|---|---|---|
 |
12 Hour IceAccum Forecast
|
|
Storm Total IceAccum ForecastMap shows the expected storm total ice accumulation. |
 |
12 Hour IceAccum Forecast
|
 |
24 Hour IceAccum Forecast |
 |
12 Hour IceAccum Forecast
|
 |
48 Hour IceAccum Forecast |
 |
12 Hour IceAccum Forecast
|
||
 |
12 Hour IceAccum Forecast
|
|
|


 Day 1
Day 1


 Tropical Cyclone Names
 Send Us a Report