| Climate/Almanac Data - JUN Normals - JUN Records |
| |
| JUNE |
| *(Values Now Compared With New Climate Normals (1991-2020))* |
|
Site (Click site name for report)
|
Average
Temperature |
Normal |
Departure
From
Normal |
Precipitation
Total |
Normal |
Departure
From
Normal |
| Burlington |
73.5° |
72.5° |
+1.0° |
2.67" |
4.87" |
-2.20" |
| Cedar Rapids |
71.0° |
69.9° |
+1.1° |
5.27" |
5.56" |
-0.29" |
| Davenport |
72.8° |
71.1° |
+1.7° |
4.92" |
4.73" |
+0.19" |
| Dubuque |
70.2° |
68.5° |
+1.7° |
2.94" |
5.19" |
-2.25" |
| Iowa City |
73.8° |
72.4° |
+1.4° |
4.18" |
5.29" |
-1.11" |
| Moline |
73.7° |
72.1° |
+1.6° |
4.36" |
5.01" |
-0.65" |
|
| The ranking is listed in parentheses (__) when within the "Top 10". |
| |
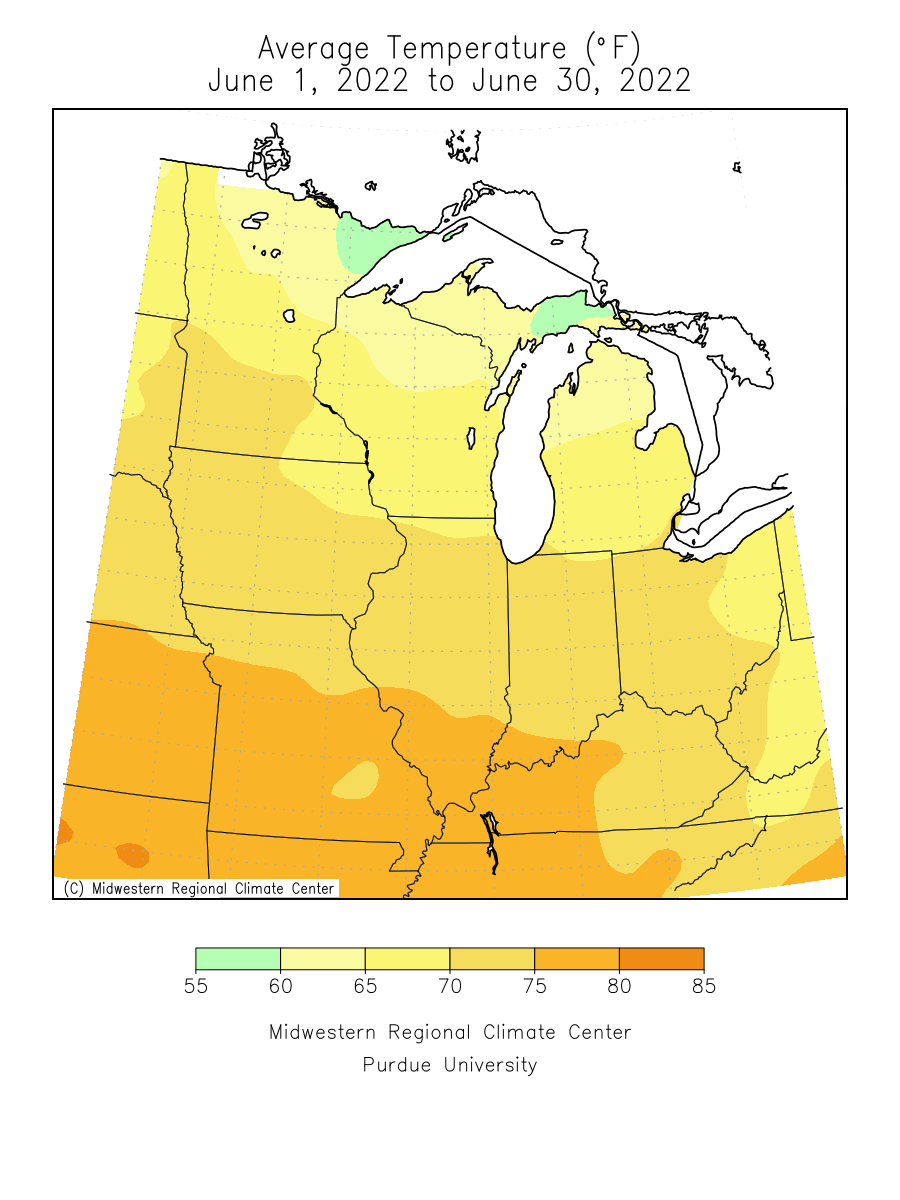
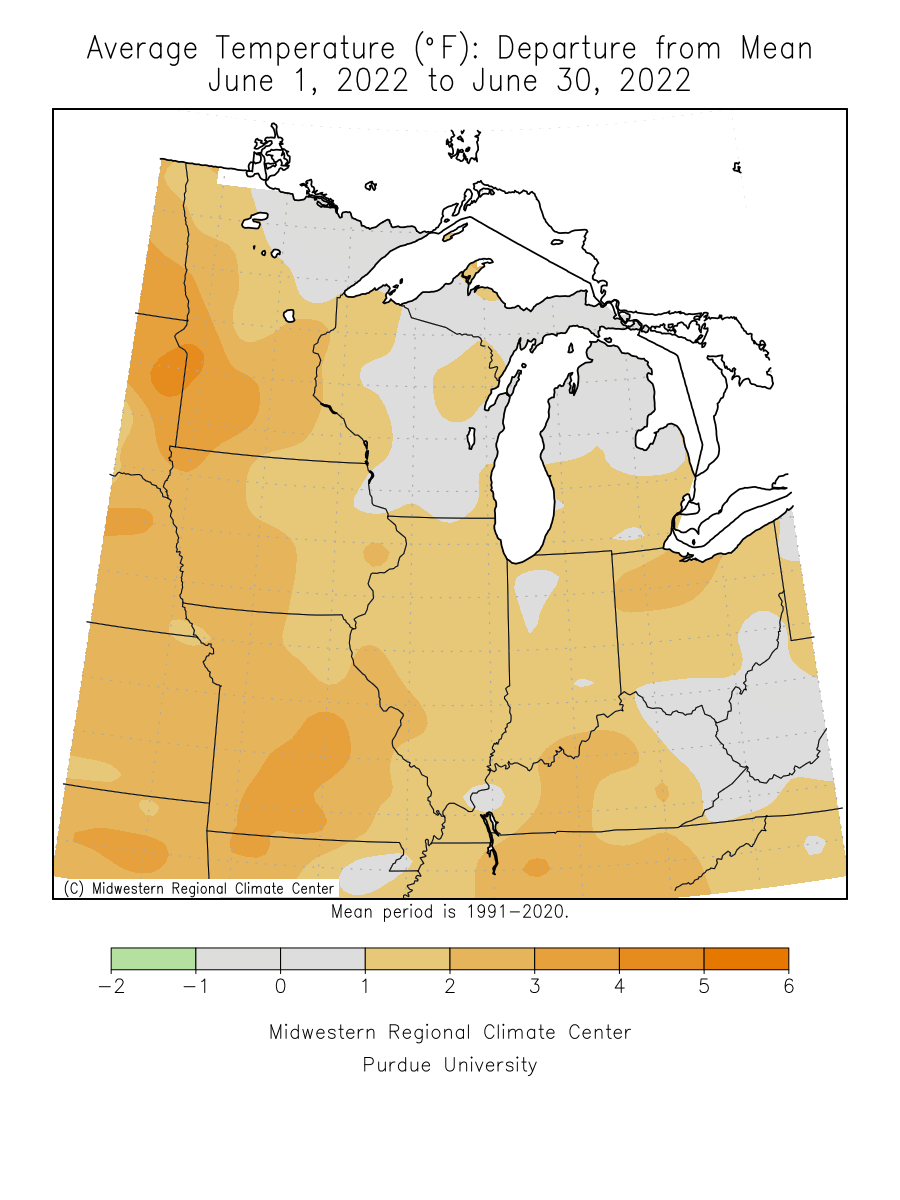
| June 2022 was around 1 to 2 degrees above normal. |
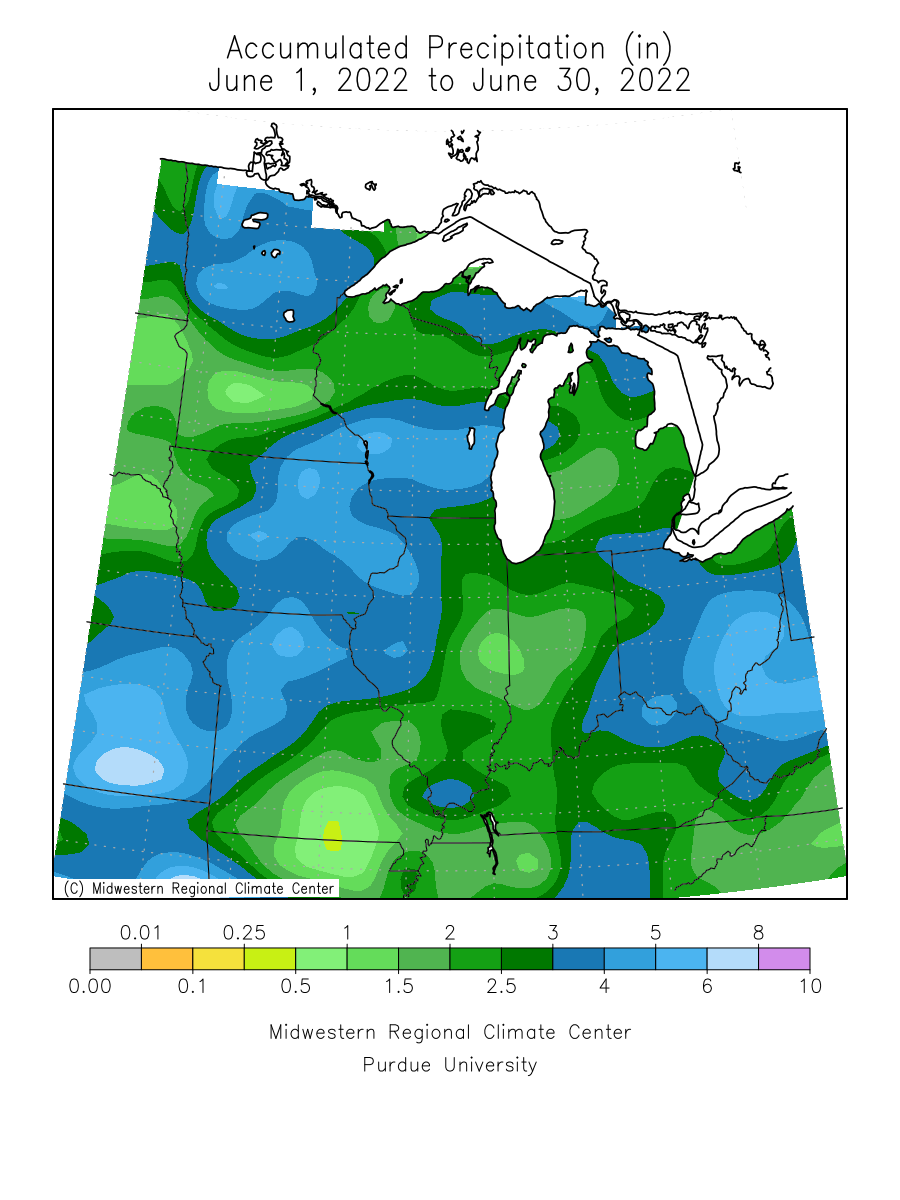
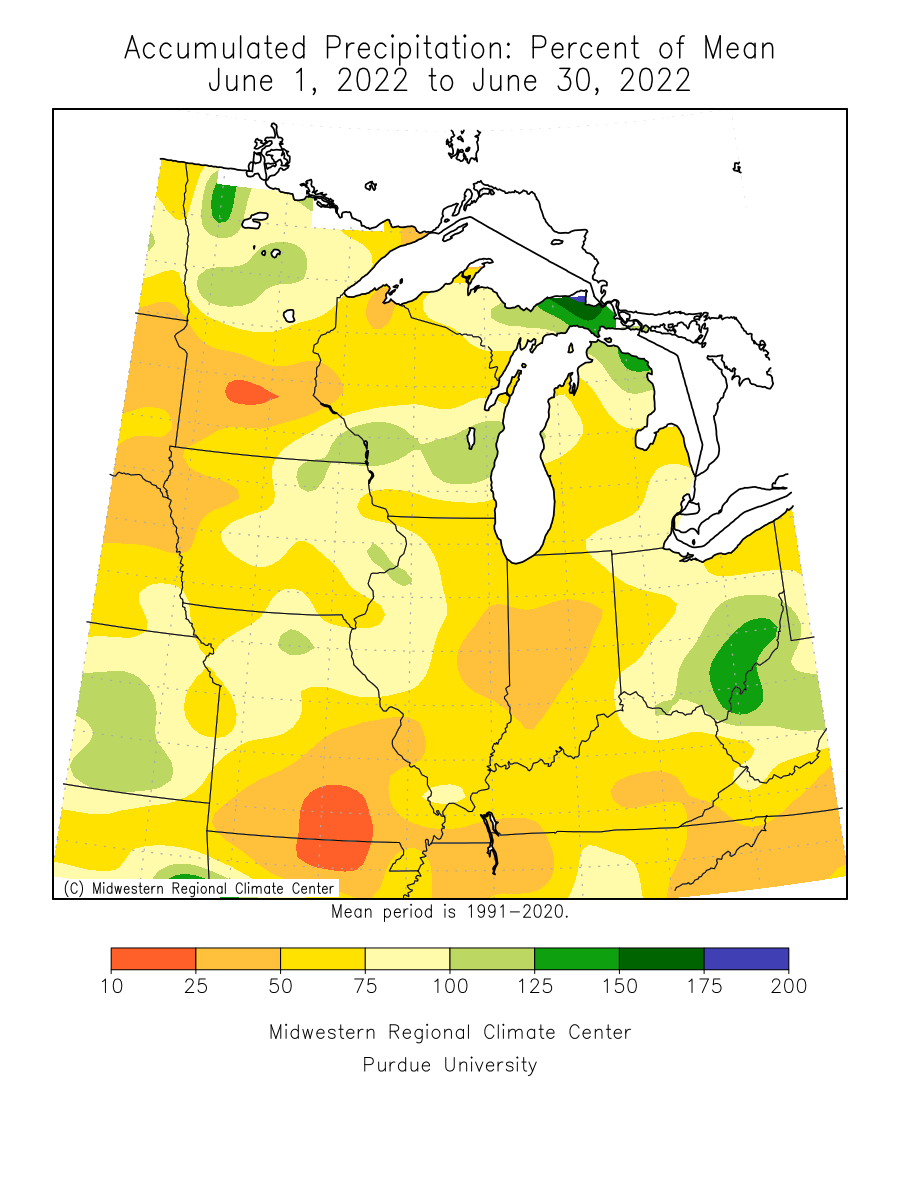
| Precipitation totals for June 2022 ranged from near normal to around two and a quarter inches below normal. |
| Please see JUN Records for monthly record information. |
| |
| |
| The climate maps below are courtesy of the Midwest Regional Climate Center. |
| These maps become available around 10am on the first of the month. |
| |
|
|
|
Average
Temperature |
Average
Temperature
Departure from Mean |
Accumulated
Precipitation |
Accumulated
Precipitation
Percent of Mean |
 |
 |
 |
 |
|
| |
| A LOOK AHEAD |
| |
| Climate Prediction Center |
| |
July
Temperature Outlook |
July
Precipitation Outlook |
July - September
Temperature Outlook |
July - September
Precipitation Outlook |
 |
 |
 |
 |
|
| |
| |
| |
| |


 Follow us on YouTube