Hurricane Wilma in the Florida Keys
KENNARD "CHIP" KASPER
National Oceanic and Atmospheric Administration (NOAA)/National Weather Service (NWS) Weather Forecast Office (WFO) Key West, Florida
1 March 2007
1. Introduction
Hurricane Wilma was the 25th tropical cyclone and 12th hurricane of the hyperactive 2005 season, and the fifth tropical cyclone in as many months to have a significant impact on the Florida Keys. Hurricane Wilma moved across the extreme southeastern Gulf of Mexico and southern Florida peninsula during the morning hours of Monday, 24 October 2005, bringing hurricane-force winds to the Florida Keys and the highest storm surge observed in the Keys since Hurricane Betsy, on 8 September 1965. Figure 1 shows inundation of North Roosevelt Boulevard in Key West near the time of peak storm tides. The core of category-three Hurricane Wilma passed just north of the Florida Keys (Fig. 2), sparing the Keys island chain from the highest winds and heaviest rain. However, the ocean surrounding the Keys archipelago rose rapidly on the morning of the 24th, inundating many island communities, and causing millions of dollars in property damage.
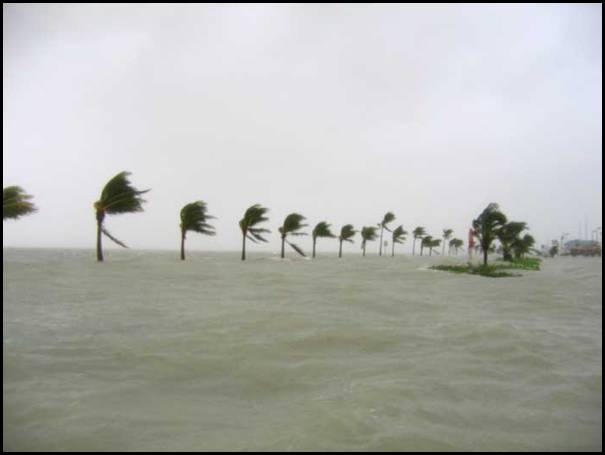
Fig. 1. North Roosevelt Boulevard, Key West, FL, inundated by a storm tide of near 6 feet (ft) above mean sea level, at approximately 0900 Eastern Daylight Time (EDT), 24 October 2005. The boulevard runs east to west, parallel to the line of coconut palm trees, on the north side of Key West (photograph by Mike Hentz of The Key West Citizen).
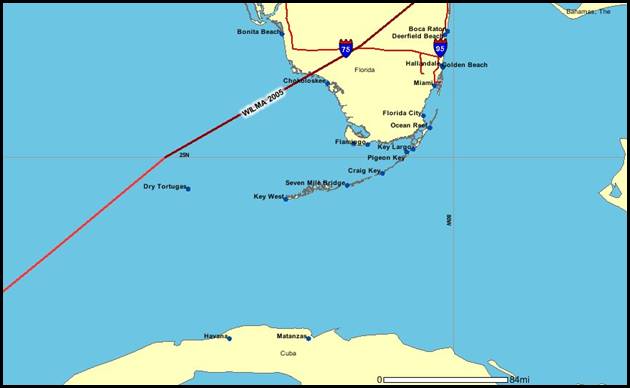
Fig. 2. Hurricane Wilma's track across the southeastern Gulf of Mexico and south Florida. The lighter red track indicates Saffir/Simpson category two intensity (maximum sustained winds 83-95 knots), and the darker red track indicates Saffir/Simpson category three intensity (maximum sustained winds 96-113 knots). Hurricane Wilma made landfall near Cape Romano, Florida as a Saffir/Simpson category three hurricane, with maximum sustained winds in the hurricane core near 105 knots (Image courtesy of the NOAA Coastal Services Center).
2. Storm History
Hurricane Wilma grew from a rather nondescript area of surface low pressure that was first evident near Jamaica on 14 October. The area of low pressure became sufficiently organized to be classified as a tropical depression by 1400 EDT, 15 October. Slow strengthening ensued over the next day and a half, and the depression was upgraded to Tropical Storm Wilma at 0200 EDT, 17 October. Further strengthening occurred, and the storm was upgraded to a hurricane at 0800 EDT, 18 October. After several days of slow, meandering motion over the western Caribbean Sea southwest of Jamaica, the system began moving northwestward.
Explosive intensification took place late on 18 October, with Wilma transforming from a 60-knot tropical storm to a 150-knot category five hurricane in less than 24 hours. A minimum central pressure of 882 millibars (26.04 inches of mercury) was measured by reconnaissance aircraft at 0800 EDT, 19 October over the northwestern Caribbean Sea. This surface pressure is the lowest ever observed in the Atlantic Basin, breaking the previous record set by Hurricane Gilbert (888 millibars or 26.22 inches of mercury) in 1988.
Hurricane Wilma moved northwestward over the next few days, weakening slightly before making landfall as a category four hurricane around 1700 EDT, 21 October at Cozumel, Mexico. The storm slowed down and spent over a day moving across the extreme northeastern portion of the Yucatan peninsula, producing torrential rains and extensive damage. Finally, a weakened (category one) Hurricane Wilma emerged off the north coast of the Yucatan peninsula around 2000 EDT, 22 October. Wilma then turned northeast, accelerated, and intensified as it moved across the southeastern Gulf of Mexico toward the southern Florida peninsula. Figure 3 is a radar image of Hurricane Wilma at 0219 EDT, 24 October from the Key West (KBYX) Weather Surveillance Radar 1988-Doppler (WSR-88D). Note the large eye (approximately 50-60 nautical miles in diameter). Hurricane Wilma made landfall as a category three hurricane near Cape Romano in Collier County on the southwestern coast of the Florida peninsula at 0630 EDT, 24 October. Figure 4 shows the complete track of Hurricane Wilma.
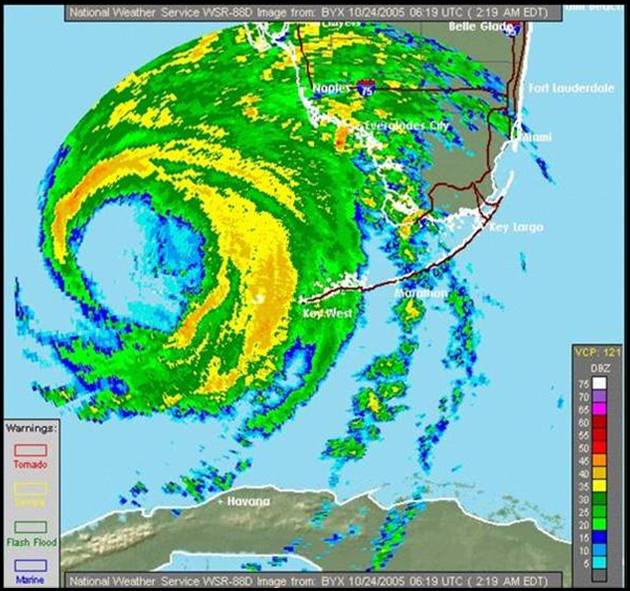
Fig. 3. KBYX WSR-88D composite reflectivity image of Hurricane Wilma at 0219 EDT, 24 October 2007.
Fig. 4. Best track positions for Hurricane Wilma, 15-26 October 2005 (Pasch et al. 2006)
3. Evacuations, Local Preparedness Actions
A local state of emergency was declared by Monroe County Emergency Management officials at 0800 EDT, Wednesday, 19 October, followed by a mandatory evacuation order for all Florida Keys visitors and non-residents at 1200 EDT, due to the threat posed by Hurricane Wilma. During the next couple of days, Monroe County Emergency Management officials encouraged all Florida Keys residents to evacuate the island chain voluntarily. At 1100 EDT, Saturday, 22 October, a Hurricane Watch was issued for all of the Florida Keys and adjacent waters, including the Dry Tortugas, and a mandatory, phased evacuation of residents commenced at 1200 EDT. The Hurricane Watch was upgraded to a Hurricane Warning at 2300 EDT, 22 October.
4. Meteorological Observations
The weather across the Florida Keys and adjoining waters during the daylight hours on Sunday, 23 October was characterized by increasing high cloudiness and scattered showers. Fresh to strong southeast breezes of 20-30 knots (kt) prevailed over the lower Florida Keys and adjacent waters, whereas moderate to fresh breezes of 10-20 kt prevailed over the middle and upper Florida Keys and adjacent waters. By 1100 EDT, Hurricane Wilma was centered north of the Yucatan Channel, and was moving northeastward at 7 kt. Maximum sustained winds were 85 kt with gusts to 105 kt. Figure 5 is a satellite image of Hurricane Wilma taken at 1215 EDT by the Moderate Resolution Imaging Spectroradiometer (MODIS) instrument aboard the Terra satellite. An outer spiral rainband can be seen approaching the lower Florida Keys from the southwest. A long-lived mesocyclonic waterspout developed a few hours later from a convective cell associated with this rainband, and moved within a few miles west of Key West around 1600 EDT.
Winds began to exceed tropical storm force (34 kt) in squalls over portions of the lower Florida Keys shortly after 1600 EDT, 23 October. Sustained tropical storm-force winds developed from west to east over the entire Keys archipelago and surrounding waters between 1900 EDT, 23 October and 0100 EDT, 24 October. Hurricane-force winds then developed from west to east across the Keys island chain between 0100-0600 EDT, 24 October, and ended, again from west to east across the island chain, between 0700-1200 EDT.
a. Wind
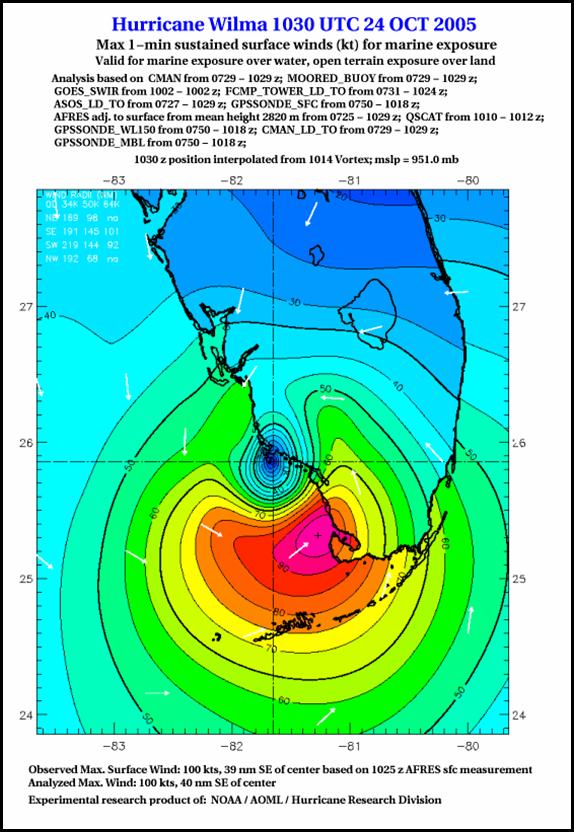
Peak recorded wind speeds across the Florida Keys during Hurricane Wilma varied according to instrument location, exposure, height, and averaging period (see Table 1). In addition, several instrument systems failed before or during the period of highest winds. Figure 6 is a wind analysis graphic from the NOAA/Atlantic Oceanographic and Meteorological Laboratory (AOML) Hurricane Research Division (HRD), valid at 1030 UTC (0630 EDT), 24 October. This analysis shows sustained (one-minute average), 10-meter wind speeds of 60-80 kt across the Florida Keys near the time of landfall (on the southwest Florida coast) and closest approach of the hurricane core to most of the Keys. The HRD analysis was produced by compositing all available observations relative to the storm center, including Air Force and NOAA aircraft, ships, buoys, Coastal-Marine Automated Network (C-MAN) platforms, and surface airways. (Powell et al., 1998). All data were quality controlled and then processed to conform to a common framework for height, exposure, and averaging period. Therefore, the HRD hurricane wind analysis is an excellent product for attaining a realistic, comprehensive view of the surface wind field across the Florida Keys during Hurricane Wilma.
b. Atmospheric Pressure
Minimum mean sea level (MSL) pressure reports were unavailable from the Automated Surface Observing System (ASOS) platforms at Key West International Airport (KEYW), Boca Chica Naval Air Station (KNQX), and Florida Keys Marathon Airport (KMTH), due to storm surge flooding-induced communications failures. Fortunately, however, the National Ocean Service (NOS) tide gages at Key West Harbor and Vaca Key remained operational throughout the storm, and provided minimum sea level pressure readings of 977.2 millibars (28.86 inches of mercury; 0418 EDT) and 983.0 millbars (29.03 inches of mercury; 0524 EDT), respectively, on 24 October. In addition, minimum MSL pressure readings of 983.4 millibars (29.04 inches of mercury; 0600 EDT), 982.2 millibars (29.00 inches of mercury; 0700 EDT), and 982.3 millibars (29.01 inches of mercury; 0800 EDT) were recorded at the C-MAN platforms at Sombrero Key, Long Key, and Molasses Reef, respectively.
c. Rainfall
Storm total rainfall was quite low for a tropical cyclone across the Florida Keys, averaging only 1-2 inches. The low rainfall amounts can primarily be attributed to the rapid acceleration of Hurricane Wilma as it approached Florida. Much larger storm total rainfall amounts were observed over central Florida (see Fig. 7) where rich tropical moisture from Wilma interacted with a frontal system.
.
Fig. 5. Satellite image of Hurricane Wilma at 1215 EDT, 23 October 2005. Approximate area of tropical storm-force winds (one-minute average, 10-meter wind speeds greater than or equal to 34 kt) shaded in red; outer spiral rainband denoted by bold yellow line east of storm center. Image courtesy of MODIS Rapid Response Project at NASA/GSFC.
TABLE 1. Surface wind observations in the Florida Keys, 24 October 2005.
|
Location
|
Source
|
Peak Wind (kt)
|
Date/Time (EDT)
|
Peak Gust (kt)
|
Date/Time (EDT)
|
|
Garden Key, Dry Tortugas
|
National Park Service a
|
|
|
116
|
24/0115
|
|
Key West Harbor
|
NOS Tide Gage b
|
51 c
|
24/0436
|
74
|
24/0436
|
|
Key West International Airport
|
NWS ASOS d
|
62 e
|
24/0216 f
|
72 g
|
24/0216
|
|
Cudjoe Key
|
Bela Zeky h
|
|
|
107
|
24/0513
|
|
Sombrero Key
|
NWS C-MAN platform i
|
76 j
|
24/0540
|
91 g
|
24/0522
|
|
Duck Key
|
William A. Wagner, Jr. k
|
|
|
75
|
Unknown
|
|
Long Key
|
NWS C-MAN platform l
|
57 j
|
24/0650
|
76 g
|
24/0527
|
|
Upper Matecumbe Key
|
Islamorada Fire Rescue Station m
|
|
|
94
|
24/0526
|
|
Molasses Reef
|
NWS C-MAN platform n
|
66 j
|
24/0820
|
81 g
|
24/0834
|
a Anemometer height 75 ft above MSL, located at Fort Jefferson National Monument
b Anemometer height 21 ft above MSL
c 6-min average
d Anemometer height 44 ft above ground level (AGL)
e 2-min average
f Communication line to ASOS failed before maximum winds
g 5-s average
hAnemometer (Davis Vantage Pro 2) height 25 ft AGL
i Anemometer height 159 ft above MSL
j 10-min average
kAnemometer height 30 ft AGL
l Anemometer height 23 ft above MSL
mAnemometer (R.M. Young Model 05103 Wind Monitor) height 50 ft AGL
n Anemometer height 52 ft above MSL
Fig. 6. Experimental surface wind analysis from NOAA/Hurricane Research Division, 0630 EDT, 24 October 2005.
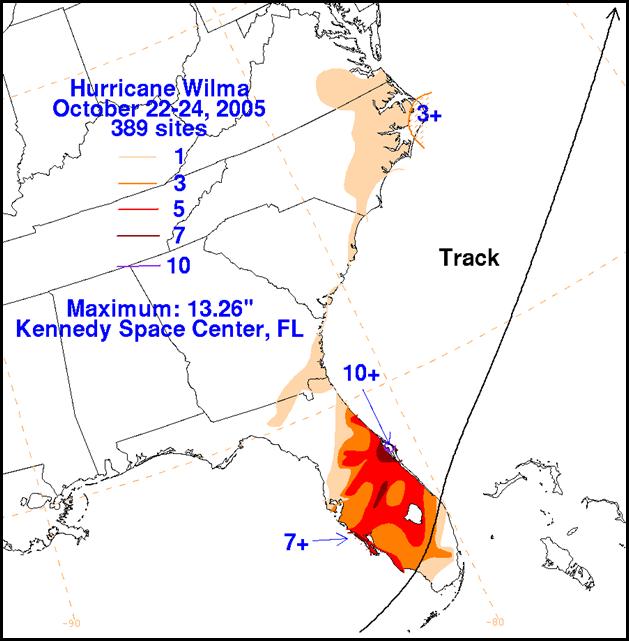
Fig. 7. Hurricane Wilma storm total rainfall map (22-24 October 2005), constructed using data provided by NWS River Forecast Centers and WFOs (Image courtesy of NOAA/NWS/Hydrometeorological Prediction Center).
5. Storm Surge
Real-time observations and post-storm high water mark surveys throughout the Florida Keys revealed two storm surge events associated with the passage of Hurricane Wilma (FEMA 2006). The first event occurred mainly along southern shores of the Keys as Hurricane Wilma approached the island chain from the southwest. The second event occurred with the onset of westerly winds as Hurricane Wilma made landfall along the southwestern coast of the Florida peninsula. The second event was more severe, and resulted in the worst storm surge inundation throughout most of the Florida Keys since Hurricane Betsy on 8 September 1965.
a. First storm surge event
Water levels along the southern and western shores of the lower Florida Keys first rose significantly above astronomically predicted values around 2000 EDT (Sunday evening), 23 October. Figure 8 is a water level plot from a tide gage located on the west side of Key West. Coastal flooding in Key West typically commences when water levels reach 3 ft above MSL. This threshold was met just after 0100 EDT according to Figure 8. Indeed, WFO Key West received its first report of coastal flooding at 0131 EDT (City of Key West officials reported flooding of South Roosevelt and Atlantic Boulevards on the south side of Key West). By 0230 EDT, Key West International Airport was flooded, with the runway complex inundated and the airport terminal flooded with six inches of salt water. At 0252 EDT, communications to the KEYW ASOS platform (located on the east end of the airport runway complex) were rendered inoperable due to storm surge flooding. At 0301 EDT, Flagler Avenue east of First Street was flooded with 1-2 ft of salt water. Parking lots on the southeast side of Key West were flooded with 2-3 ft of salt water. Some homes on the south side of Stock Island, as well as the intersection at U.S. Highway 1 and Cross Street, were flooded with up to 4 ft of water. At 0330 EDT, a report was received indicating that the NOAA Weather Radio transmitter on Sugarloaf Key had ceased operation (it was later discovered that the generator fuel tank floated away). At 0526 EDT, Sea Oats Beach at mile marker 74 was inundated. Canals throughout the lower Florida Keys began overflowing between 0500 and 0600 EDT.
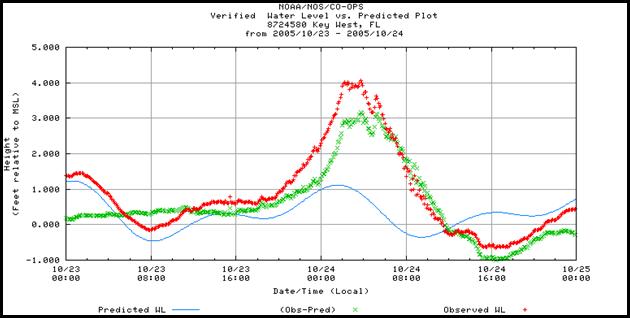
Fig. 8. Plot of predicted (blue), observed (red), and difference between observed and predicted (green) water level in feet relative to MSL from 0000 EDT, 23 October 2005 to 2400 EDT, 24 October 2005 at the NOAA/NOS tide gage, Key West Harbor.
For the first event, maximum storm tides of 5-6 ft above MSL were estimated in Key West, 4-5 ft above MSL throughout the rest of the lower Florida Keys, 3 ft above MSL in Marathon and the middle Florida Keys (numerous streets flooded, but water did not reach U.S. Highway 1), and 2-3 ft above MSL in the upper Florida Keys.
This first storm surge event was enhanced by strong southerly winds producing wave setup in Hawk Channel and wave run-up along the southern shores of the Keys.
b. Second storm surge event
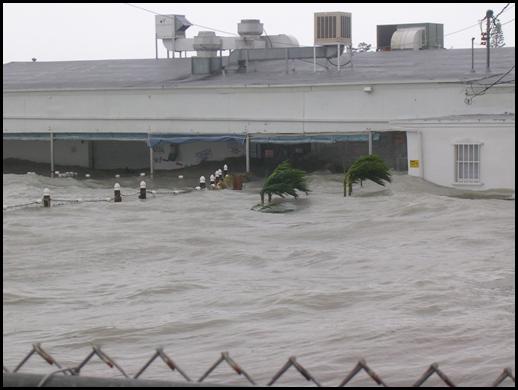
Observations from NWS forecasters and spotters, City of Key West and Monroe County officials, and the public indicated that the second storm surge event began in northern sections of Key West around 0700 EDT, 24 October. However, an analysis of data from the Key West Harbor tide gage (Fig. 8) reveals that peak storm tides occurred around 0400 EDT, with a gradual drop in water levels thereafter. In addition, residents on Waddell Street near South Beach reported peak storm tides early in the morning (prior to sunrise), with falling tides thereafter. These observations suggest that the higher elevation areas on the western side of Key West (elevations above 8 ft MSL throughout much of Old Town; see Fig. 9) blocked southward-moving sea water from reaching areas to their immediate west and south. Peak storm tides, up to 6.5 ft above MSL in parts of Key West, occurred around 0900 EDT. Inundation originated along the Old Town Key West waterfront, Garrison Bight, and North Roosevelt Boulevard (see Fig. 1). Flooding crossed the island from north to south, meeting Hawk Channel (Atlantic side) at the west end of South Roosevelt Boulevard. Figure 10 shows storm surge flooding in southern portions of Key West just after its peak. City of Key West officials estimated that about 60 percent of Key West was inundated, and up to 35 percent of municipal vehicles were flooded.
Fig. 9. Storm surge flood potential map of Key West, FL. Areas shaded in orange, red, yellow, blue, green, and purple are likely to flood with storm surges of 3, 4, 5, 6, 7, and 8 ft, respectively. During Hurricane Wilma, storm tides peaked at 4.5-6.5 ft above MSL throughout Key West. Predicted astronomical tides at Key West Harbor during Hurricane Wilma ranged from 1.1 ft above MSL (0234 EDT, 24 October) to 0.4 ft below MSL (1027 EDT, 24 October), and peak storm surge values across Key West ranged from 4.0-6.0 ft above MSL, resulting in the inundation of more than 50 percent of the island. The NOS tide gage, Waddell Street, NWS WFO, and Duck Avenue are indicated by black arrows and referenced in the text (map courtesy of the City of Key West Department of Engineering Services).
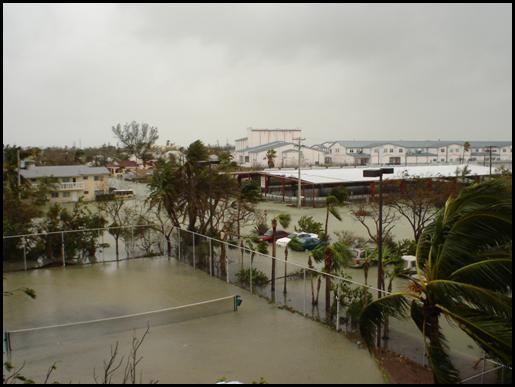
Fig. 10. Storm surge flooding around 1030 EDT, 24 October, Bertha Street and Atlantic Boulevard intersection, Key West, FL (photograph by Chip Kasper).
The author finished his operational shift at WFO Key West around 0800 EDT, 24 October, and subsequently observed the second storm surge event at its peak in portions of Mid Town Key West, between United Street and Atlantic Boulevard, and between White Street and First/Bertha Streets. The WFO Key West is located on a compound bordered by United Street on the north, White Street on the west, and Seminary Street on the south. The main building is within 50 ft of White Street, at an elevation of 7 ft above MSL (the operational floor of the building is raised to an elevation of approximately 15 ft above MSL). By 0900 EDT, sea water had moved inland to a point on United Street at 6 ft above MSL, less than 15 ft from the northeastern boundary of the WFO Key West compound. At this time, most of Key West east of White Street was inundated (greater than 50 percent of the island surface area). Waters rose very quickly, 2-3 ft in less than 15 minutes. Island terrain significantly modulated water levels and currents over the island. Floating debris, tree branches, and household goods were ubiquitous, and accumulations of debris and other flotsam caused constrictions in the current resulting in very turbulent flow locally, some of which was reminiscent of river rapids (see Fig. 11). In shallower depths, fish and other marine wildlife were visible swimming beneath the water surface, and numerous island residents reported dead fish and eels for days after the flood waters receded.
Major flooding occurred on Stock Island where sea water up to 3 ft deep was reported in the residential streets of the Key West Golf and Country Club. Maximum storm tides of 5-8 ft above MSL were estimated throughout most of the lower Florida Keys, between Boca Chica Key and Big Pine Key. Numerous homes were flooded, and thousands of vehicles were total losses. U.S. Highway 1 flooded in the Saddlebunch Keys.
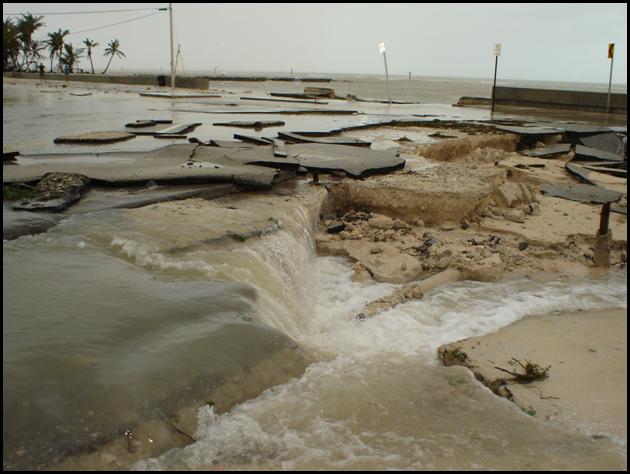
Fig. 11. Photograph of South Roosevelt Boulevard-Bertha Street intersection in Key West, FL around 1100 EDT, 24 October 2005. Note water flowing toward Hawk Channel (Atlantic Ocean) through large slabs of asphalt (photograph by Chip Kasper).
Maximum storm tides of 5-8 ft above MSL were estimated between 1100-1300 EDT in Marathon and throughout the middle Florida Keys. Figure 12 shows a water level plot recorded by the NOS tide gage at Vaca Key (in the city of Marathon) during 23-24 October. U.S. Highway 1 was flooded at several locations. In addition, numerous homes, businesses, and Florida Keys Marathon Airport were flooded (see Figure 13 for a picture of storm surge inundation in Marathon).
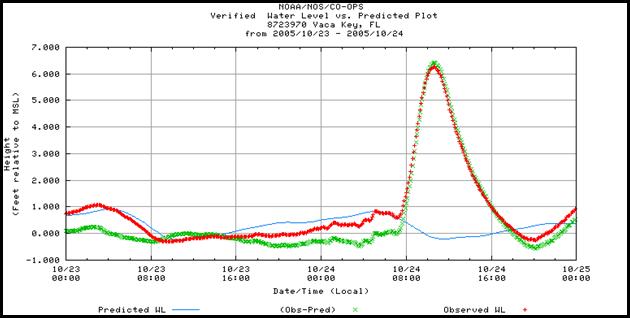
Fig. 12. Plot of predicted (blue), observed (red), and difference between observed and predicted (green) water level in feet relative to MSL from 0000 EDT, 23 October 2005 to 2400 EDT, 24 October 2005 at the NOAA/NOS tide gage, Vaca Key, FL.
Maximum storm tides of 5 ft above MSL were estimated around 1500 EDT in Islamorada with most homes along Florida Bay flooded. In the upper Florida Keys, maximum storm tides of 4.5 ft above MSL were estimated at U.S. Highway 1 near Jewfish Creek, and at mile marker 110 where the road was flooded with several inches of water.
Fig. 13. Storm surge flooding around 1100 EDT, 24 October, Keys Fisheries on Gulf View Avenue in Marathon, FL (photograph by Carmen Watmuff; image courtesy of Keynoter Publishing Company, Inc.).
6. Tornadoes
Hurricane Wilma produced 10 tornadoes over the Florida peninsula on 23-24 October, but there were no confirmed tornadoes in the Florida Keys. However, a long-lived, mesocyclonic waterspout associated with a supercell thunderstorm was visible from Key West by NWS forecasters and other residents during the afternoon of 23 October (Fig. 14). This violent waterspout moved within three miles of the west end of Key West at closest approach, around 1600 EDT. Waterspout movement was estimated by Doppler radar to be near 40 kt toward the north-northwest. The parent convective cell of this vortex was associated with a large outer spiral rainband of Hurricane Wilma. This waterspout would have resulted in significant property damage, had the path tracked just a few miles farther east, over Key West or an adjacent island community in the lower Florida Keys.
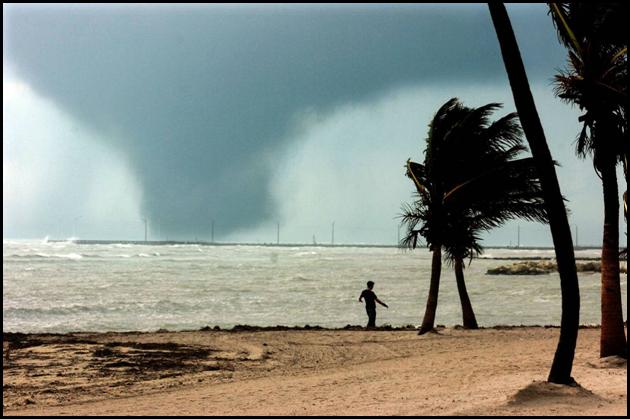
Fig. 14. Photograph of a violent waterspout, located over Hawk Channel about four miles southwest of Key West, FL at approximately 1600 EDT, 23 October 2005. The man standing is near a seaweed patch on Smathers Beach, seaward of the coconut palm trees. White Street Pier is visible in the background, in front of the waterspout (photograph by Tim Chapman).
7. Casualties and Damage
No fatalities directly related to storm conditions were reported. However, one fatality occurred during the evacuation of a special needs patient. No major injuries were reported to the NWS.
a. Wind damage
Scattered trees and numerous large branches were blown down throughout the Florida Keys. General damage was reported to shingles, lightweight material roofing, vinyl membrane roofing, and foam-board roof coverings. Isolated damage was reported to exterior wall coverings. An unknown number of mobile or prefabricated houses were damaged or destroyed. Naval Air Station Key West reported roof damage to an aircraft hanger and a technology building. A prefabricated office building housing a commuter airline collapsed at Key West International Airport, and metal siding was torn off the Air Traffic Control Tower. Widespread loss of cable-hung traffic signals was reported. Most commercial signs of various sizes were either knocked down or blown out. Extensive power outages occurred to distribution circuits and secondary lines, and complete power failure occurred throughout all of the lower Florida Keys, including Key West. However, power was restored quickly by utility crews (within 36 hours at most locations).
The vegetation in the Florida Keys looked scorched for several months after Hurricane Wilma owing to a combination of wind damage, salt damage, and the onset of a record-breaking dry season. In addition, during the next spring, most of the Royal Poinciana trees in the Keys failed to bloom. Usually, these trees begin flowering in April, peaking in late May and early June, rendering a spectacular display of orange-red flowers.
b. Storm surge damage
The primary damage throughout the Florida Keys from Hurricane Wilma was from storm surge flooding. Numerous vessels broke loose from moorings with losses in numerous marinas, including Boca Chica Marina. Several sailboats grounded on the shoulder of U.S. Highway 1 on Big Pine Key. Numerous ground-floor slab or block homes and businesses flooded throughout the Keys. Downstairs storage enclosures, sheds, and utility rooms of elevated stilted homes also flooded. Some complete home and business losses occurred. The propane tank for the NOAA Weather Radio transmitter generator fuel tank on Sugarloaf Key floated away (the supports were either blown off or collapsed in the storm surge). Several medium to large boats washed ashore along the Saddlebunch Keys. Thousands of vehicles were rendered permanently inoperable by the high storm tides. In addition, numerous house and vehicle fires occurred throughout the Florida Keys for several days after Hurricane Wilma, owing to electrical malfunctions. Clothes washing and drying machines and other appliances lined driveways and roadways throughout the Florida Keys for many weeks after the storm.
Significant damage occurred to the Florida Keys commercial fishing industry, particularly to the spiny lobster and stone crab trappers. The strong winds and rough seas destroyed or scattered hundreds of thousands of traps. Those traps that were recovered soon acquired abnormal accumulations of barnacles, apparently due to the mixing of fresh water from the Everglades with salt water from the Gulf of Mexico and Straits of Florida. Many of the remaining traps were thus locked shut by the barnacles, and extra labor was then required to access the catch, with the traps in many cases being subsequently destroyed.
The high winds, seas, and currents associated with Hurricane Wilma pushed most marine navigational buoys out of position. Subsequently, the Port of Key West was closed, and recreational boating remained hazardous for several days after Hurricane Wilma.
Key West International Airport and Florida Keys Marathon Airport were both closed for several days after Hurricane Wilma, with reduced operations lasting well into November 2005.
c. Beach erosion
Severe beach erosion occurred along the Atlantic shores of the Florida Keys, with severe erosion noted on Gulf side beaches in Key West as well. Most beaches were completely inundated near time of maximum storm tide. Breaking waves of six feet were estimated along the upper Florida Keys. South Roosevelt Boulevard in Key West was closed to traffic for nearly three weeks, while crews removed tons of sand and large pieces of seawall from the road (see Fig. 15).
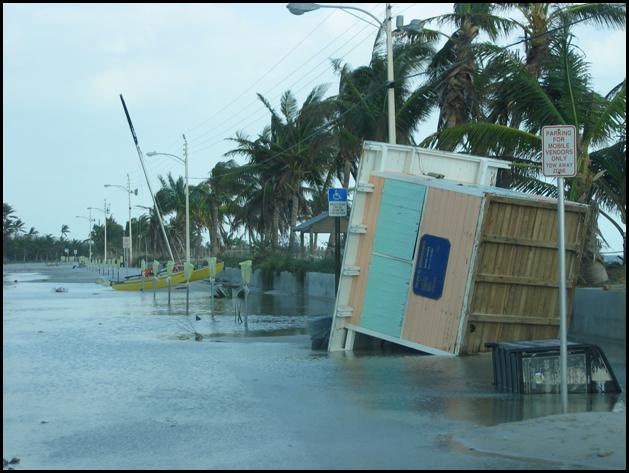
Fig. 15. Photograph of South Roosevelt Boulevard near Smathers Beach in Key West, FL during the late afternoon of 24 October 2005, looking toward the east (photograph by Jim Lee).
d. Economic impacts
Total insurance claim payments made totaled $208,810,412 for Hurricane Wilma in Monroe County, Florida (Florida Office of Insurance Regulation Hurricane Summary Data, 2006). In addition, Hurricane Wilma occurred just days before the height of Fantasy Fest, Key West's annual autumn street festival, attended by up to 100,000 people. The event was postponed until December. However, attendance was less than a third of the normal October attendance, and the local economy lost millions of dollars in hotel, restaurant, and retail revenues. The Florida Keys tourism economy suffered for several months after Hurricane Wilma. Finally, the commercial fishing industry also suffered huge economic losses.
Acknowledgements
Monroe County Emergency Management provided information regarding both wind and storm surge damage from Hurricane Wilma. The U.S. Coast Guard Sector Key West provided information regarding damage to marine navigational aids. Many thanks go to General Forecasters Jim Lee, Laura Kasper, and Senior Forecaster William South of WFO Key West for their reviews of the draft versions of this report. Their reviews improved the substance and the clarity of the final draft. In addition, helpful discussions with WFO Key West Science and Operations Officer Andrew Devanas and Warning Coordination Meteorologist Jonathan Rizzo improved the paper as well. Finally, WFO Key West Meteorologist-in-Charge Matt Strahan is acknowledged for his support and interest in this publication.
8. References
Federal Emergency Management Agency (FEMA), 2006: Final Coastal High Water Mark Collection for Hurricane Wilma in Florida. FEMA-1609-DR-FL, Task Order 460, URS Group, Inc., Gaithersburg , MD.
Pasch, R.J., E.S. Blake, H.D. Cobb III, and D.P. Roberts, 2006: Tropical Cyclone Report, Hurricane Wilma, 15-25 October 2006. NOAA/NWS/Tropical Prediction Center/National Hurricane Center, Miami, FL, http://www.nhc.noaa.gov/pdf/TCR-AL252005_Wilma.pdf.
Powell, M.D., S.H. Houston, L.R. Amat, N. Morisseau-Leroy, 1998: The HRD real-time hurricane wind analysis system. Wind Engineer. And Indust. Aerodyn. 77-78, 53-64.
______________________________________________________________________________
Corresponding author address: Kennard Chip Kasper, NOAA/National Weather Service, 1315 White Street, Key West, FL 33040

