
There is an Enhanced Risk (Level 3 of 5) for severe thunderstorms Tuesday with threats for significant severe hail and tornado potential over southern Iowa into northern Missouri and west-central Illinois. Elevated to critical fire weather is possible Tuesday due to gusty winds and dry conditions over parts of the southern High Plains and northeastern Montana. Read More >

.JPG)
Boat washed ashore in Coconut Grove by storm surge Wind damage in Orange Tree (Collier County)
(pictures courtesy NWS Miami Storm Survey Team)
NOTE: data in this report comes from a variety of sources, including the National Hurricane Center, NWS and private-sector weather-recording instruments, NWS storm surveys and subsequent post-analysis, media reports, and damage assessment information gathered by local emergency managers. For official, certified storm data, please refer to the StormData publication and/or contact National Centers for Environmental Information (NCEI).
Hurricane Irma formed from an African Easterly Wave, more commonly known as tropical waves. It became a tropical storm on August 30th about 420 miles west of the Cabo Verde Islands in the far eastern tropical Atlantic Ocean, and quickly attained hurricane status on August 31st while still in the far eastern Atlantic about 650 miles west of the Cabo Verde Islands. Irma continued to gradually strengthen over the next several days as it tracked generally westward across the tropical Atlantic. By the time Hurricane Irma struck Barbuda in the northern Leeward Islands around 2am on Wednesday, September 6th, it was a Category 5 hurricane with 185 mph winds. Five hours later, the eye of Irma moved over St. Martin, still with 185 mph winds, while the northern eyewall pounded Anguilla. That afternoon, Irma cut a path directly through the British Virgin Islands. After the southern eyewall raked St. Thomas, Puerto Rico was largely spared as the center passed about 45 miles north of San Juan. Hurricane conditions did occur on Puerto Rico’s northeastern coast. Still a Category 5, Irma impacted portions of the Turks and Caicos Islands and the southeast Bahamas. From Friday evening September 8th through Saturday afternoon September 9th, Irma moved along the northern coast of Cuba. Interaction with land caused Irma to weaken from a Category 5 to a Category 3 before it began to pull away from the northern coast of Cuba late Saturday afternoon.
On Sunday morning, September 10th, Irma strengthened to a Category 4 hurricane as it accelerated toward the Florida Keys. The eye made landfall in Cudjoe Key as a 130 mph Category 4 at 9:10am. The center of Irma then made landfall in Marco Island at 3:35pm that afternoon as a Category 3 with 115 mph winds. The center moved into central Florida overnight and into northern Florida later on Monday as it weakened.
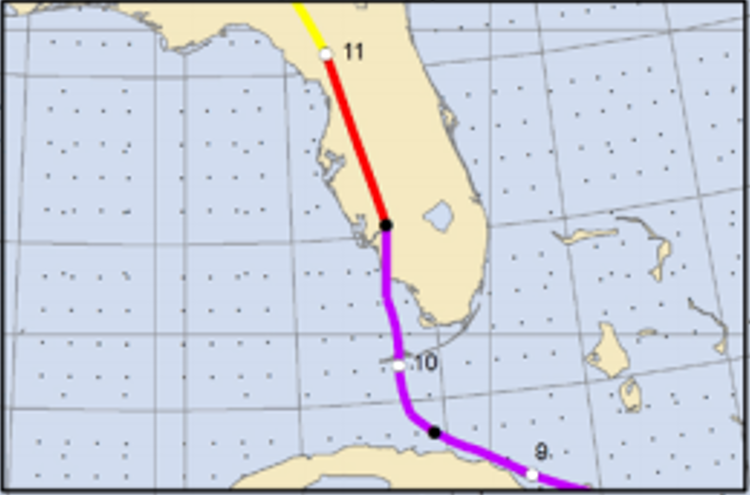
Hurricane Irma's track through Florida
The numbers correspond to the date where the eye was located at 8 AM EDT each day
The following watches and warnings were valid for all or parts of the following counties in southern Florida: Broward, Collier, Glades, Hendry, Mainland Monroe, Miami-Dade and Palm Beach. All times EDT.
| Issued | Expired | |
| Hurricane Watch | 11 AM Sept 7th | Upgraded to Warning at 11 PM Sept 7th |
| Storm Surge Watch | 11 AM Sept 7th | Upgraded to Warning at 11 PM Sept 7th |
| Hurricane Warning | 11 PM Sept 7th | Downgraded to TS Warning 11 PM Sept 10th |
| Storm Surge Warning (Broward & Palm Beach) | 11 PM Sept 7th | 11 PM Sept 10th |
| Storm Surge Warning (Miami-Dade) | 11 PM Sept 7th | 5 AM Sept 11th |
| Storm Surge Warning (Collier & Mainland Monroe) | 11 PM Sept 7th | 11 AM Sept 11th |
| Tropical Storm Warning | 11 PM Sept 10th | 5 AM Sept 11th |
| Flood Watch | 538 PM Sept 8th | 544 AM Sept 11th |
| Flash Flood Watch (Lake Okeechobee/Hoover Dike) | 1222 PM Sept 8th | 1119 AM Sept 11th |
| Tornado Watch | 1210 AM Sept 9th | 1150 AM Sept 10th |
South Floridians began paying very close attention to Irma’s forecast up to a week or more prior to landfall in South Florida. From about 5 days before landfall onward, the NHC forecast was consistent on a threat to South Florida. Residents and visitors swarmed grocery stores, gas stations and department stores to stock up on essential supplies. The good news was that most South Floridians took the threat from Irma seriously. The bad news was that grocery stores quickly ran out of food and water, while most gas stations had run out of fuel 1 to 2 days before Irma hit.
Many South Floridians joined those across the state in evacuating, becoming a large part of the estimated 6+ million people who were ordered to evacuate, plus those who decided to leave town despite not being in mandatory evacuation zones. Those who left early still encountered significant traffic jams upstate. Finding gas was challenging for many. Upon driving home after the storm, people realized that many roads had either heavy traffic or flooding, which lengthened travel time. Other South Floridians stayed for the hurricane. Some left the barrier islands to ride out the storm with relatives or friends in a non-evacuation zone.
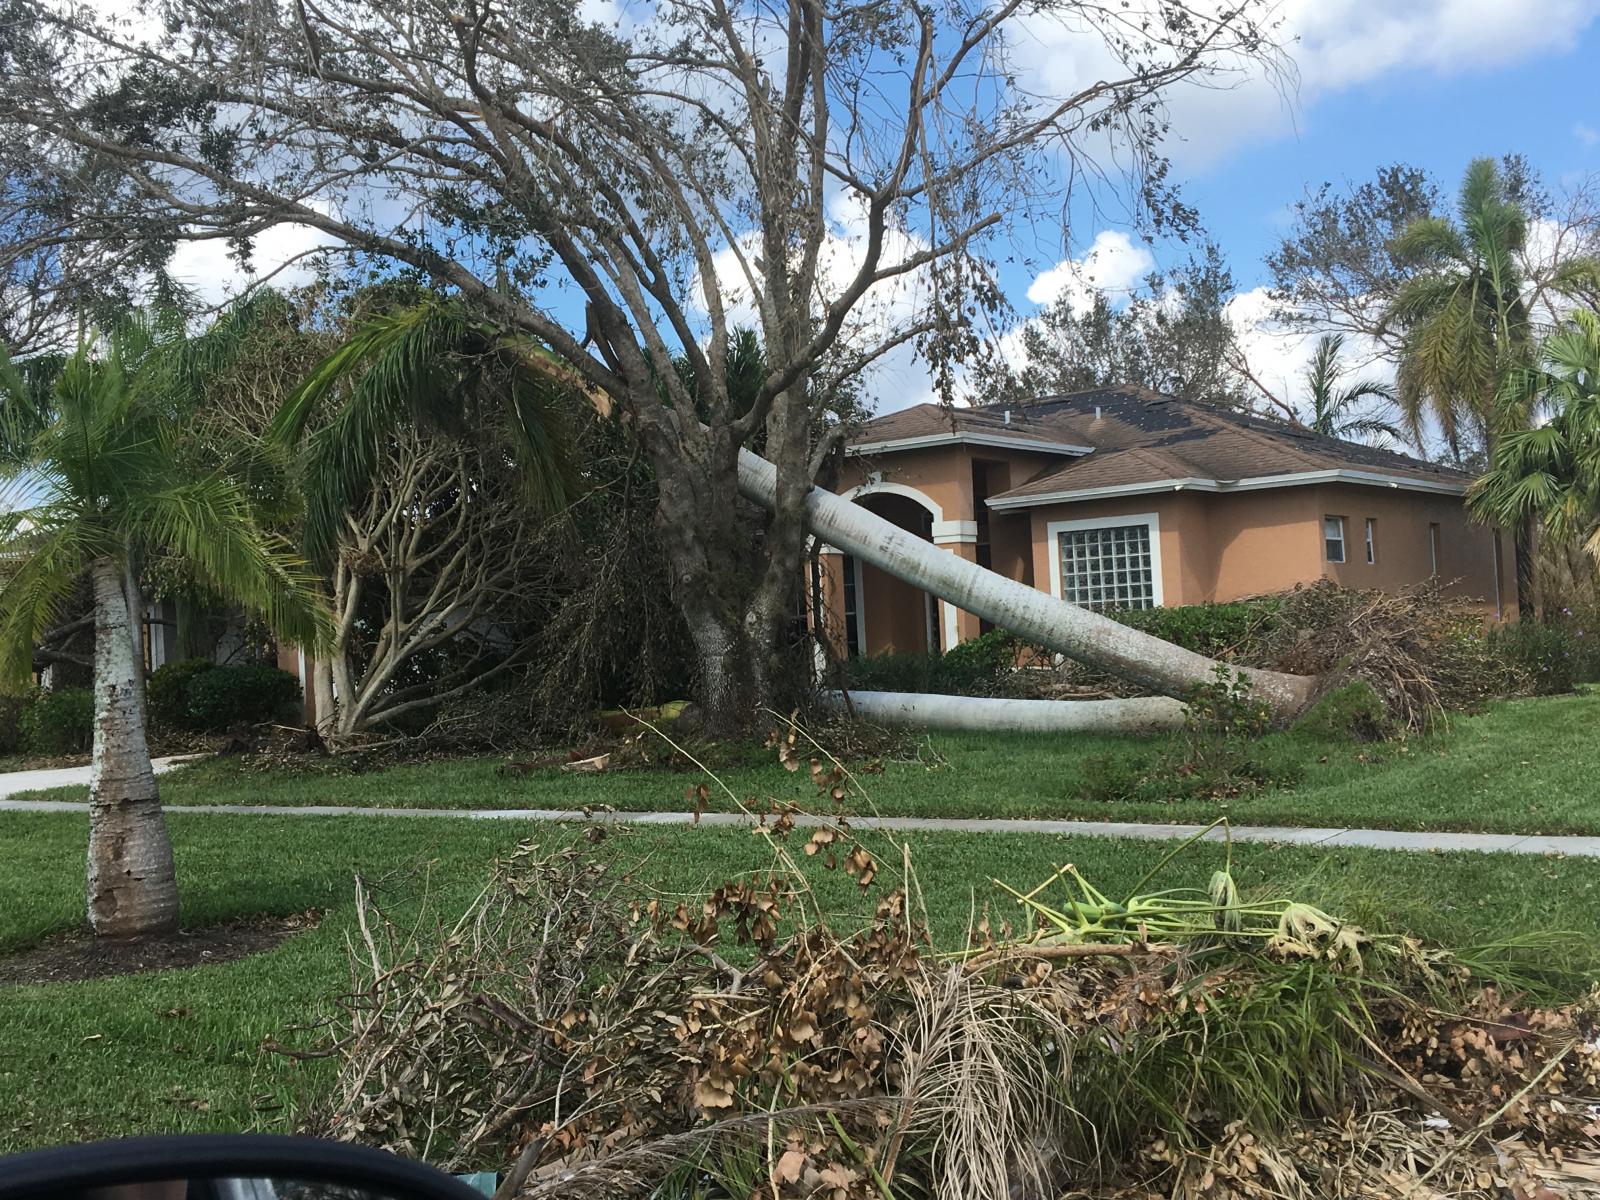
Heavy tree and fence damage was widespread. As a result, over three-quarters of electrical service customers in South Florida lost power, many for close to a week. For east coast metro areas of Miami-Dade, Broward and Palm Beach Counties, about 95% of the power was restored within 1 week after the hurricane. In the western half of South Florida, including Collier, Hendry and Glades counties, over 90% of customers lost power and for periods of over a week. Heaviest damage occurred in these western areas where some structural damage was noted, along with flooding damage from storm surge and rainfall. In Southeast Florida, structural damage was minor and mostly consisted of roof covering material and screened patios. While Irma's impacts in South Florida were significant, there is no doubt that a slightly stronger Irma and/or a slightly different path could have resulted in much more damage and loss of life and property.
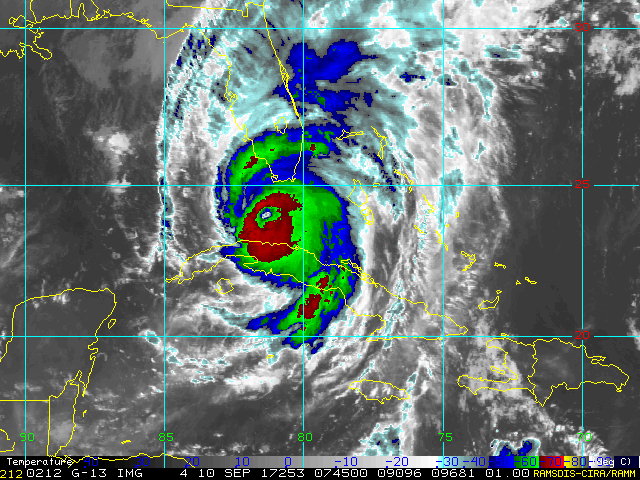
.gif)
Hurricane Irma Radar Image Loop from Miami WSR 88-D on September 10th, 2017
Collier County: the maximum surveyed inundation value was 8 feet at the Smallwood Store in Chokoloskee, with 3-5 feet across most of the island. In Everglades City, a maximum inundation of 6 feet occurred at the Everglades National Park Gulf Visitor Center, with 2-4 feet common across the town and as high as 5 feet in a few areas. Surveys conducted by the United States Geological Survey (USGS) indicated 1-2 feet of inundation as far inland as Tamiami Trail/US 41 between State Road 29 and Collier-Seminole State Park. in Goodland, about 5-6 feet of inundation was surveyed at the waterfront, with inundation of 3-4 feet across town. Marco Island had 2-4 feet of inundation, mainly on the south and east parts of the island with inland penetration of less than a half-mile. Naples had 3-4 feet of inundation at the Gulf of Mexico and Naples Bay waterfronts and extending less than a half-mile inland.
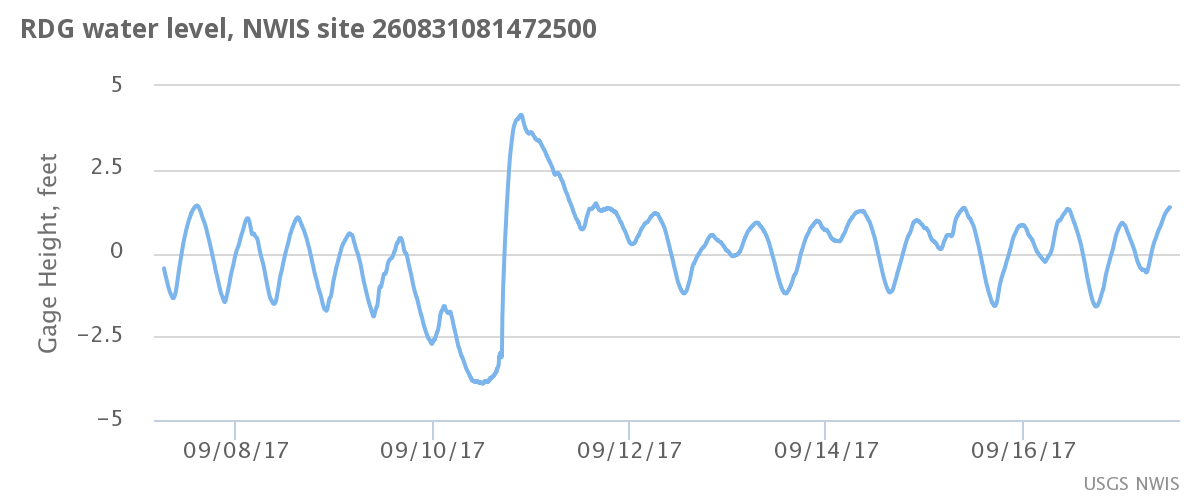
Data from a USGS rapid deployment tide gauge at the Tamiami Trail bridge over Naples Bay (image below) showed a rapid rise of 8 feet in just over 9 hours mainly on the back side of Irma during the afternoon and evening of September 10th. This rise would have likely been much greater and devastating had the center of Irma tracked just a few miles farther west.
Miami-Dade County: an average of 3-5 feet of inundation occurred along the Biscayne Bay shoreline from Homestead to Downtown Miami/Brickell and extending inland 1-2 blocks, with peak surveyed inundation of slightly greater than 6 feet in isolated spots in Coconut Grove and Brickell. Inundation decreased north of Downtown Miami along the Biscayne Bay shoreline, with values generally around 2-3 feet. Along the Atlantic oceanfront, including Key Biscayne and Miami Beach, inundation was generally around 2-3 feet and confined to the immediate beachfront.
Broward and Palm Beach Counties: maximum inundation of slightly greater than 3 feet along the Broward County coastline from Hallandale Beach to Fort Lauderdale, confined to the beachfront with lesser inundation affecting adjacent streets within 1-2 blocks of the beach. North of Fort Lauderdale through the Palm Beaches, inundation was generally 1-2 feet at the beachfront.
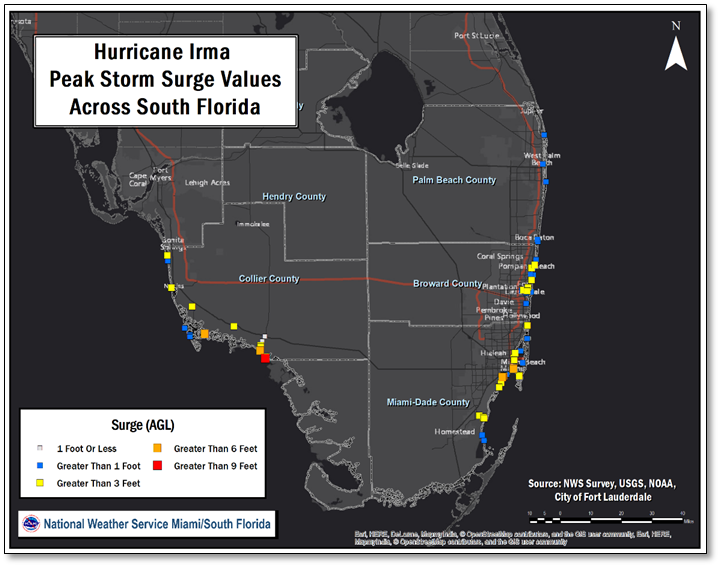
Observed storm tide inundation values. Squares represent locations with measurements
from tide gauges and/or NWS storm surveys
Irma was the first major (Category 3 or higher) hurricane to make landfall in South Florida since Wilma of 2005. The highest wind gust recorded on land in South Florida was 142 mph at a mesonet site near Naples Airport. The highest sustained wind recorded was 112 mph by a spotter on Marco Island.
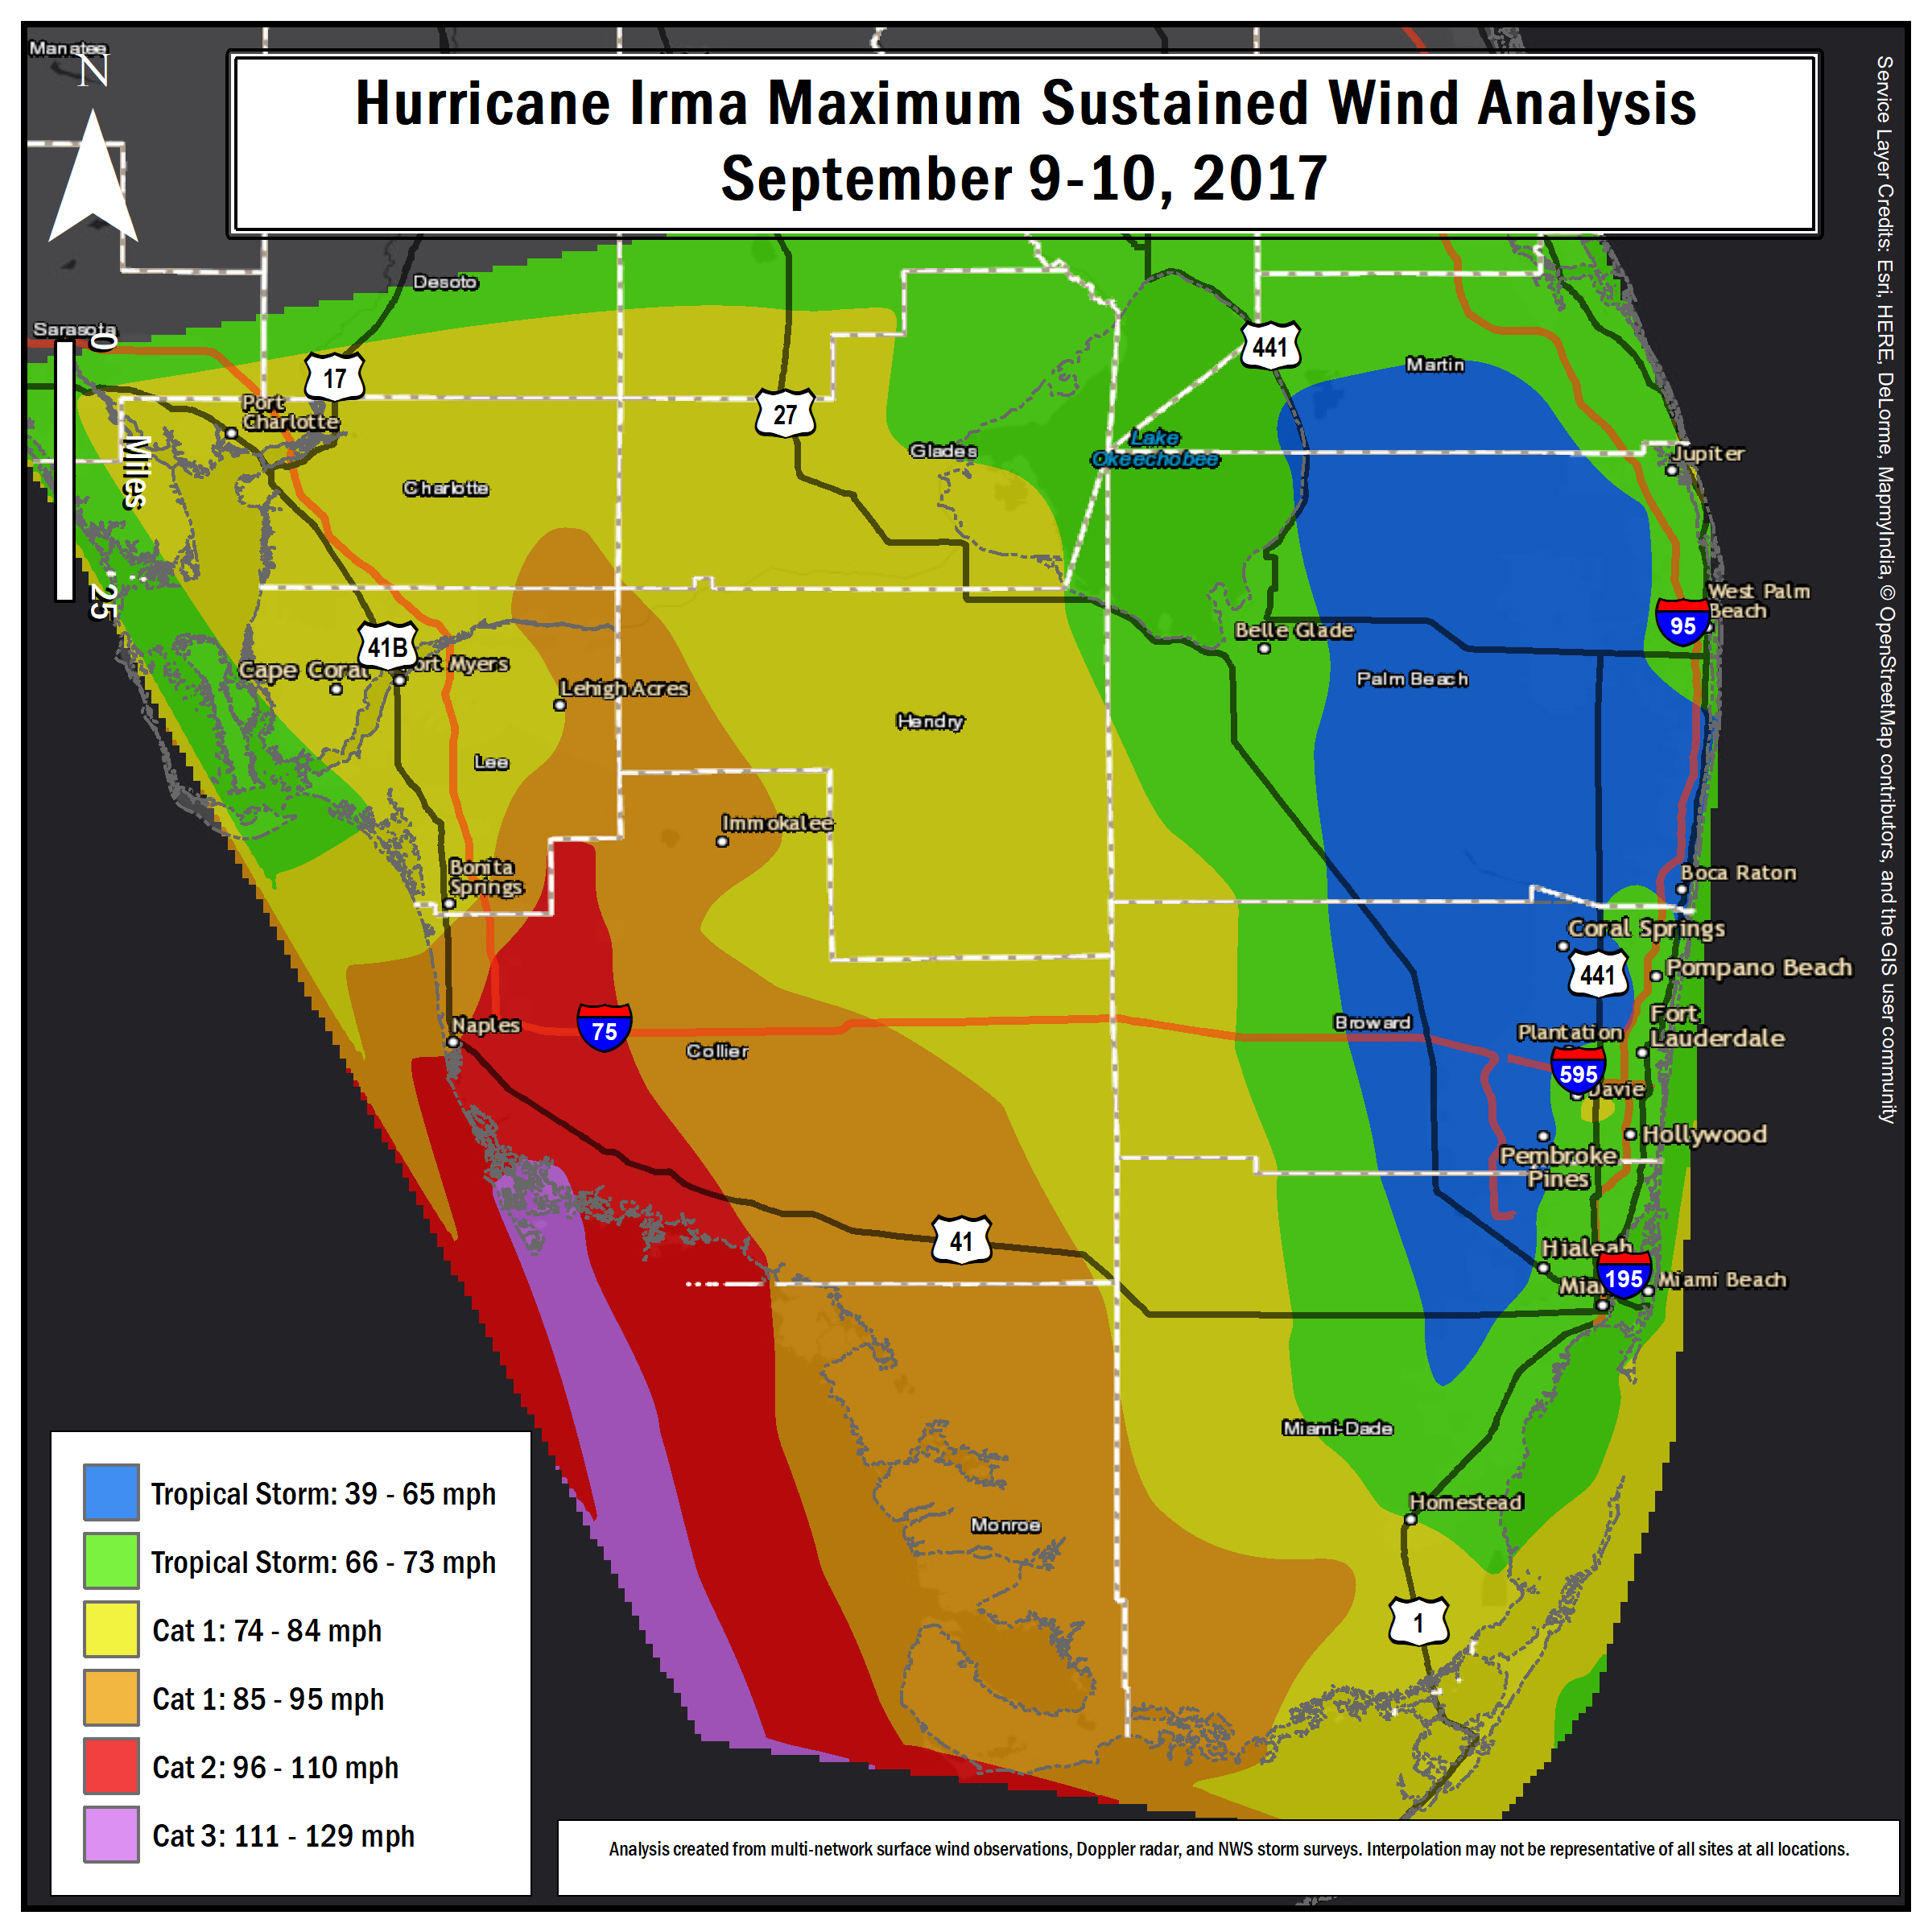
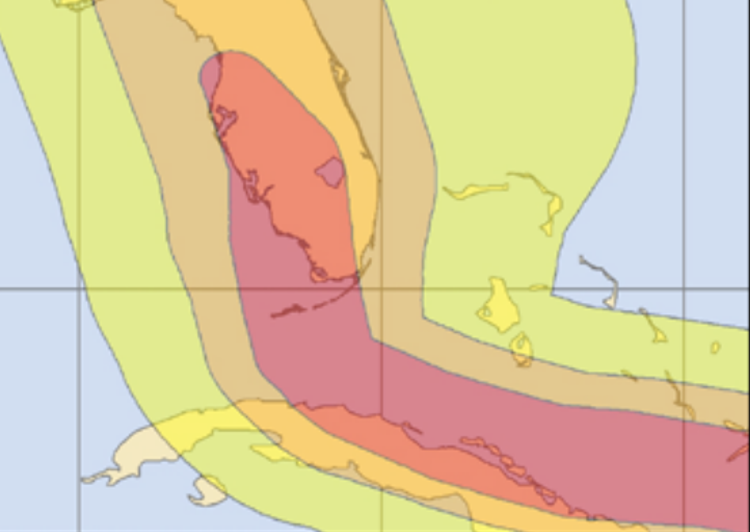
The map to the left is an analysis of maximum sustained winds (1-minute average) in Hurricane Irma conducted by NWS Miami. The analysis is a best estimate based on all available data. The map on the right is from the National Hurricane Center Tropical Cyclone Report on Hurricane Irma (red- hurricane force, orange- 58-73 mph, yellow 39-57 mph). Disclaimer: some locations may have received winds slightly higher or slightly lower than shown, and does NOT include short-duration wind gusts which were at least 20-30 mph higher than the 1-minute average sustained wind speed
Collier County: Sustained Category 3 winds of 111-115 mph were likely confined to a very small area of the eye that touched Marco Island and the immediate coastline of Collier County, including Goodland and Cape Romano. Sustained Category 2 winds (96-110 mph) likely extended farther inland into west-central Collier County in the eastern eye wall, including the Golden Gate Estates and Orangetree areas. All of the greater Naples area received hurricane force sustained winds, with Category 2 sustained winds likely affecting much of southern and eastern portions of Naples. Along the northern coast of Collier County to the north of Naples, sustained winds likely peaked at Category 1 strength. Farther to the northeast, Immokalee likely received Category 1 sustained winds. Peak wind gusts in Collier County reached at least Category 2 strength (95-110 mph) over most areas, with peak Category 3 and 4 gusts (111-140 mph) in the eastern eye wall. In addition, storm surveys indicated the likelihood of mini-vortices in the eastern eye wall which led to small swaths of higher winds.
Glades and Hendry Counties: Sustained winds of Category 1 strength likely occurred over most of Glades and Hendry counties, with highest winds in the LaBelle and Felda areas. Wind in northeastern Glades County likely peaked at slightly below hurricane force. Peak wind gusts of Category 2 strength (95-110 mph) likely occurred in the LaBelle and Felda areas.
Miami-Dade County: Most of the populated areas of Miami-Dade County experienced sustained winds of strong tropical storm force (58-73 mph). However, there were a few areas that likely experienced sustained winds of Category 1 hurricane strength. Sustained winds may have reached hurricane force (around 75 mph) in portions of southern Key Biscayne. Although not explicitly shown on the map, it is possible that sustained winds briefly reached 75 mph within a mile of Biscayne Bay (east of Bayshore Drive and east of Old Cutler Road) from Coconut Grove to Pinecrest to Palmetto Bay. However, more likely, sustained winds in that area peaked around 70 mph (just below hurricane force). Sustained winds likely reached the lower limits of Category 1 strength in portions of Homestead, especially southern and western portions of Homestead, including Florida City and southern portions of The Redland. In coastal Miami-Dade County from Downtown Miami northward, including Miami Beach, North Miami Beach, Little Haiti, North Miami and Aventura, sustained winds likely peaked in the 65-70 mph range. Sustained winds likely only reached the 55-65 mph for the western and northern parts of the metro area (west of the Palmetto expressway to Krome Avenue) including West Kendall, Doral and Miami Lakes. Almost all of Miami-Dade County experienced peak wind gusts of Category 1 strength (80-95 mph).
Broward County: One hurricane force sustained wind of 76 mph was recorded in Broward County at the Seminole Tribe Headquarters in Hollywood, so Category 1 winds are analyzed to have occurred within 1 mile of that location on our map. Elsewhere, sustained winds peaked in the 65-70 mph range in coastal and metro portions of Broward County. Sustained winds were lower in western areas such as Weston, Tamarac and Coral Springs, where the winds likely peaked in the 55-65 mph range. Gusts in most of Broward County were in the Category 1/2 range (80-100 mph). Only isolated spots had gusts over 100 mph, in the 100-110 mph range.
Palm Beach County: Sustained winds peaked in the 55-65 mph range over southern coastal areas and most of central Palm Beach County. Stronger sustained winds - in the 65-70 mph range - were observed along the immediate coastline north of West Palm Beach to Jupiter. Wind gusts reached Category 1 strength (80-90 mph) county-wide.
Mainland Monroe County: All of Mainland Monroe County likely received sustained winds that peaked in the Category 1 range (74-95 mph).
List of Maximum Sustained Winds and Gusts in South Florida
| Source | City | lat | lon | Wind Dir | Wind MPH | Time EDT | Gust MPH | Time | |
| Spotter | Marco Island | 25.92 | -81.73 | 112 | 353 PM | 129 | |||
| WeatherBug | Naples | 26.15 | -81.77 | 93 | 400 PM | 142 | 435 PM | ||
| Texas Tech | Royal Palm Hammock | 26.04 | -81.62 | ESE | 85 | 408 PM | 114 | 407 PM | |
| NDBC | Fowey Rocks | 25.59 | -80.1 | SE | 84 | 230 PM | 100 | 228 PM | |
| WeatherBug | East Naples | 26.11 | -81.69 | ESE | 82 | 400 PM | 122 | 404 PM | |
| WeatherBug | West Hollywood | 26.046 | -80.216 | SSE | 81 | 350 PM | 109 | ||
| Texas Tech | 5 SW Florida City | 25.4 | -80.56 | ESE | 76 | 1158 AM | 89 | 945 AM | |
| Wxflow | Government Cut | 25.75 | -80.1 | SE | 74 | 252 PM | 91 | 252 PM | |
| Wxflow | Belle Meade | 26.037 | -81.701 | E | 71 | 357 PM | 99 | 402 PM | |
| Wxflow | Turkey Point | 25.43 | -80.35 | SSE | 71 | 146 PM | 93 | 101 PM | |
| WeatherBug | Deerfield Beach 2 | 26.31 | -80.152 | SSE | 70 | 600 PM | 100 | ||
| Texas Tech | 4 E Orangetree | 26.29 | -81.51 | SSE | 70 | 551 PM | 89 | 545 PM | |
| WxFlow | Port Everglades South | 26.086 | -80.116 | SE | 70 | 405 PM | 85 | 235 PM | |
| WxFlow | Jupiter | 26.893 | -80.056 | SSE | 70 | 754 PM | 85 | 754 PM | |
| AWS | Ft. Lauderdale Beach | 26.11 | -80.11 | 70 | 329 PM | ||||
| ASOS | Pompano Beach | 26.25 | -80.11 | SE | 69 | 439 PM | 88 | 446 PM | ** |
| WeatherBug | West Miami | 25.741 | -80.295 | ESE | 68 | 1140 AM | 93 | ||
| Miccosukee Village | 25.85 | -80.77 | ESE | 68 | 115 PM | 86 | 1258 PM | ||
| FAWN | Clewiston | 26.739 | -81.053 | SSE | 68 | 815 PM | |||
| FAA ITWS | Miami | 25.8 | -80.29 | 67 | 1246 PM | 99 | 119 PM | ||
| WeatherBug | Ft. Lauderdale | 26.115 | -80.141 | SSE | 67 | 450 PM | 82 | ||
| WeatherBug | Bal Harbour | 25.901 | -80.125 | ENE | 67 | 500 AM | 79 | 626 AM | |
| ASOS | West Palm Beach | 26.68 | -80.1 | SE | 66 | 501 PM | 91 | 455 PM | |
| Ave Maria | 26.3 | -81.43 | SE | 66 | 600 PM | 89 | 525 PM | ||
| CWOP | Port Everglades | 26.1 | -80.12 | 65 | 758 AM | 87 | 803 AM | ** | |
| ASOS | Opa Locka | 25.91 | -80.28 | SE | 64 | 303 PM | 85 | 1039 AM | |
| NOS | Naples Pier | 26.132 | -81.807 | WNW | 64 | 600 PM | 83 | 600 PM | |
| FAWN | Immokalee | 26.462 | -81.44 | SE | 64 | 700 PM | 83 | 645 PM | ** |
| RAWS | Ochopee | 25.9 | -81.32 | 63 | 303 PM | 96 | 403 PM | ||
| NOS | Lake Worth | 26.613 | -80.034 | SE | 63 | 500 PM | 91 | 500 PM | |
| Wxflow | Morningside | 25.82 | -80.18 | SSE | 63 | 254 PM | 84 | 334 PM | |
| Texas Tech | Miles City 1 | 26.15 | -81.34 | ESE | 63 | 432 PM | 84 | 344 PM | |
| WxFlow | Dania Beach 1 | 26.058 | -80.111 | 63 | 239 PM | 80 | 159 PM | ** | |
| Wxflow | Lake Okeechobee West | 26.96 | -80.94 | SE | 63 | 830 PM | 78 | 707 PM | |
| WeatherBug | Pembroke Pines | 26.01 | 80.27 | E | 61 | 1120 AM | 109 | 1040 AM | |
| ASOS | Ft. Lauderdale Executive AP | 26.2 | -80.17 | ESE | 61 | 247 PM | 83 | 218 PM | |
| ASOS | Naples Executive AP | 26.15 | -81.78 | ENE | 61 | 201 PM | 82 | 200 PM | ** |
| Texas Tech | 9 ESE Golden Gate | 26.15 | -81.54 | ESE | 60 | 452 PM | 89 | 446 PM | |
| Wxflow | Biscayne Bay 3 SW Bill Baggs | 25.657 | -80.185 | SE | 60 | 224 PM | 87 | 224 PM | |
| Wxflow | Lake Okeechobee Central | 26.9 | -80.79 | SSE | 60 | 830 PM | 77 | 814 PM | |
| Wxflow | Lake Okeechobee Northern | 27.14 | -80.79 | SE | 60 | 915 PM | 75 | 951 PM | |
| Texas Tech | South Beach | 25.76 | -80.13 | SSW | 60 | 639 PM | 74 | 639 PM | |
| Wxflow | Lake Okeechobee Southern | 26.82 | -80.78 | SE | 60 | 830 PM | 71 | 900 PM | |
| WeatherBug | Deerfield Beach 1 | 26.299 | -80.12 | SE | 59 | 400 PM | 111 | ||
| Texas Tech | Broward Miccosukee Reservation | 26.17 | -80.85 | ESE | 59 | 127 PM | 78 | 127 PM | |
| Wxflow | Dinner Key | 25.71 | -80.21 | 58 | 228 PM | 82 | 228 PM | ||
| Texas Tech | Dania Beach 2 | 26.04 | -80.11 | SE | 58 | 355 PM | 69 | 403 PM | |
| Wxflow | Palmetto Bay | 25.63 | -80.3 | ESE | 57 | 900 AM | 82 | 620 AM | ** |
| WeatherBug | Plantation | 26.127 | -80.269 | SE | 57 | 500 PM | 77 | ||
| RAWS | Chekika | 25.62 | -80.58 | 56 | 123 PM | 90 | 1223 PM | ||
| WeatherBug | North Lauderdale | 26.222 | -80.221 | E | 56 | 1120 AM | 84 | ||
| WeatherBug | Cutler Ridge | 25.571 | -80.367 | ESE | 56 | 1100 AM | 83 | 1013 AM | |
| ASOS | North Perry Airport | 26 | -80.24 | ESE | 56 | 1251 PM | 78 | 1022 AM | ** |
| WeatherBug | North Naples | 26.27 | 81.75 | ENE | 55 | 500 PM | 112 | 534 PM | ** |
| RAWS | Royal Palm Ranger Station | 25.39 | -80.68 | SE | 55 | 1223 PM | 91 | 1023 AM | ** |
| Wxflow | Dodge Island | 25.767 | -80.145 | SE | 55 | 317 PM | 79 | 317 PM | |
| SFWMD | Brighton | 27.192 | -81.128 | E | 55 | 730 PM | 78 | 845 PM | |
| Texas Tech | 6 E Miccosukee Village | 25.76 | -80.67 | SE | 55 | 103 PM | 76 | 1205 PM | ** |
| Wxflow | Crandon Park, Key Biscayne | 25.72 | -80.15 | ESE | 55 | 1155 AM | 75 | 1155 AM | ** |
| ASOS | West Kendall | 25.65 | -80.43 | ESE | 55 | 710 AM | 72 | 710 AM | ** |
| WeatherBug | Weston | 26.065 | -80.394 | E | 54 | 100 PM | 98 | ||
| WeatherBug | Hollywood | 25.997 | -80.161 | SE | 54 | 600 PM | 86 | ** | |
| WeatherBug | Immokalee | 26.41 | -81.42 | E | 54 | 240 PM | 80 | 223 PM | ** |
| WeatherBug | Moore Haven | 26.83 | -81.1 | ESE | 54 | 700 PM | 78 | ||
| WeatherBug | Margate | 26.259 | -80.194 | ESE | 53 | 325 PM | 79 | ||
| ASOS | Miami International AP | 25.8 | -80.29 | ESE | 53 | 903 AM | 72 | 912 AM | ** |
| ASOS | FLL | 26.07 | -80.15 | ESE | 53 | 70 | ** | ||
| WeatherBug | Sunrise | 26.166 | -80.253 | ESE | 52 | 100 PM | 82 | ||
| WxFlow | Boca Raton | 26.371 | -80.085 | SE | 51 | 458 PM | 79 | 443 PM | |
| WxFlow | Boynton Beach | 26.547 | -80.053 | E | 51 | 417 PM | 78 | 527 PM | |
| WeatherBug | Ft. Lauderdale | 26.12 | -80.18 | ESE | 50 | 900 AM | 80 | ||
| SFWMD | 8 ESE Golden Gate | 26.145 | -81.576 | S | 50 | 545 PM | 88 | 545 PM | |
| SFWMD | Ortona | 26.79 | -81.303 | E | 50 | 530 PM | 75 | 730 PM | |
| Wxflow | Mirimar | 25.967 | -80.301 | ESE | 50 | 227 PM | 84 | 147 PM | |
| Wxflow | Doral | 25.855 | -80.369 | ESE | 50 | 101 PM | 77 | 1246 PM | |
| WeatherBug | Oakland Park | 26.204 | -80.127 | SSW | 49 | 500 PM | 85 | ||
| WeatherBug | Coral Springs | 26.264 | -80.297 | SE | 49 | 300 PM | 89 | 300 PM | |
| WxFlow | Jupiter | 26.912 | -80.073 | SE | 48 | 701 PM | 77 | 526 PM | |
| WeatherBug | Sunrise | 26.169 | -80.288 | SE | 48 | 500 PM | 98 | ||
| WeatherBug | Parkland | 26.306 | -80.274 | ESE | 48 | 400 PM | 82 | ||
| WeatherBug | Doral | 25.79 | -80.341 | E | 47 | 200 PM | 96 | 237 PM | |
| WeatherBug | Homestead | 25.448 | -80.459 | E | 46 | 1000 AM | 78 | 856 AM | ** |
| WeatherBug | Plantation | 26.114 | -80.255 | E | 46 | 700 AM | 76 | ||
| RAWS | West of Loxahatchee | 26.488 | -80.427 | SE | 46 | 632 PM | 76 | 532 PM | |
| WxFlow | Dania Beach | 26.061 | -80.126 | SE | 46 | 252 PM | 82 | 222 PM | |
| RAWS | Oasis | 25.86 | -81.033 | SSW | 45 | 1237 PM | 77 | 137 PM | |
| Wxflow | Naples | 26.167 | -81.79 | NE | 44 | 440 PM | 82 | 445 PM | |
| WeatherBug | Mirimar | 25.99 | -80.28 | SSE | 44 | 400 PM | 98 | 1044 AM | ** |
| WxFlow | West Palm Beach | 26.756 | -80.069 | SE | 44 | 554 PM | 75 | 554 PM | |
| WeatherBug | Vizcaya | 25.748 | -80.212 | ESE | 43 | 200 AM | 76 | ||
| WeatherBug | Davie | 26.087 | -80.234 | ESE | 43 | 200 PM | 74 | ||
| WeatherBug | Delray Beach | 26.44 | -80.13 | ESE | 43 | 300 PM | 79 | ||
| WeatherBug | Davie | 26.105 | -80.282 | E | 42 | 300 PM | 77 | ||
| GUSTS WITH NO SUSTAINED REPORTED | Gust MPH | Time | |||||||
| Personal | Marco Island PD | 25.94 | -81.71 | 130 | 300 PM | ||||
| WeatherStem | Virginia Key | 25.73 | -80.16 | 101 | 132 PM | ||||
| WeatherBug | Coral Gables | 25.73 | -80.26 | 90 | 210 PM | ** | |||
| WeatherBug | Pelican Bay | 26.212 | -81.81 | 82 | ** | ||||
| NHC | Tamiami Park/FIU | 25.76 | -80.38 | 81 | 108 PM | ||||
| WeatherBug | South Miami | 25.71 | -80.33 | 80 | 137 PM | ** | |||
| WeatherBug | MIA South Terminal | 25.79 | -80.27 | 77 | ** | ||||
| RAWS | Sunniland | 26.248 | -81.295 | 75 | 445 PM | ||||
| RAWS | Miles City 2 | 26.169 | -81.364 | 75 | 511 PM | ||||
** indicates anemometer failed before peak of storm
Rainfall
Highest rainfall amounts occurred over inland portions of Collier County and western sections of Hendry and Glades counties where the eye of Irma passed. These areas received anywhere from 9-15 inches of rain, with estimates of up to 20 inches in the Felda area as well as the Big Cypress National Preserve. Elsewhere, rainfall totals were mainly in the 6-10 inch range.
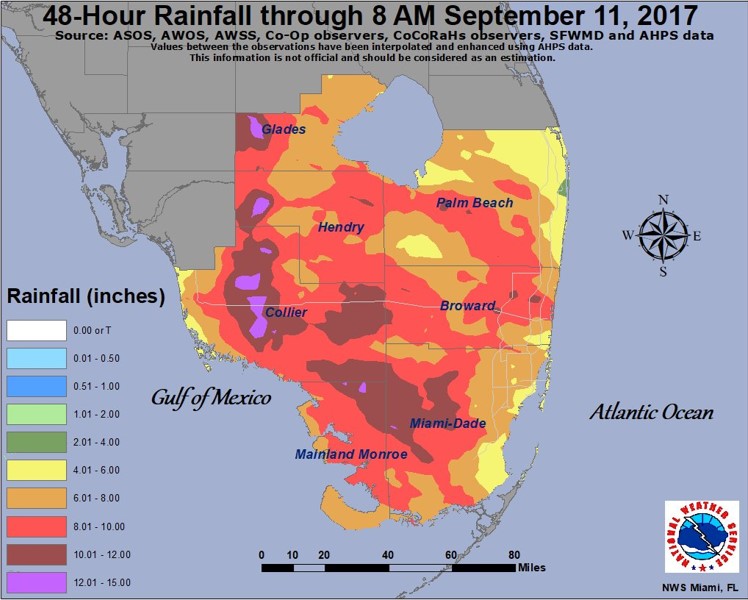
Rainfall amounts produced by Hurricane Irma in South Florida
Five tornadoes were confirmed in South Florida in association with Irma – 1 in Miami-Dade County, 3 in Broward County and 1 in Collier County. The tornado in Collier County occurred 2 miles west of Ochopee where wooden power poles were damaged along Tamiami Trail between Ochopee and the SR-29 intersection. It was determined to be an EF-1. The tornado in Miami-Dade County occurred near Homestead Motor Speedway. In Broward County, 2 of the tornadoes were EF-1 and the other was EF-0. One of the EF-1 tornadoes occurred 4 miles west of Miramar along 172nd avenue between Memorial Hospital and Miramar Regional Park, where sections of trees were ripped apart. The other EF-1 occurred 4 miles WNW of Miramar in the Chapel Trail Neighborhood near NW 196th Avenue, north of Pines Blvd. There were several trees that were ripped apart in a localized area with some damage to roof tiles and screened patios. The damage pattern suggested rotation. The EF-0 tornado was a brief touchdown near Oakland Park.
Deaths: Hurricane Irma was responsible for 1 direct death in South Florida. An 86 year old man in Broward County died after opening the front door of his home during the hurricane to see what was going on when a gust of wind knocked him to the floor, causing him to hit his head. There were 33 indirect deaths in South Florida which occurred before, during and after the storm, including 14 after the storm due to hyperthermia in a nursing home in Hollywood.
Damage: In Collier County, at least 88 structures were destroyed and 1,500 others with major damage. Heavy tree and power pole damage occurred in areas affected by the eye wall, including Port of the Islands, Marco Island, Collier Seminole State Park, Golden Gate, Orangetree and parts of the city of Naples. In Hendry County, 42 homes were destroyed, 131 homes suffered major damage and 451 had minor damage. In Glades County, 33 structures were destroyed, 452 with major damage and 442 with minor damage. In Miami-Dade County, while there were no homes that were completely destroyed, there were 1,585 that had damage; including about 1,000 with significant damage. The majority of damage in the county was to trees and fences, with flooding damage in areas impacted by storm surge along the Biscayne Bay shoreline. Rainfall flooding lingered for at least a week after the storm in portions of Collier, Hendry and Glades counties, causing damage to homes as well as farmland.
Monetary losses: Unincorporated Collier County (not including Naples, Marco Island and Everglades City) had $320 million in damage. Over 30,000 insurance claims were filed in Collier County. In Hendry County, over 2,000 insurance claims were filed. In Glades County, 669 insurance claims were filed. 50% of Miami-Dade’s agricultural crops weredamaged, resulting in damages of $245 million. 55,012 insurance claims were filed in Miami-Dade. In Broward, 38,836 insurance claims were filed. Most damage in Broward was primarily to trees and fences. In Palm Beach County, the total damage amount from Irma was reported to be $300 million.


 Follow us on YouTube