Event Overview
| Hurricane Floyd Storm Summary |
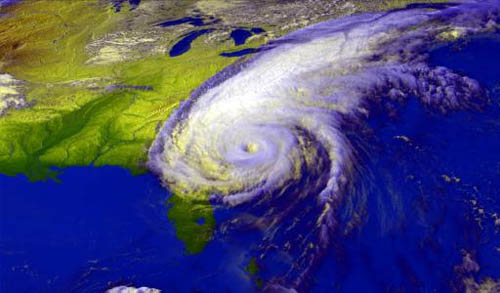 |
| Floyd was a large and intense Cape Verde hurricane that pounded the Bahama Islands, seriously threatened Florida, struck the coast of North Carolina and moved up the east coast into New England. It neared category five intensity on the Saffir-Simpson Hurricane Scale as it approached the Bahamas, and produced a flooding catastrophe in the eastern United States, particularly in North Carolina. |
Track & Intensity
| Floyd originated as a tropical wave that moved off the coast of Africa on September 2. It moved gradually westward and remained disorganized and devoid of deep convection until September 7, when a band of deep convection developed over the center in response to a developing anticyclone. At that point, the National Hurricane Center named it Tropical Depression Eight, while it was approximately 1,000 miles east of the Lesser Antilles. A strong ridge of high pressure to its north forced the developing tropical cyclone westward over warmer waters, allowing it to strengthen to Tropical Storm Floyd on September 8th. | 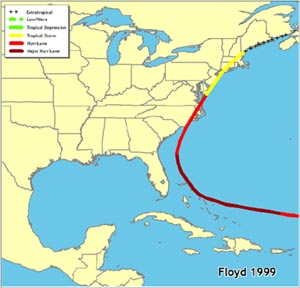 |
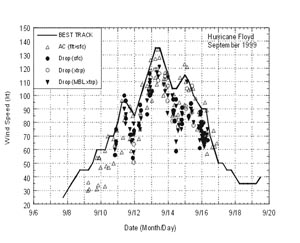 |
Then on September 11th, Floyd approached major hurricane strength with winds of 110 mph, just north of the Leeward Islands. A turn to the west, caused by building of high pressures, was followed by a period of rapid intensification. In 24 hours maximum sustained winds increased from 110 mph to 155 mph, while the pressure dropped to 921 mbar (hPa) by morning on the 13th. One contributor to the intensification was the high oceanic heat content along the storm's path. |
| Hurricane Floyd remained just below Category 5 status on the Saffir-Simpson Hurricane Scale for 12 hours while crossing the Bahamas, before an eyewall replacement cycle weakened it to a Category 3 hurricane. The new, larger eyewall contracted slightly, and the hurricane briefly re-intensified to Category 4 status. A strong mid- to upper-level trough eroded the western portion of the high-pressure ridge, steering Floyd to the northwest. It paralleled the eastern Florida coast 110 miles off shore, and steadily weakened because of entrainment of dry air and upper-level shear. |  |
| Floyd weakened and made landfall at Cape Fear, NC as a Category 2 hurricane with 105 mph winds on September 16. After crossing over North Carolina and southeastern Virginia, it briefly reentered the western Atlantic Ocean before reaching Long Island on the 17th. The storm gradually lost its tropical characteristics and became extratropical over southern Maine late on the 17th. |
Storm Surge
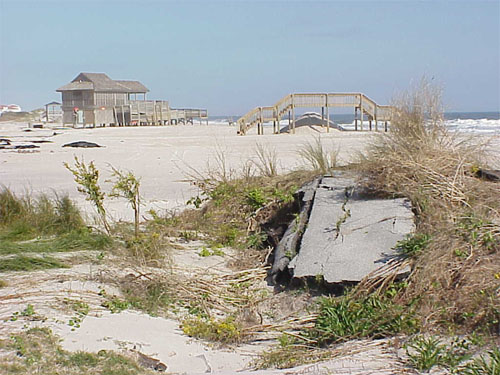 |
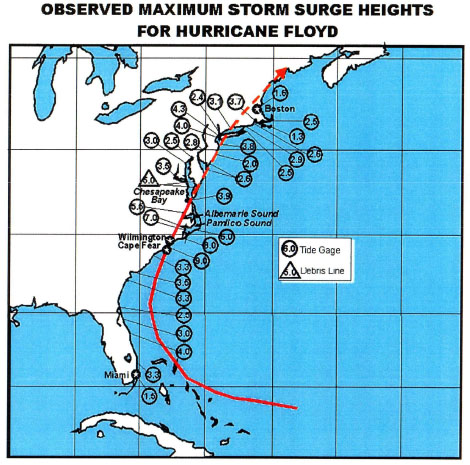
| Hurricane Floyd at one time was one of the strongest storms to threaten the eastern coast of the United States. Hurricane Floyd made landfall with sustained winds of 110 mph and a storm surge of about 10 feet (Pasch and others, 2000). The maximum surge occurred near high tide contributing substantially to extensive overwash, dune retreat, and damage to homes on barrier islands such as Oak and Topsail Islands). As was done following Hurricane Dennis on the northern Outer Banks, shoreline topography was measured using airborne laser altimetry immediately following Hurricane Floyd. Initial results indicate that the effects of Hurricane Floyd on shoreline erosion and dune retreat were greater than the effects of Hurricane Bonnie, a Category 3 storm that made landfall in the same area in 1998. |
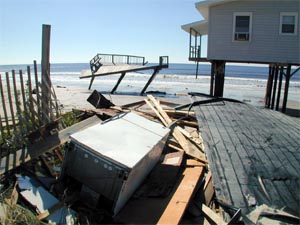 |
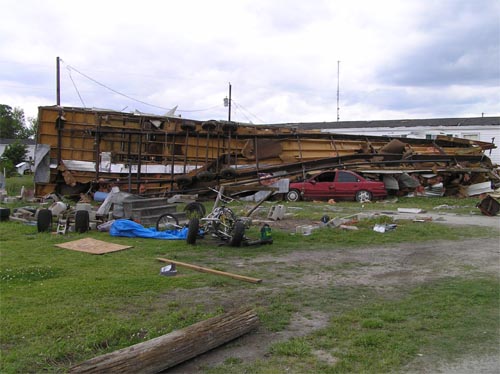
Long Beach, NC, September 17, 1999 -- Hurricane Floyd brought a devastating 15-foot-high storm surge that destroyed or damaged hundreds of houses along this community's ocean front. This house is one of many that are barely standing amidst the debris. Photo by Dave Gatley - FEMA News Photo |
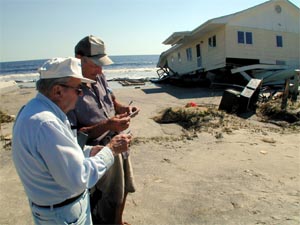 |
Long Beach, NC, September 17, 1999 -- The devastating 15-foot storm surge that accompanied Hurricane Floyd damaged or destroyed hundreds of houses along this community's ocean front and flattened its frontal sand dunes. Here, 81 year old Mike Semancik, left, and his friend Bob Grazetti, right, use photographs to document the damage. Photo by Dave Gatley - FEMA News Photo |
 The above image courtesy of the NOAA's Hurricane Floyd Assessment. |
Tornadoes
 |
| Many tornadoes were sighted in eastern North Carolina. There was a confirmed tornado in Bertie County and another in Perquimans County. At least ten tornadoes were reported by spotters in the Newport/Morehead City, NC county warning area, and these caused some structural damage. Four tornadoes or funnel clouds were seen in the Wilmington, NC county warning area, but no damage was reported. |
| Between 1108 am and 900 pm on Wednesday, September 15 the NWS in Newport/Morehead City, NC issued 20 tornado warnings, averaging 2 per hour. At least 10 tornadoes were reported by spotters during the event. Extensive structural damage occurred due to tornadoes across the county warning area. One tornado, believed to ba a F2 spotted near Hobucken in Pamlico County, destroyed several structures including a mobile home, a house, and tore the roof off of a school. Another tornado near Emerald Isle in Carteret County damaged 5 houses with 2 receiving major damage and 2 destroyed. Other reports of tornado include one in Windsor in Bertie County, NC. A tree was blown down and was witnessed by a citizen. Another occured near Durants Neck in Perquimans County. It destroyed 2 houses a half mile apart near the Albemarle Sound. 3 to 4 other homes sustained minor damage. |
Rain
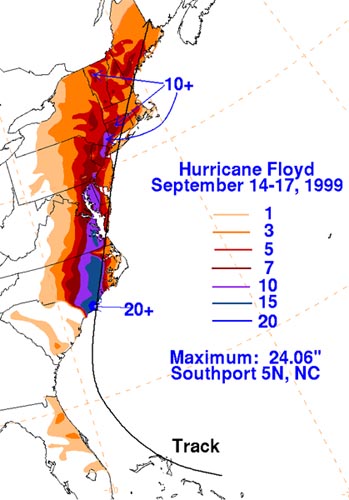 Storm Total Rainfall for Hurricane Floyd (in) |
| Rainfall totals as high as 15 to 20 inches were recorded in portions of eastern North Carolina and Virginia. At Wilmington, North Carolina, the storm total of 19.06 inches included a 24-hour record of 15.06 inches. Totals of 12 to 14 inches were observed in Maryland, Delaware, and New Jersey. New records were set in Philadelphia for the most amount of rain in a calendar day, 6.63 inches. In southeastern New York, rainfall totals were generally in the 4 to 7 inch range with localized amounts of 13.70 inches in Brewster. Totals of nearly 11 inches were measured in portions of New England. The above image is courtesy of the Hydrologic Prediction Center. |
Wind
 |
| There was a 10 meter anemometer measurement of sustained winds of 83 knots at 7:10 UTC with gusts to 106 knots at 7:16 UTC taken by a University of Oklahoma meteorology professor near Topsail Beach, North Carolina. There were also unofficial reports of peak wind gusts to 120 knots (at 8 stories elevation) at Wrightsville Beach and 104 knots at the Wilmington Emergency Operations Center. Generally, sustained winds in Eastern North Carolina were 40 to 50 kt with gusts 60 to 70+. |
Below are peak wind gusts for Hurricane Floyd as reported by The National Weather Service and other sources:
|
Buoys
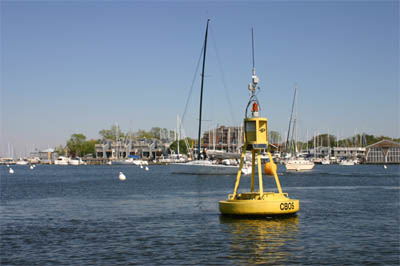 |
| Floyd's eye passed over NOAA data buoy 41010, located about 105nm eastnortheast of Cape Canaveral, around 9:00 UTC September 15th. That buoy reported maximum 8-minute averaged winds of 72 knots at an anemometer height of 5 meters. The center of the hurricane passed about 25nm west of the Frying Pan Shoals C-MAN station located about 30nm southeast of Cape Fear at 5:00 UTC on September 16th. This station reported winds sustained at 86 knots for a 20-minute period centered at that time, at an anemometer height of 44 meters. |
Below are measurements taken by various National Data Buoy Center buoys and C-MAN stations affected by Hurricane Floyd:
|
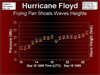
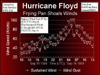
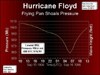
The National Data Buoy Center also has archived plots of their observations. Below you will find 3 different plots from observations taken at the National Data Buoy Center's Frying Pan Shoals C-MAN station off the North Carolina & South Carolina coast. Click on the thumbnail to view the full sized plot. Thanks to NWS Wilmington for this information. |
||
| Wave Height | Wind Speed | Pressure |
 |
 |
 |
Radar & Satellite Images
 |
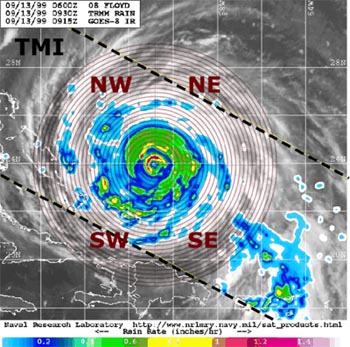
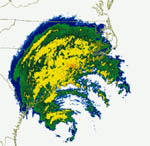
| Below you will find a select amount of radar and satellite images archived from Hurricane Floyd. |
 |
 |
 |
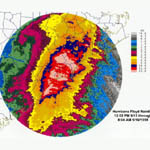
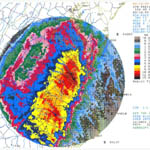
| Radar Loop from NWS Wilmington, NC 5 PM 9/15 - 5 AM 9/16 |
Satellite Loop of Floyd as it Hits East Coast | Storm Wind Velocity Loop from NWS Wilmington, NC |
 |
 |
 |
| Radar Estimation of Storm Total Precip from NWS Wilmington, NC | Radar Estimation of Storm Total Precip from NWS Wakefield, VA | NOAA GOES Satellite Composite from September, 16 at 1445Z |
Hurricane Dennis
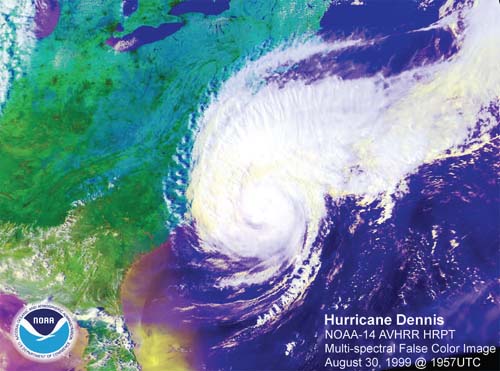 |
| The effects of Hurricane Floyd were exacerbated by Hurricane Dennis. Dennis slammed the North Carolina coast less than a month before Hurricane Floyd with over 10 inches of rain in areas of eastern North Carolina. The resulting rainfall saturated much of the soil in North Carolina and portions of Virginia. This helped to increase the flooding potential of Hurricane Floyd. Hurricane Dennis developed over the eastern Bahamas on the 26th and drifted northward parallel to the southeast U.S. coast from the 26th through the 30th. Dennis became an immediate threat to southeastern North Carolina on the 29th. The center approached to within 60 miles of the coast early on the 30th as a strong category two hurricane with highest sustained winds of 105 miles per hour. Due to the fact that the hurricane never made landfall, damage was only moderate. Rainfall amounts approached ten inches in coastal southeastern North Carolina and beach erosion was substantial. Dennis made a return visit in September as a tropical storm, moving west-northwest through eastern and central North Carolina. The main impact this time was flooding due to heavy rains, with the maximum preliminary report being 13.82 inches in Allisonia, VA. However, due to the storm lingering just off the coast for several days, beach erosion and damage to coastal highways was significant. Residents of Hatteras and Ocracoke Islands were stranded for several days due to severe damage to Highway 12. The rainfall image below is courtesy of the Hydrologic Prediction Center. |
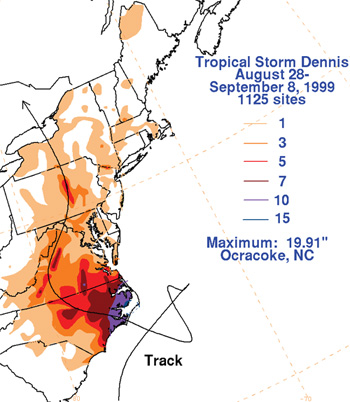 Storm Total Rainfall for Hurricane Dennis (in) |


.png) Surf Forecast/Rip Currents
Surf Forecast/Rip Currents Map View
 Weather Hazard Briefing (when applicable)
 Forecaster Discussion
 Marine
 Text Products
.png) Skywarn
Skywarn Submit Storm Reports
 Coastal Flood
 Follow us on YouTube