Note: Daily rainfall and temperature maps represent 24 hour analysis from 12Z UTC (7am EST/8am EDT) to 12Z UTC (7am EST/8am EDT). Maps will typically be updated around noon each day. Data sources include Automated Surface Observing Stations (ASOS), NWS Cooperative Observers, and CoCoRaHs reports.
Temperature & Precipitation Maps - NC State Climate Office
Cooperative Observer and CoCoRaHS Rainfall Reports
Station Observations and Climate Data
CoCoRaHS (Community Collaborative Rainfall, Hail and Snow Observations)
Interactive Radar Derived Precipitation On Highway Map
Precipitation Maps (observed and percent of normal)
Precipitation Trends for Raleigh, Greensboro & Fayetteville
High Temperatures
Low Temperatures
Precipitation


 Heat Safety
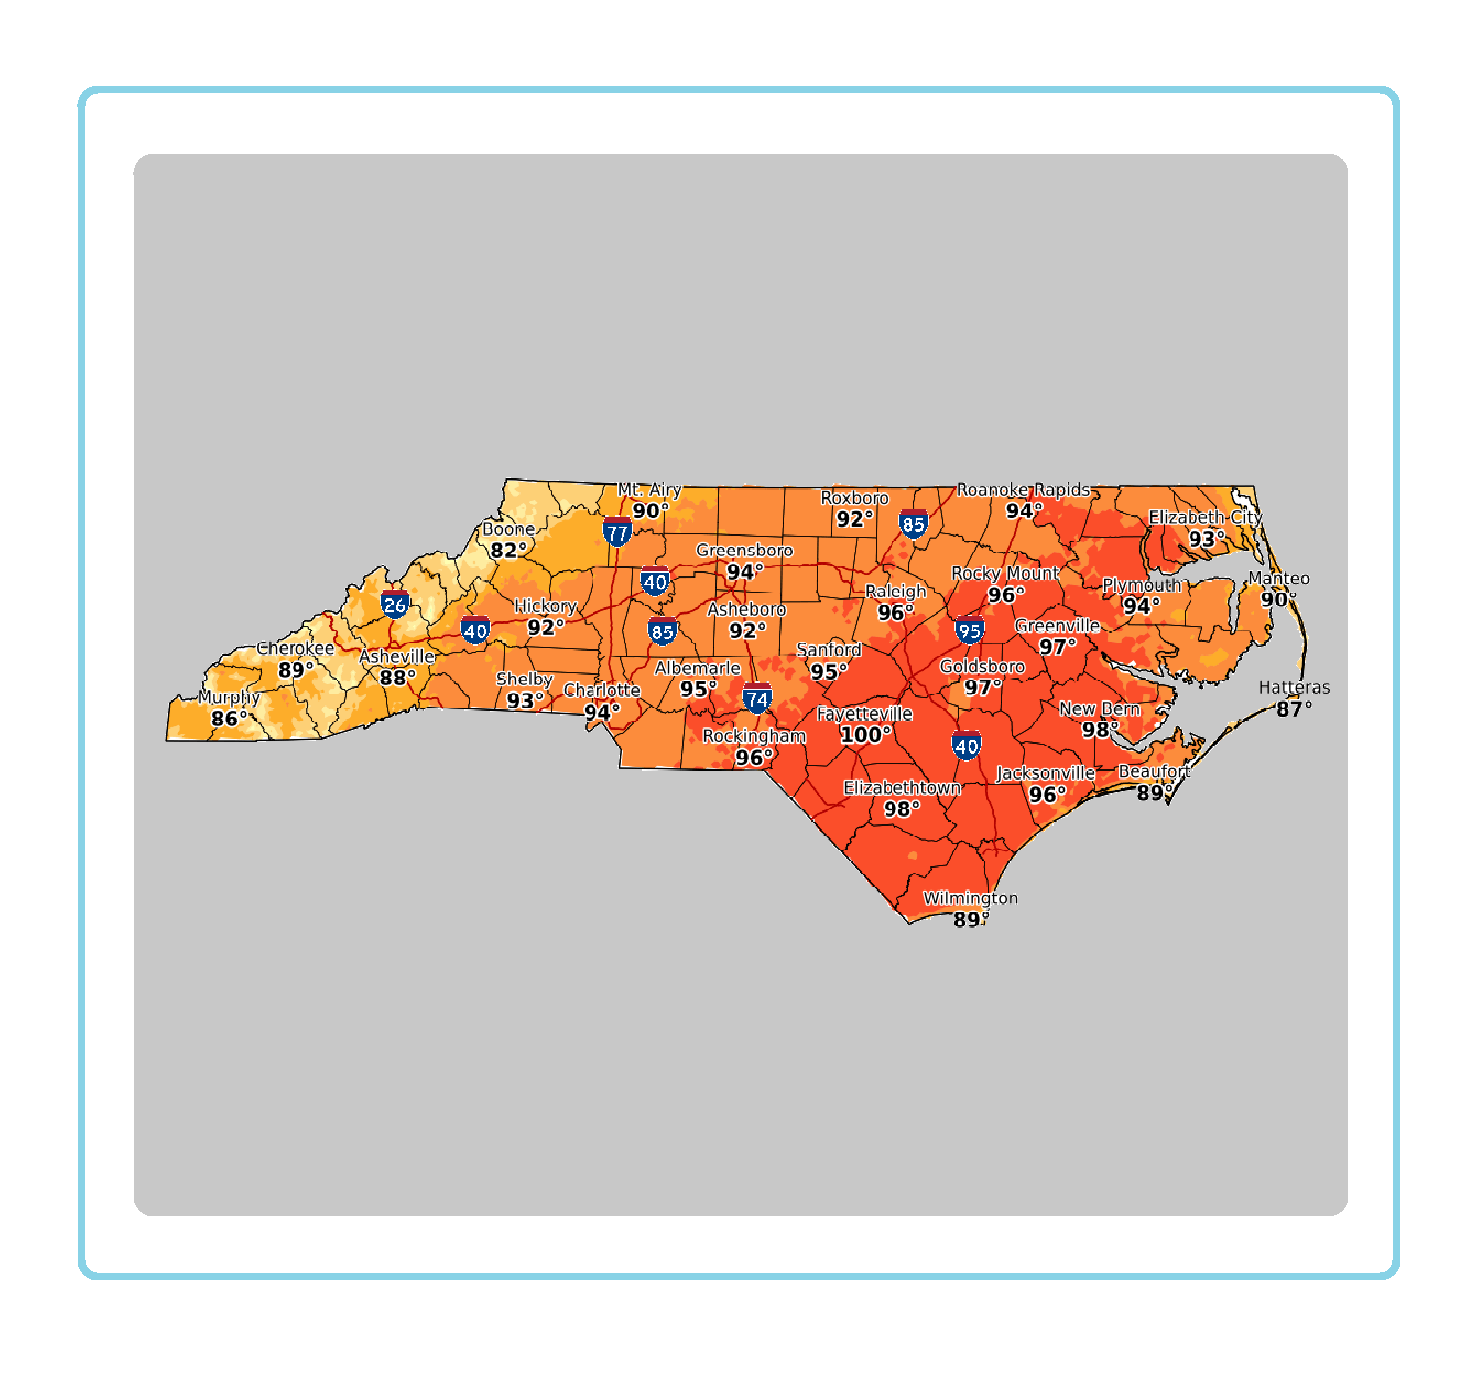 Statewide Maps
 Forecaster Discussion
 Follow us on YouTube