|
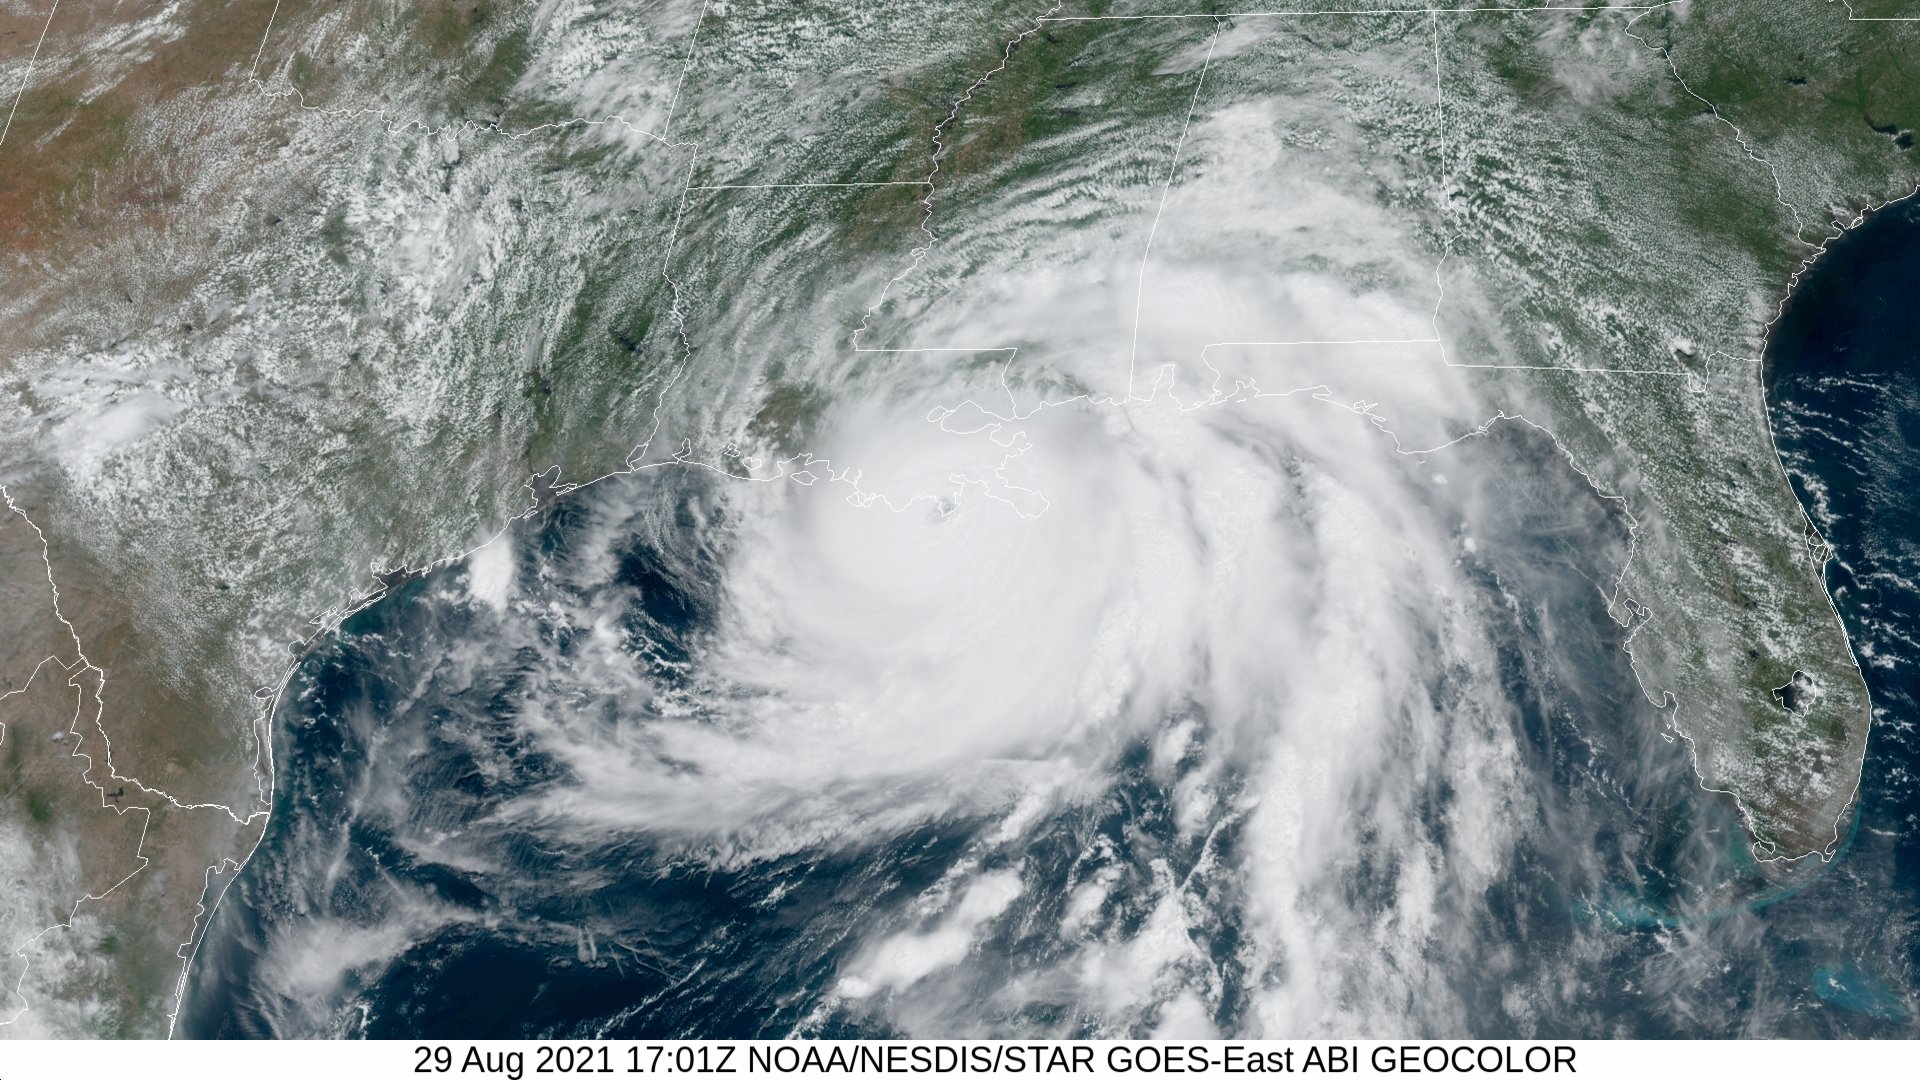
Above: GOES 16 GeoColor Satellite Image of Hurricane Ida at 12:01 PM CDT on August 29, 2021.
On August 23rd, the National Hurricane Center began monitoring a tropical wave across the Eastern Caribbean Sea for future development across the Western Caribbean. By 10 AM CDT August 26th, the disturbance became better organized with a closed surface low, with advisories being initiated on Tropical Depression #9. The depression continued to strengthen, and was named Tropical Storm Ida by 7 PM CDT.
Tropical Storm Ida continued to strengthen, and was upgraded to a hurricane just before crossing the Isle of Youth, Cuba by 1 PM CDT August 27th. Ida made a second landfall in the Cuban province of Pinar Del Rio a little after 6 PM that evening and emerged over the Southeastern Gulf of Mexico 3 hours later.
Once over the Gulf of Mexico, Ida slowly strengthened through 10 AM CDT on August 28th. The first of two rapid intensification periods began later that afternoon when Ida intensified to a category 2 hurricane by 1 PM CDT with winds leveling off to 105 mph (90 knots). Ida’s intensity leveled off through the evening hours.
Ida began the second and more explosive intensification period when reconnaissance aircraft found Ida reaching category 3 hurricane status with maximum sustained winds of 115 mph (100 knots) by 1 AM CDT August 29th, and category 4 status by 2 AM CDT with winds of 130 mph (115 knots). Ida continued to strengthen with maximum sustained winds reaching 140 mph (120 knots) by 4 AM CDT, and 150 mph (130 knots) by 6 AM CDT. Reconnaissance aircraft found that Ida reached a minimum central pressure of 929 millibars (27.43 inches) around 7 AM CDT when the center of the eye was located about 50 miles southwest of the Mouth of the Mississippi River.
With little change in strength, Ida made landfall along the Southeastern Louisiana coast near Port Fourchon around 11:55 AM CDT August 29, 2021 with maximum sustained winds of 150 mph (130 knots) and a minimum central pressure of 931 millibars (27.49 inches), as shown by satellite and radar imagery. Ida made a second landfall just southwest of Galliano around 2:00 PM CDT with maximum sustained winds of 145 mph (125 knots) and a minimum central pressure of 934 millibars (27.58 inches). The 150-mph landfall of Hurricane Ida matches the intensity of Hurricane Laura across Southwest Louisiana on August 27, 2020, and the re-analyzed Last Island hurricane of August 10, 1856.
Ida only slowly weakened for the remainder of the afternoon and evening, still a category 3 hurricane with maximum sustained winds of 115 mph (100 knots) at 8 PM CDT by the time the eye crossed I-10 near Reserve & LaPlace, LA. Continued weakening occurred thereafter, with Ida still a category 1 hurricane with maximum sustained winds of 85 mph (75 knots) by the time it crossed I-12 near Holden, LA around 11 PM CDT. It is estimated Ida weakened to a tropical storm by the time it crossed into Southern Mississippi by 4 AM CDT August 30th, and weakened to a tropical depression just north of Jackson, MS by 4 PM CDT.
The damage from wind and storm surge was catastrophic over Southeast Louisiana, especially over Terrebonne and Lafourche Parishes. Major wind impacts occurred over the remainder of Southeast Louisiana into Southern Mississippi. For a complete summary of all the effects of Ida east of the Atchafalaya River, see the Post Tropical Cyclone Report issued by the National Weather Service Slidell, LA.
WINDS & PRESSURE:
Across our region west of the Atchafalaya River, the wind effects were less than initially expected. However, it was very close, as surface observations showed the hurricane force wind gusts missed St. Mary, Iberia, and St. Martin Parishes by only 15-20 miles to the east. The eastern portions of these parishes south into the coastal waters experienced sustained moderate tropical storm force winds with higher gusts. The highest gusts recorded across our region were 63 mph (55 knots) at Eugene Island (near the mouth of the Atchafalaya River) and 54 mph (47 knots) at Berwick, LA between 4 & 5 PM CDT August 29th. This caused scattered downed trees and powerlines, with power outages lasting less than 2 days for most of these locations.
STORM SURGE:
Storm surge was minimized by the predominate northerly winds, reaching between 1.5 and 2.0 feet Mean Higher High Water (MHHW) along coastal Vermilion, Iberia, and St. Mary Parishes. With the main core and rain-shield just east of the Atchafalaya river, rainfall of one half to one inch was recorded over Central and South-Central Louisiana.
RAINFALL:
With most of the circulation of Ida from the Atchafalaya river eastward, rainfall of one inch or less occurred over South Central and Central Louisiana.
For a complete summary of all the effects of Ida west of the Atchafalaya River, see the Post Tropical Cyclone Report issued by the National Weather Service Lake Charles, LA.
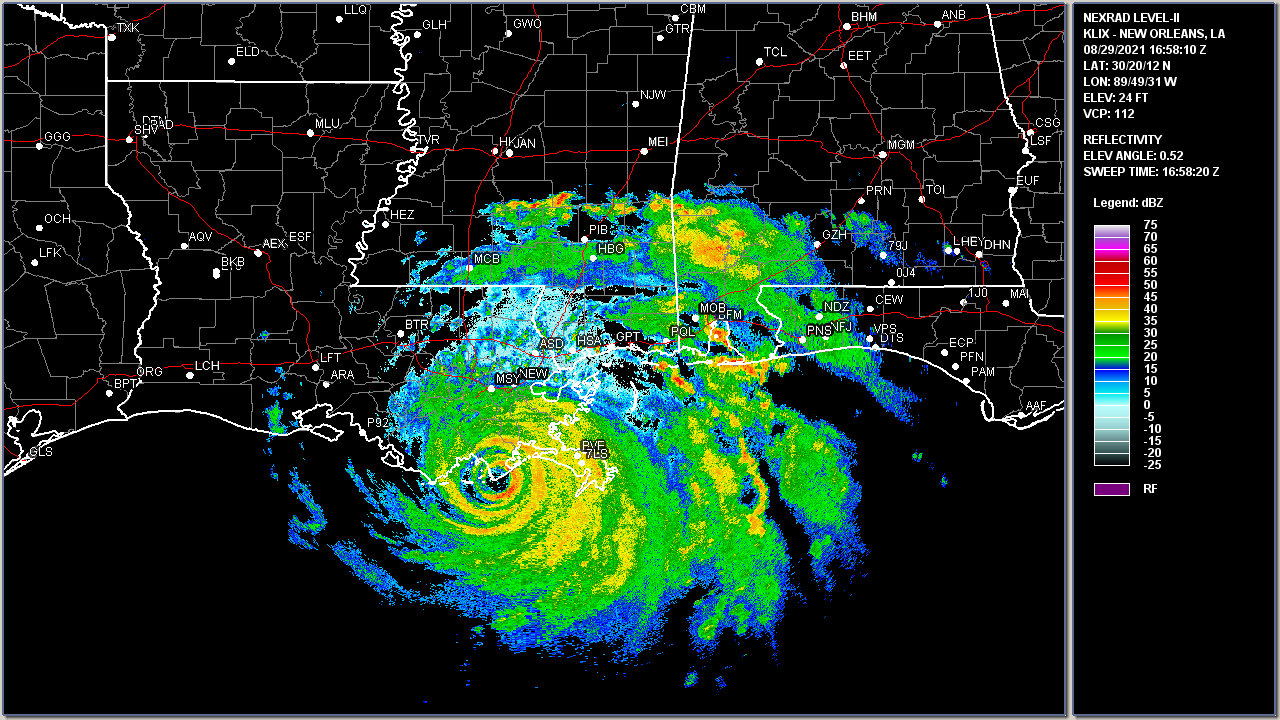
Above: New Orleans, LA WSR-88D radar image of Hurricane Ida at 11:58 AM CDT on August 29, 2021.
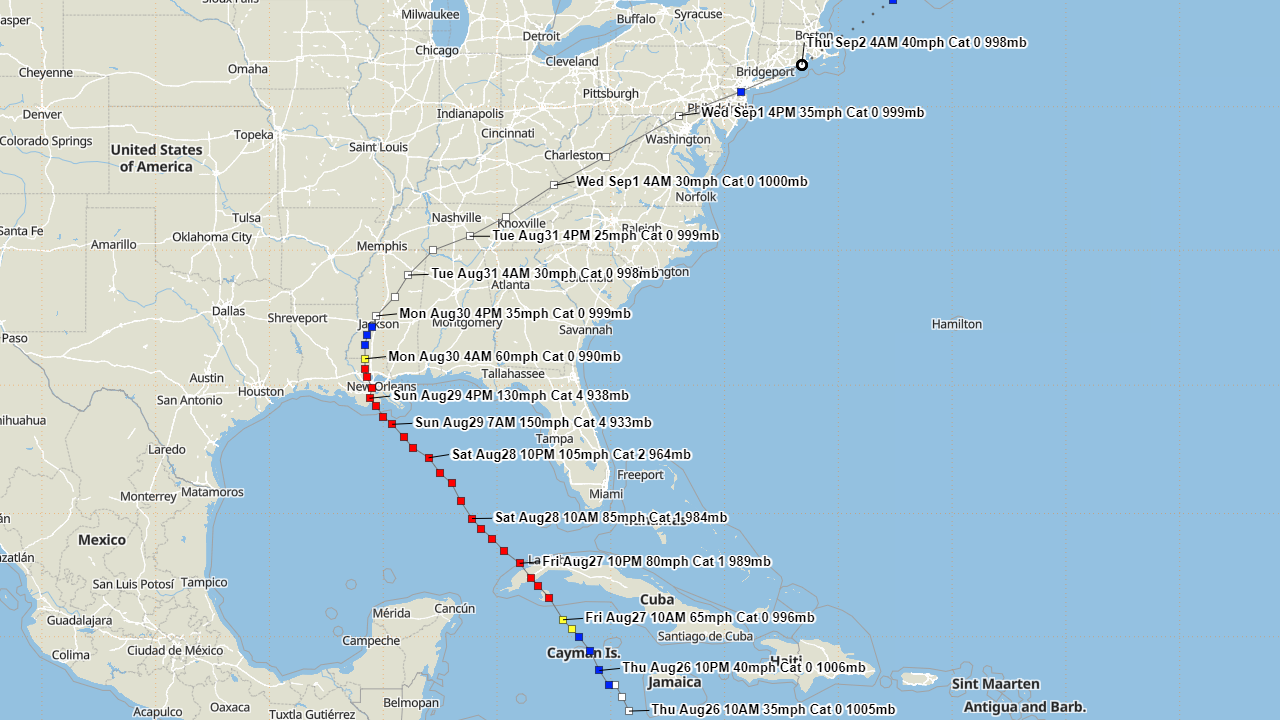
Above: Hurrevac tracks of Hurricane Ida from operational National Hurricane Center public advisories.
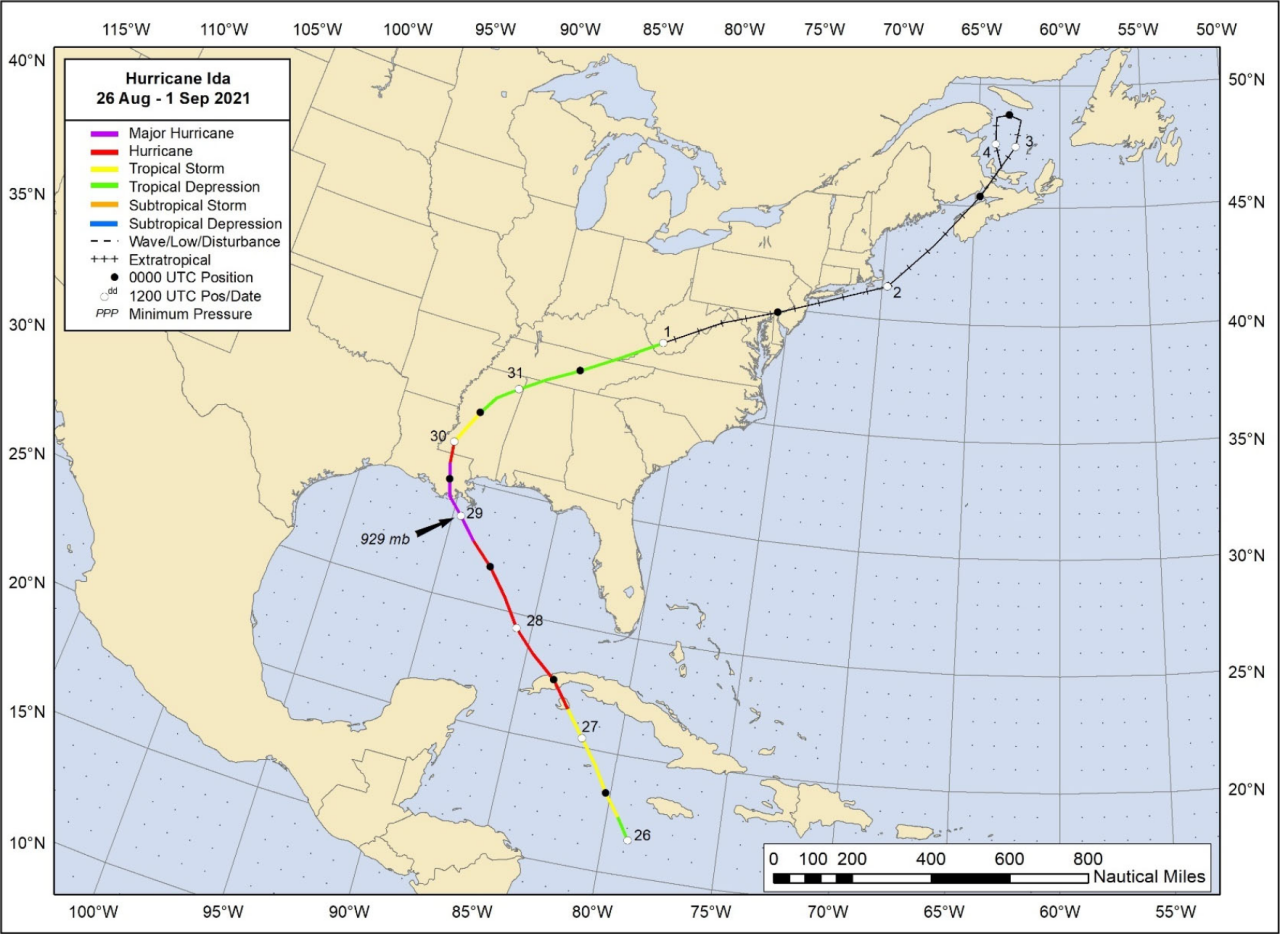
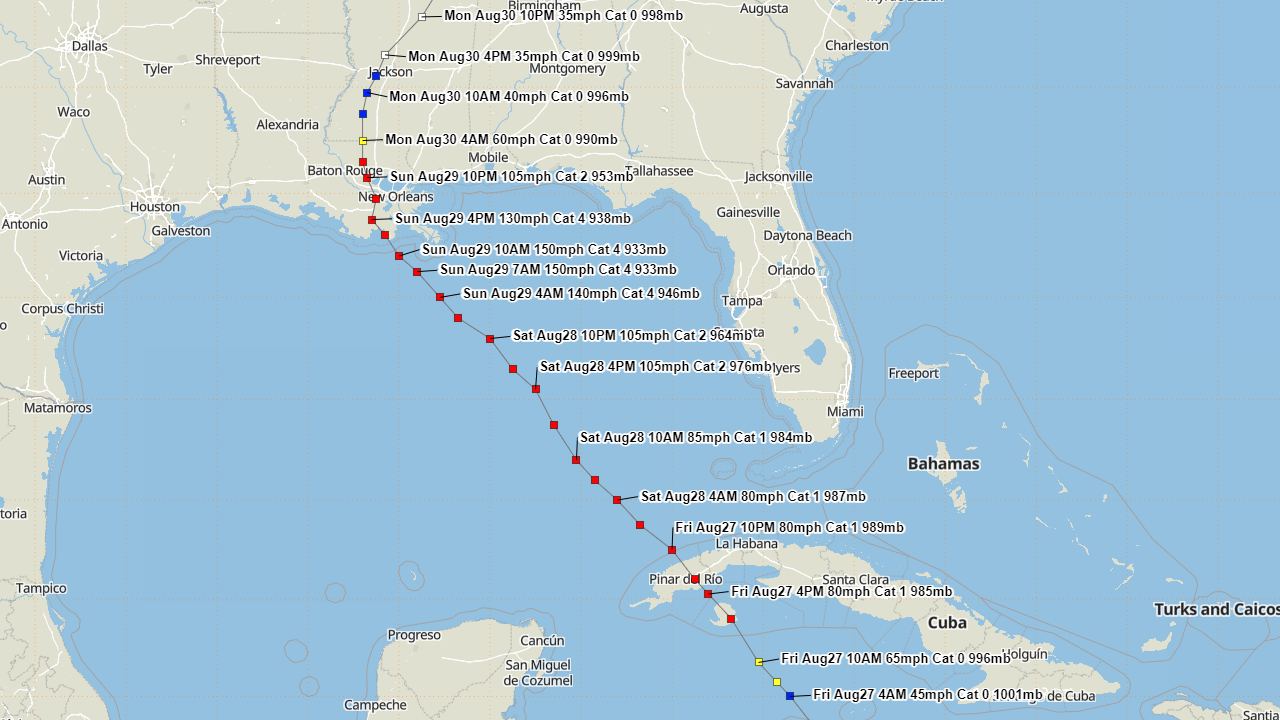
Above: National Hurricane Center best track of Hurricane Ida.
Listed below are post-storm reports and meteorological data gathered. All data is considered preliminary, and is subject to change at any time. Additional information will continue to be added to this page in the future.
Webpage design by: Donovan Landreneau
Content by: NWS Lake Charles staff, other sources as noted above.
|


 Follow us on YouTube