|
|
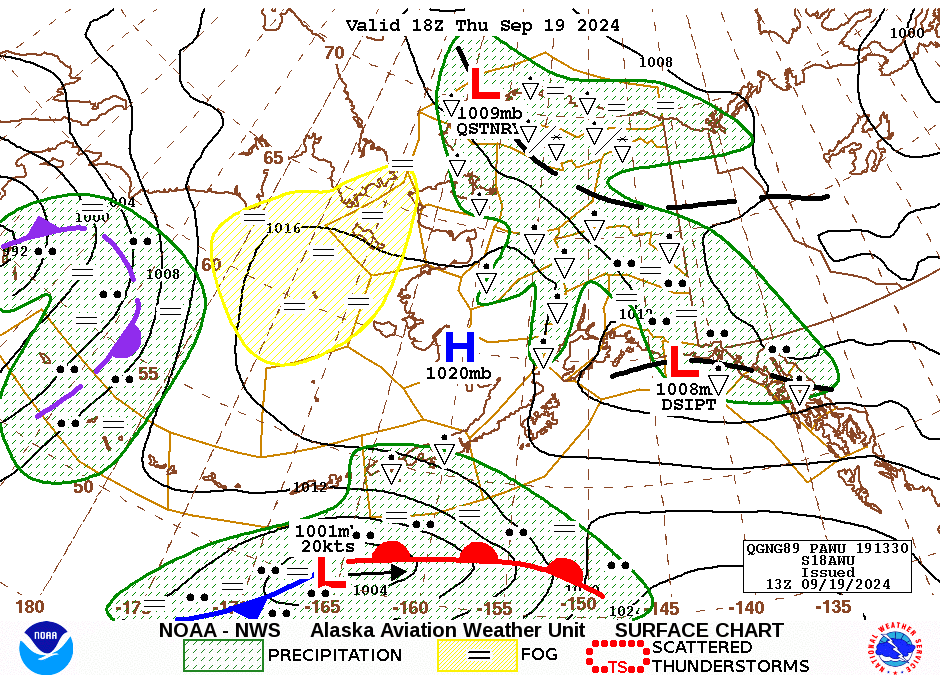
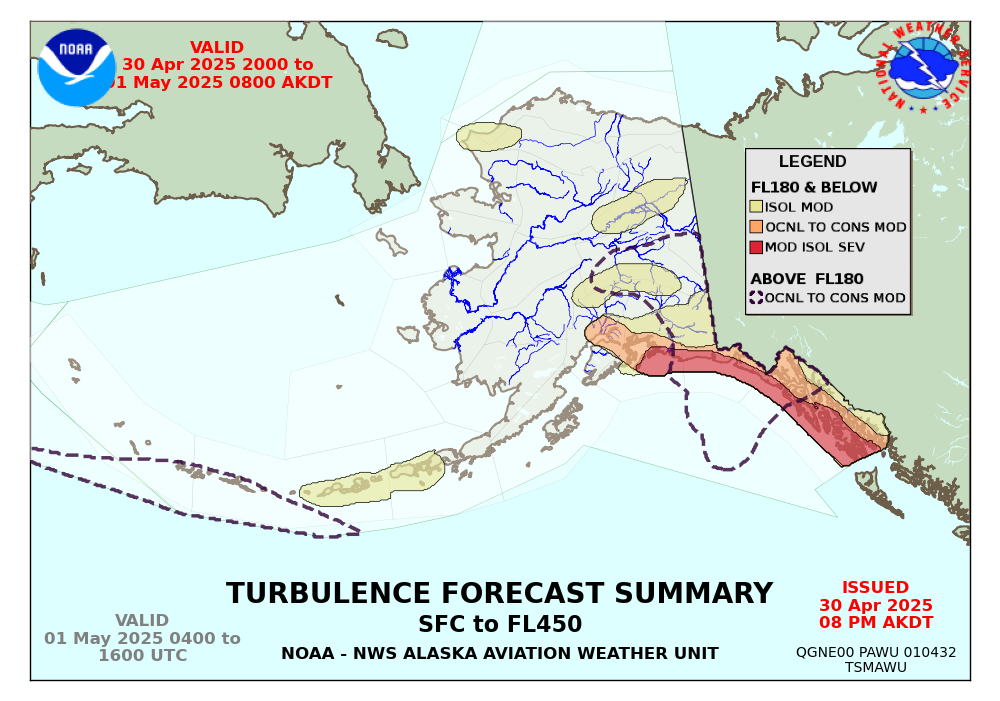
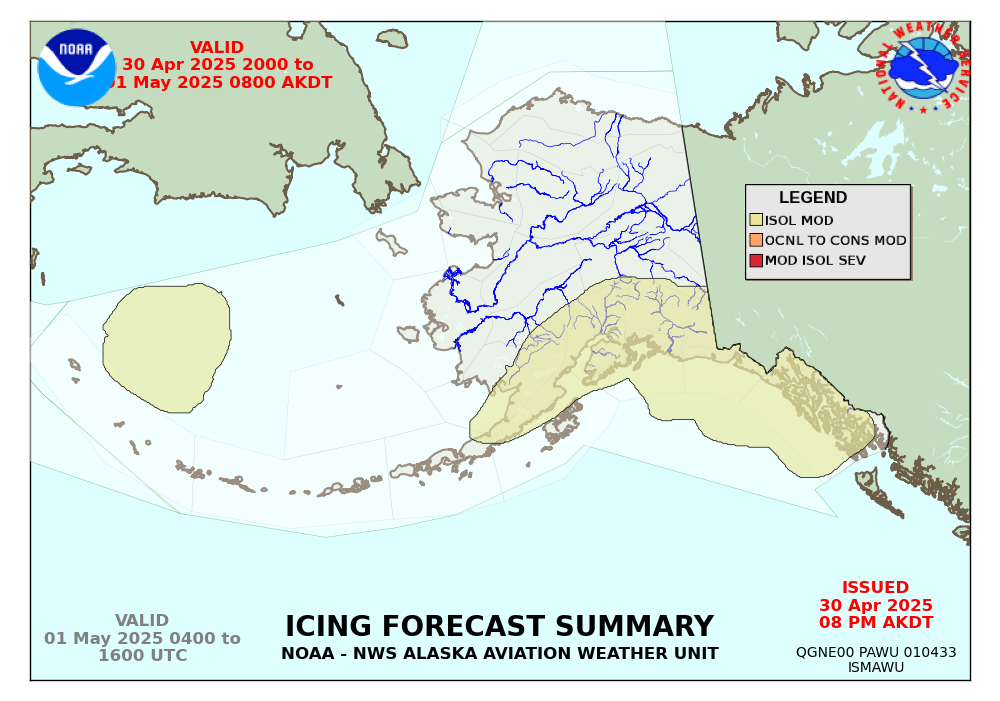
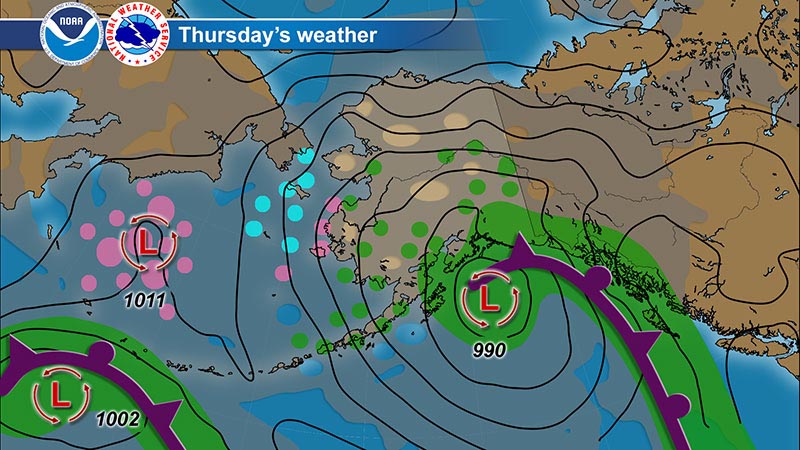
Area Forecast and AIRMET reference maps
|
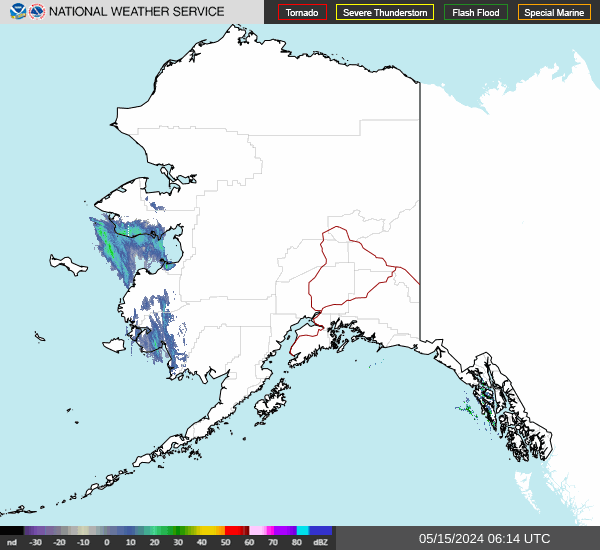
Alaska Mosaic Radar Loop
|
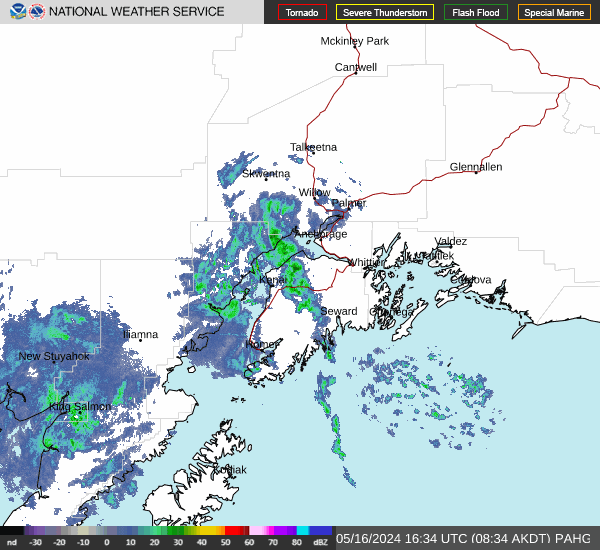
Kenai Radar Loop
|
|
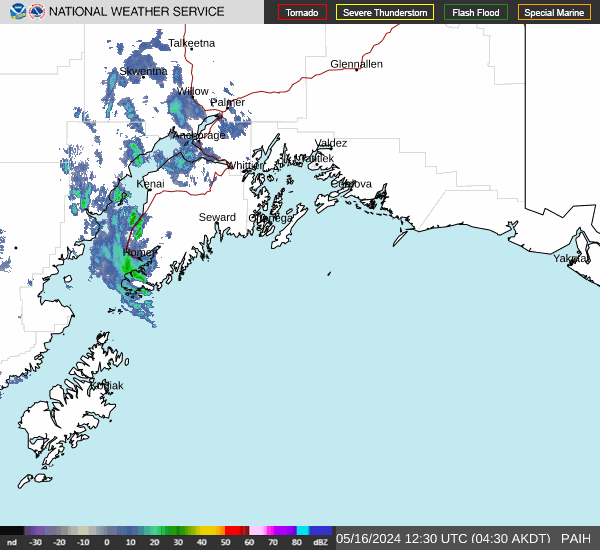
Middleton Radar Loop
|
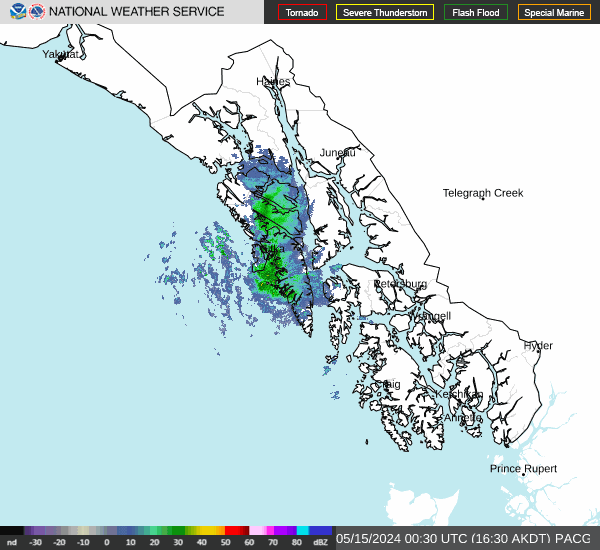
Sitka Radar Loop
|
|
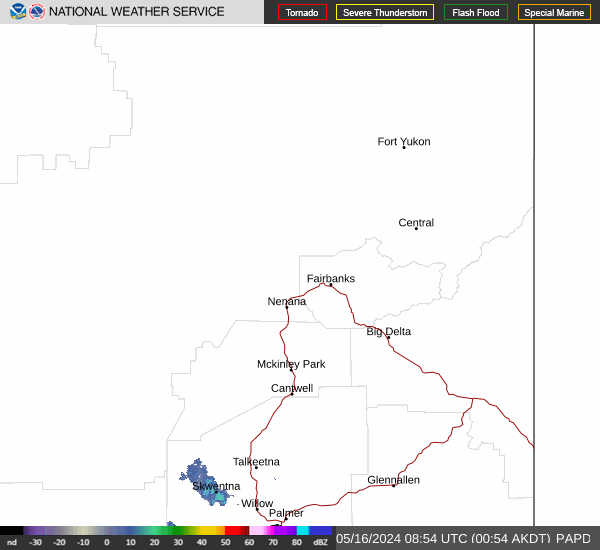
Fairbanks Radar Loop
|
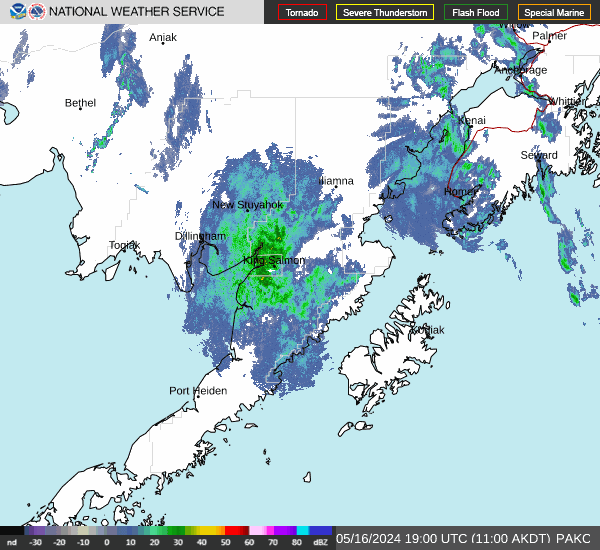
King Salmon Radar Loop
|
|
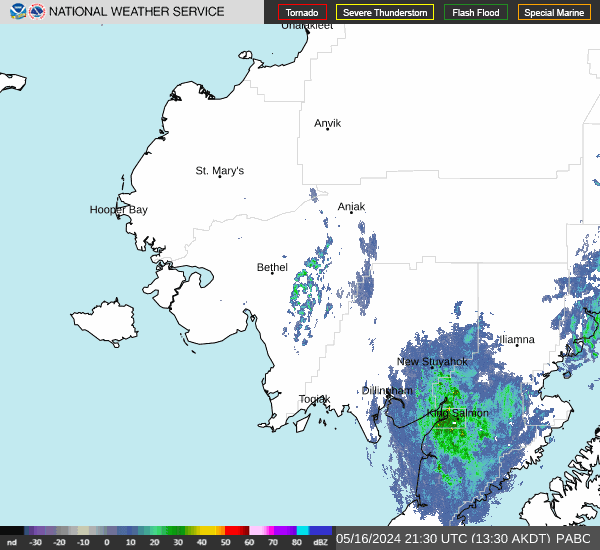
Bethel Radar Loop
|
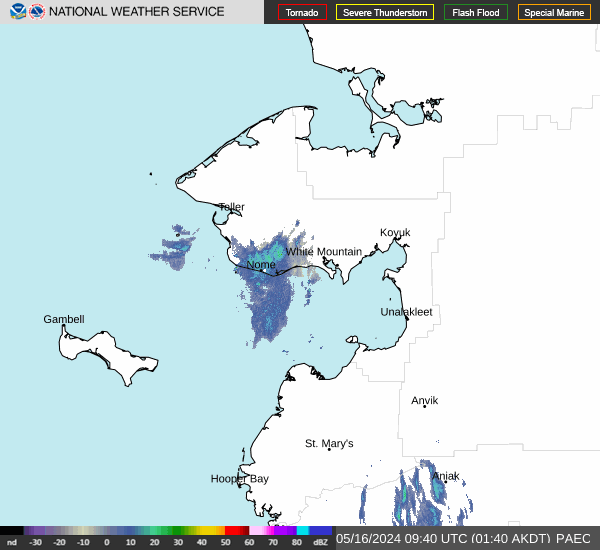
Nome Radar Loop
|

Additional satellite data is available from the NOAA GOES Image Viewer

additional information on our updated Significant weather charts
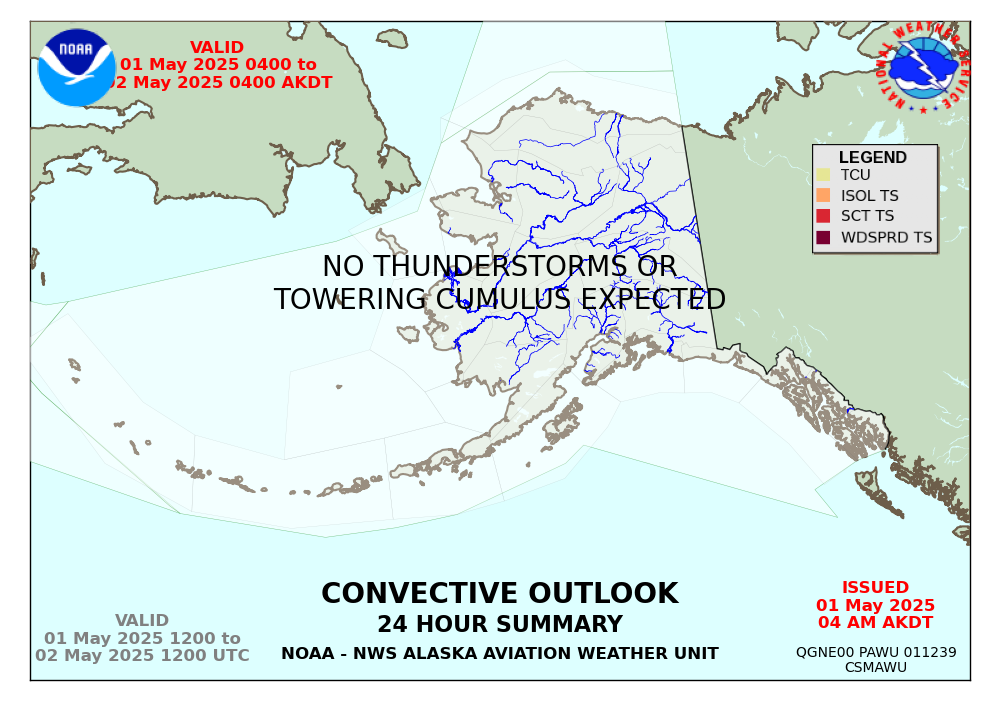
Convective Outlook
Graphical Forecasts for Aviation (GFA) Convection


 Multimedia Program
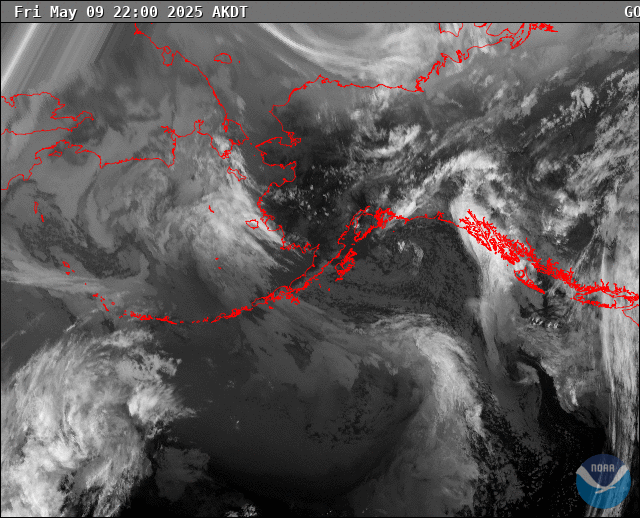 Satellite
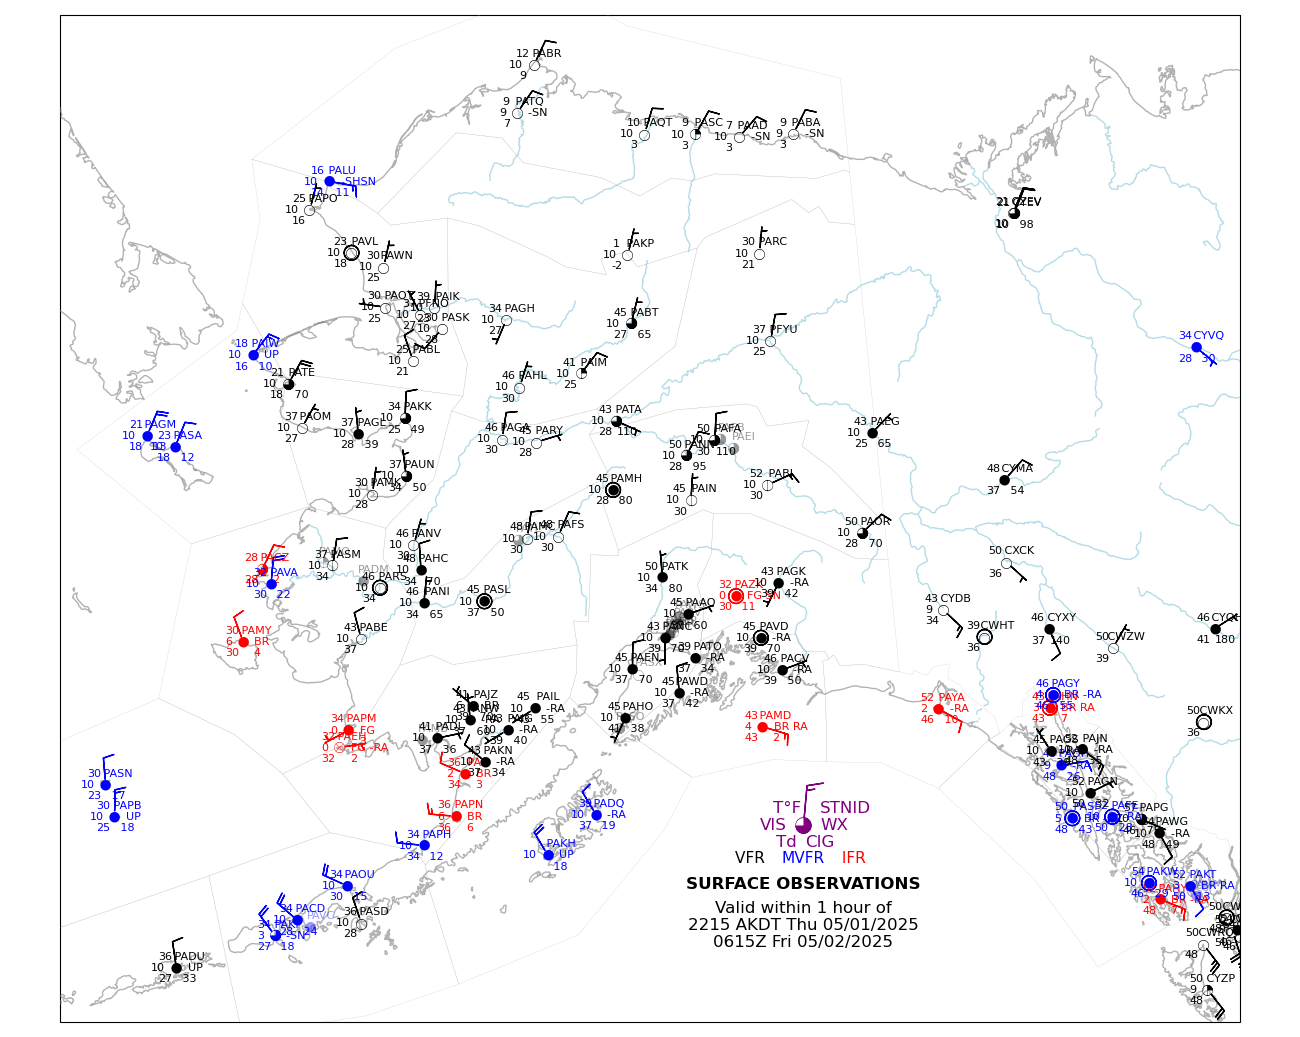 METAR graphics
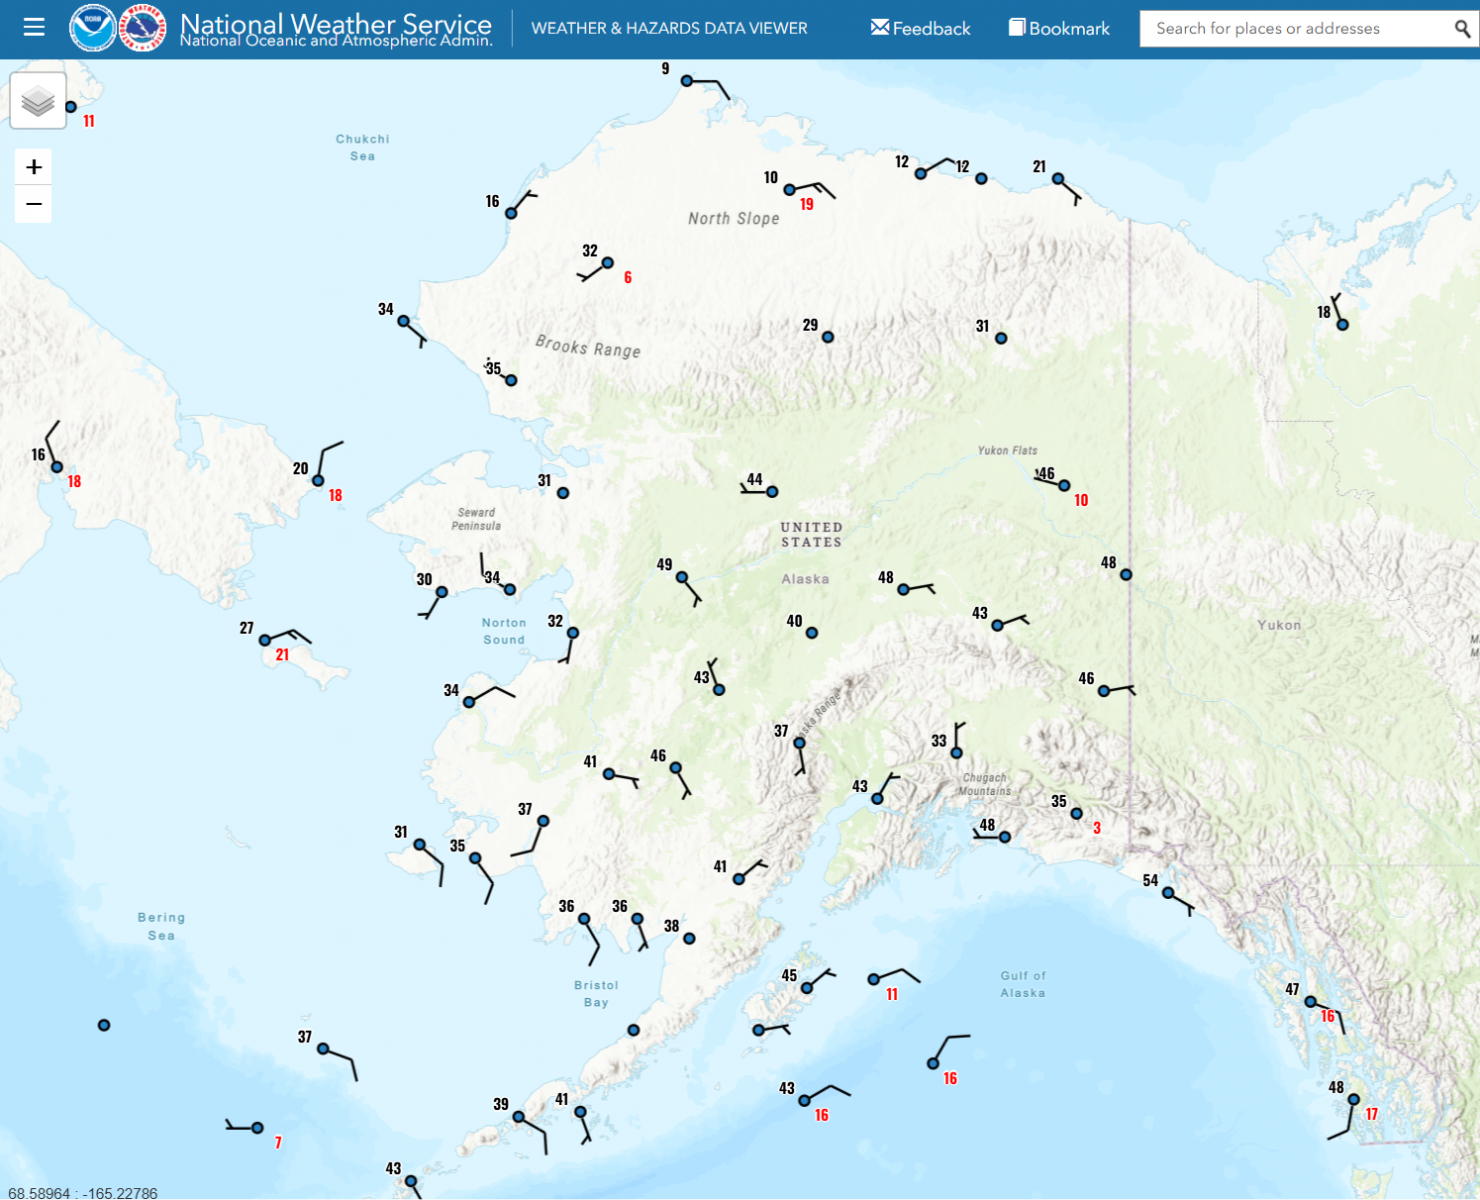 Advisory Weather & 5 min observations
 FAA WeatherCams
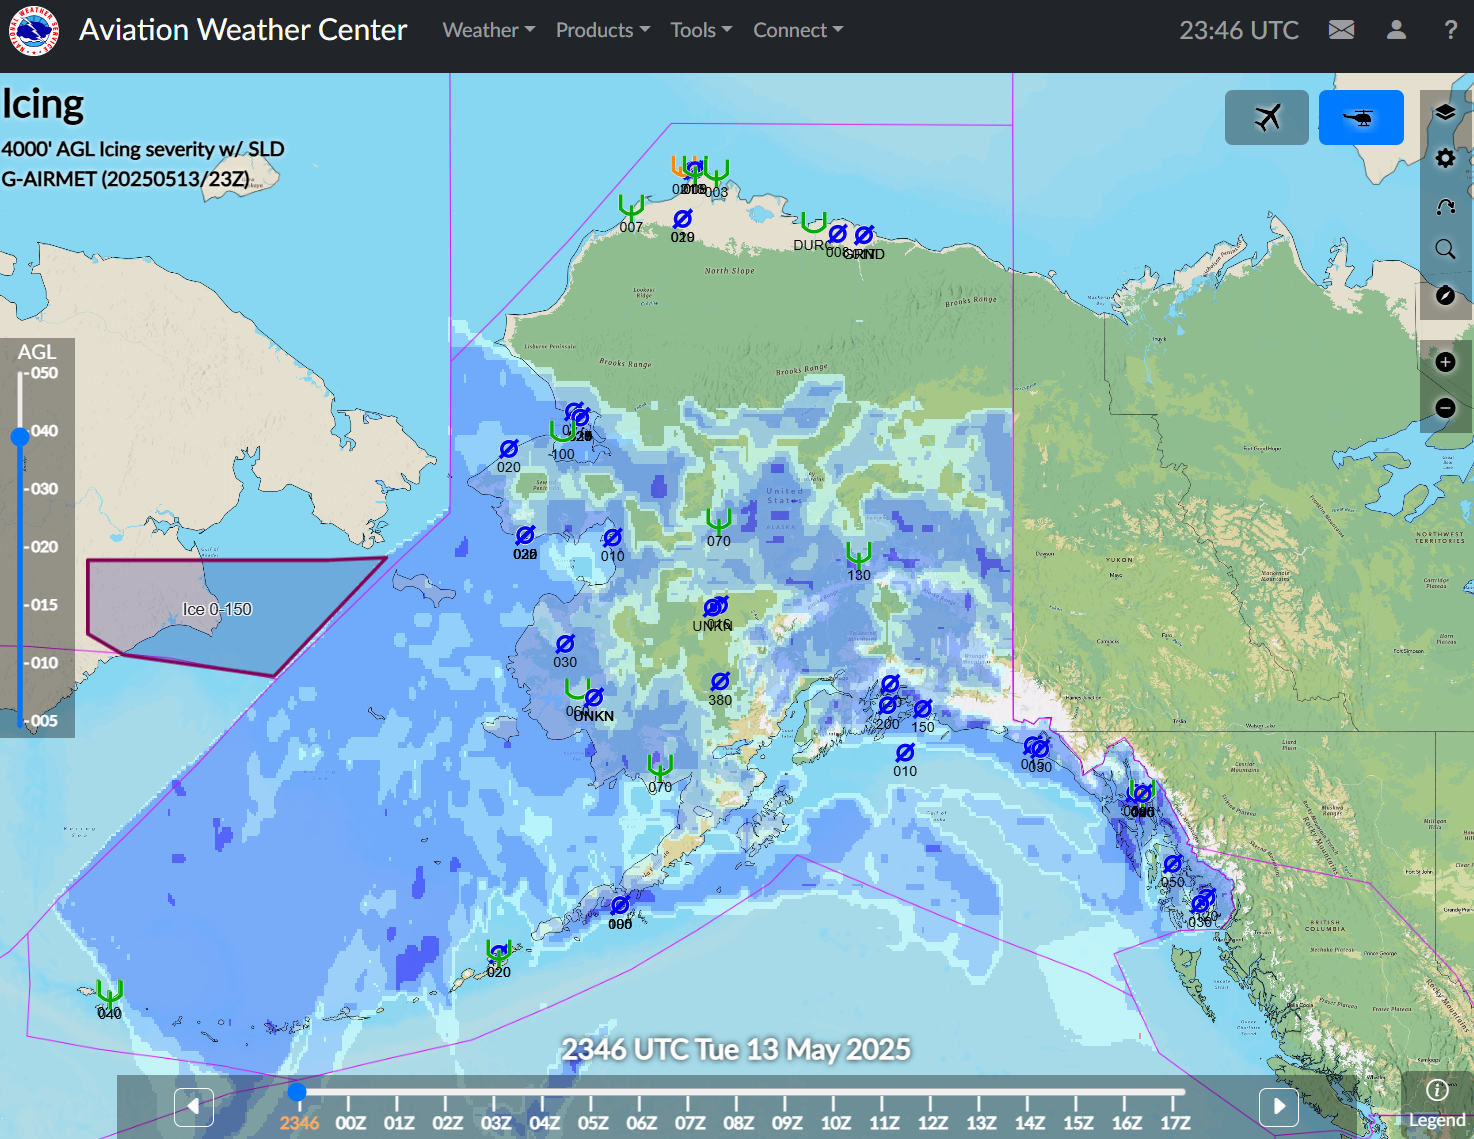 Graphical Forecasts for Aviation (GFA)
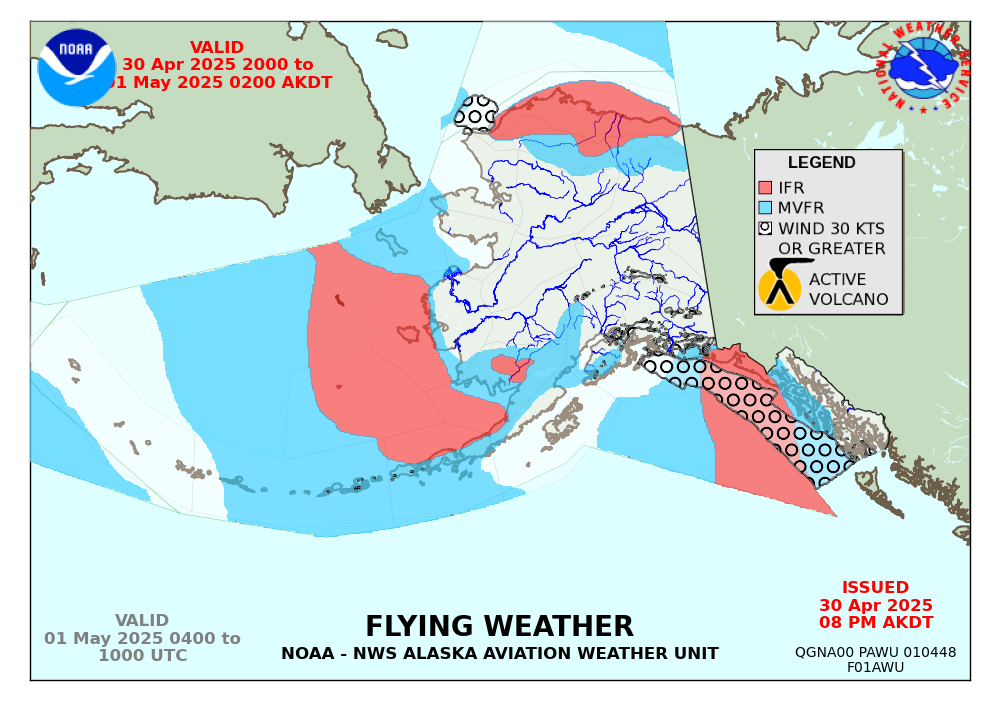 Graphical Forecasts
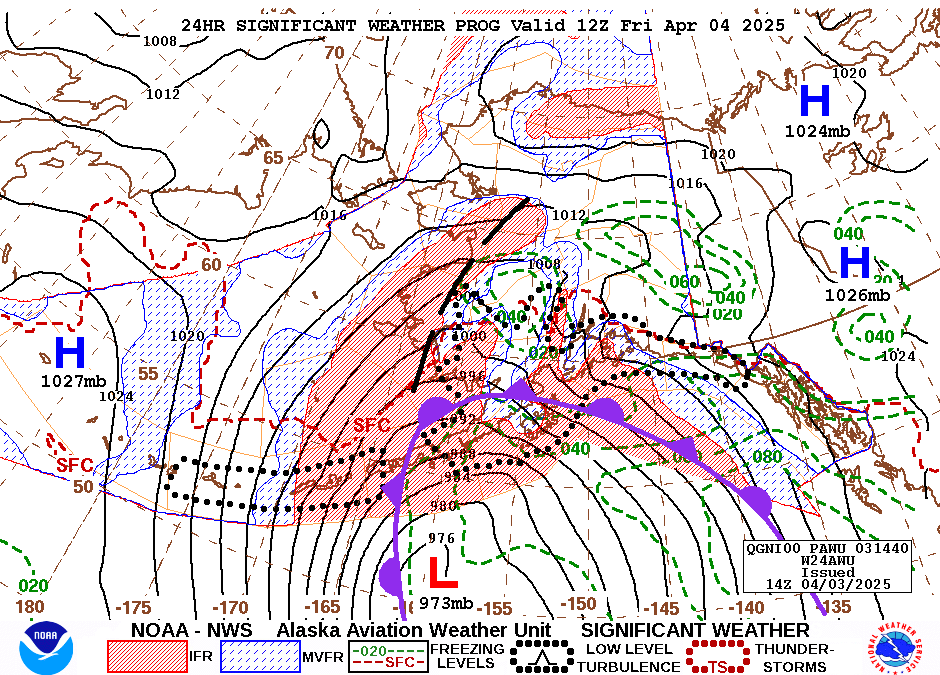 Significant Weather Charts
 Convective Weather
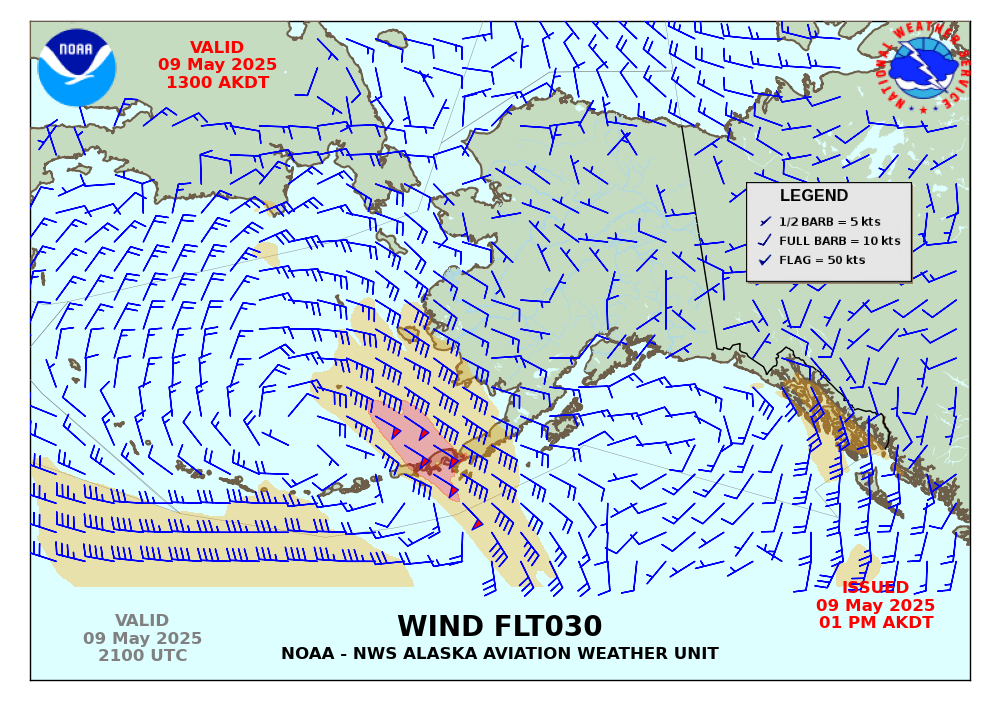 Winds Aloft
 Alaska Aviation Guidance (AAG)