National Weather Service United States Department of Commerce

The AAWU is changing systems within our operations and we need to move and modernize these plots. We are trying to keep many aspects the same as to not change this service, but we are using different software and have the ability to make improvements, such as more charts and decisions about which obs to plot when two or more overlap spatially. If you have comments or suggestions about these, let us know by emailing our web author. The legacy charts are still being made and published above these new charts, but will be discontinued on August 14, 2025.

Alaska | Southeast | North Gulf | Southcentral | Southwest | Western | Central | Northern
Northeast | Northwest | Panhandle | Aleutians | Anc Bowl | Kenai | Y-K Delta | Tanana

Missing Surface Obs Charts

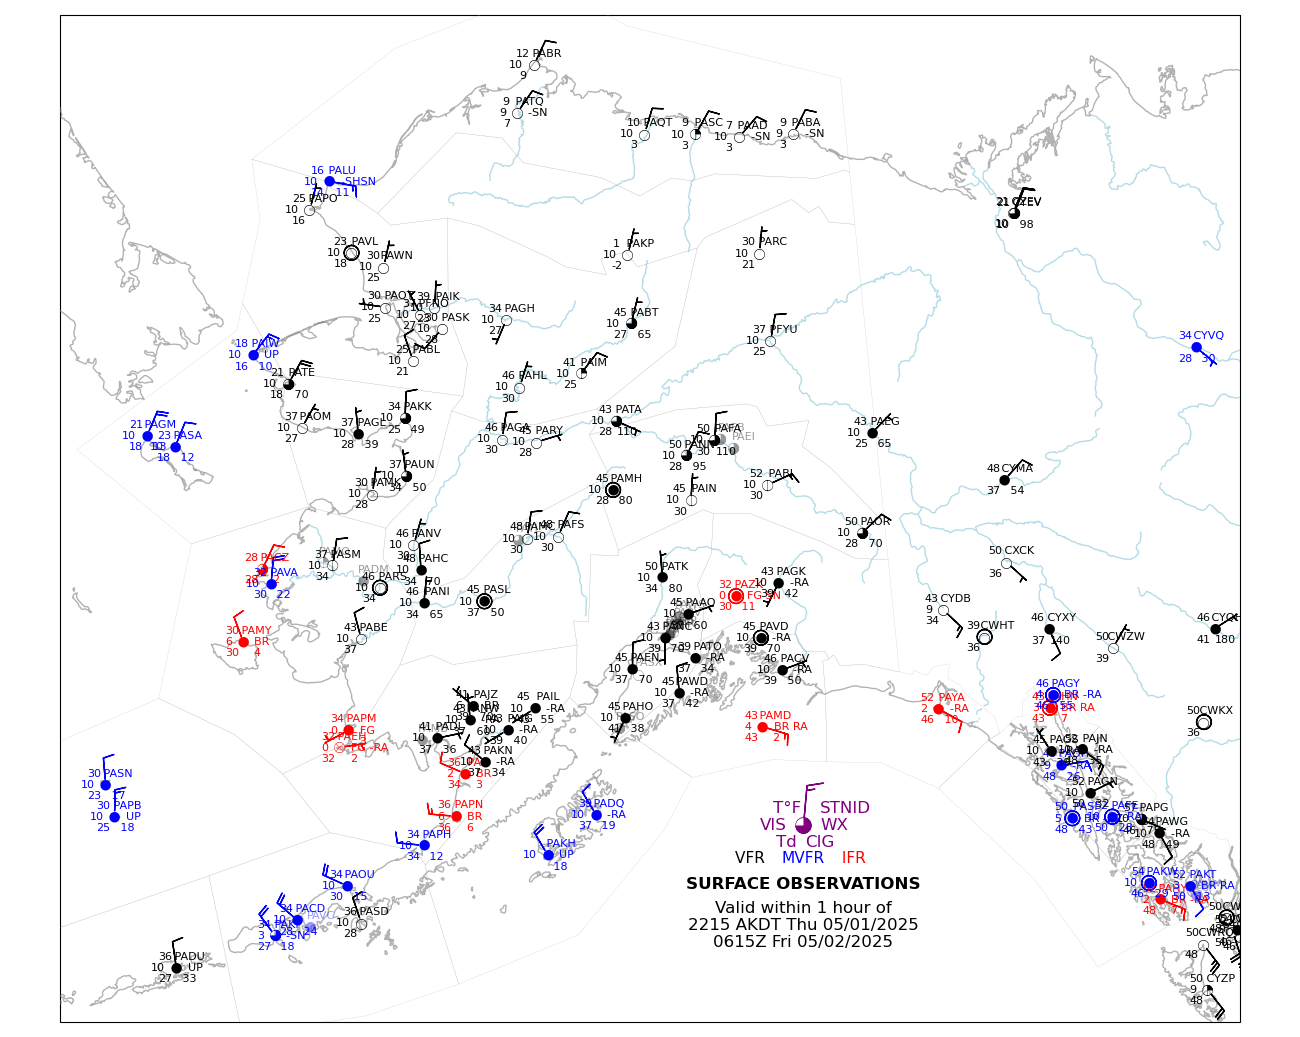
Charts are produced at 15 and 45 minutes after the hour.


Additional observation maps are available on a high resolution interactive map at Graphical Forecasts for Aviation.


Starting on or after August 14, 2025, the hourly observation charts below will be upgraded to the hourly observation charts above.

For more information on this upgrade, please visit "https://www.weather.gov/media/notification/pdf_2025/scn24-52_winds_aloft_hourly_graphic_update.pdf.


Alaska | Southeast | North Gulf | SouthCentral | SouthWest | Western | Central | Northern Surface Obs