
Severe thunderstorms are expected across portions of the Southeast and Carolinas today where a Slight Risk (Level 2 of 5) has been issued. A Slight Risk Excessive Rainfall Outlook (Level 2 of 4) has been issued for part of the northern Gulf Coast today due to the threat of flash, urban, and riverine flooding. Read More >
|
|
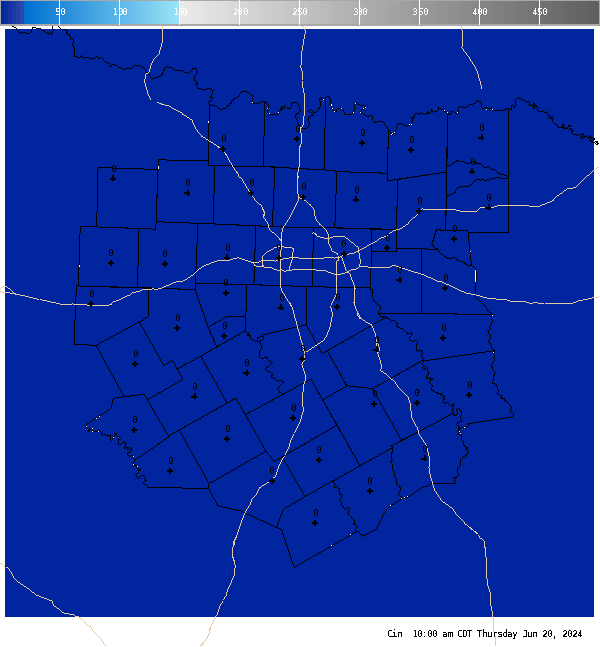
4 Panel Display | Animated Loop CIN The image is a surface based measurement of Convective INhibition (CIN) or what is sometimes more commonly referred to as the strength of the cap. The value is capped off at 500 J/KG. In cases where there is no surface based CAPE available this parameter is set to 500 J/KG. The yellow contours are the Lid Strength Index (LSI). This is another measure of how strong the cap is. It shows the thermal difference between a lifted surface parcel and the warmest part of the cap. Higher values indicate a more stable layer. In general, the Cap is said to be breakable when CIN is 30 J/Kg or less and/or the LSI is 2 degrees or less. A negative LSI is rare, but is indicative of freely buoyant low level instability. |


 Follow us on YouTube