
Drought, Freeze, and Fuel Curing (Grasses and Brush) as of early January, 2011. All cooling fronts since late October came through with little or no rain; as of January 9th, there had been at least 13 such fronts. Deep South Texas was in Moderate to Severe Drought. |

Potential weather evolution for Deep South Texas, February and March 2011. Winds will be very noticeable; warm to hot temperatures will develop ahead of each front in the Mid and Upper Valley. The track of low pressure systems will be well north of the area, and much faster, than during the 2009/2010 late winter/early spring period. |
|
October through December 2010: Driest Ever?
As the image at top left shows, and an article written in late October attested, potentially unprecedented dry weather invaded Deep South Texas just before the end of September, and in many areas, it has not rained since. The highly anticipated dry and mild autumn and early winter, courtesy of a moderate to strong La Niña, coupled with a persistent negative phase of the atmospheric teleconnection known as the Arctic Oscillation, has eliminated all significant rainfall to much of South Texas, and nearly all of Deep South Texas. In late December 2009, the Arctic Oscillation was also strongly negative; however, when coupled with the El Niño warming of the eastern equatorial tropical Pacific Ocean, periodic rains fell in Deep South Texas. The absence of the subtropical jet explains the lack of significant rainfall; the negative phased Arctic Oscillation is a possible contributor to the frequency of cold fronts, which have brought very low humidity and a few mornings of subfreezing temperatures thus far in late 2010.
Little or no rain fell through the end of December, making the three month period starting October 1st the driest since records have been kept in most locations across Deep South Texas. The following table tells the tale.
Preliminary Driest October to December Periods (2010 through 12/28, 4 PM)
| Location (start year) |
Oct-Dec 2010 Rain |
Current Rank |
Previous Record |
Year |
|
Brownsville (1878)
|
0.14
|
1
|
0.50
|
1894
|
|
Harlingen/Coop (1911)
|
0.05
|
1
|
0.36
|
1939
|
|
McAllen/Coop (1941)
|
0*
|
1*
|
0.70
|
2004
|
|
McAllen/Miller (1961)
|
0.11
|
1
|
1.03
|
1961
|
|
Weslaco (1914)
|
0.08*
|
1*
|
0.28
|
1917
|
|
Falcon Dam (1962)
|
0.04
|
1
|
0.51
|
1966
|
|
Falfurrias (1907)
|
0.12*
|
1*
|
0.48
|
1950
|
|
Hebbronville (1905)
|
0.20
|
1
|
0.61**
|
1950
|
|
Port Mansfield (1958)
|
0.03*
|
1
|
0.99
|
1999
|
|
Raymondville (1910)
|
0.23
|
2
|
0.16
|
1917
|
|
Rio Grande City (1892)
|
0.74
|
6
|
0.36**
|
1950
|
*Several missing days, including some around time of light rainfall.
**At least 10 missing years of record.
|
|
End of Year and early 2011 Information
- Severe Drought covered much of the Mid and Upper Valley and Brush Country, including all of Hidalgo County. Moderate Drought covered the remainder of Deep South Texas.
- Six minor freezes have occurred in rural locations of the mid and upper Valley to the Brush Country: November 27th; December 1st, 9th, 13th, and December 26th and 27th.
- Dozens of generally small wildfires, mainly grass and brush, have occurred in December and early January.
- One wildfire grew quickly out of control during the afternoon of December 1st on the Burns Ranch, near the corner of Hidalgo, Starr, and Brooks County (near/along FM 755). The fire grew to between 1800 and 2000 acres before containment. Another fire grew to more than 7,000 acres on the King Ranch on January 2nd.
- Dry cold fronts – those with little or no rainfall along them and quickly followed by very low humidity, have been common since November. These include: November 2nd, November 18th, November 26th, November 30th, December 11th, December 25th, very early on New Year’s Day, and January 9th.
- Four consecutive afternoons with relative humidity near or below 15 percent occurred in the mid and upper Valley (December 10th-13th)
- Current long range forecast data suggest no change to the "Main Points" listed below...
- But there may be some very temporary relief in the form of clouds, humidity, and some rain through mid January.
Main Points
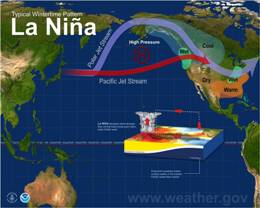
- Moderate to Strong La Niña is underway (below).
- Historical trends strongly suggest low to very low area wide rains through February, persistent winds, and occasional to frequent drying fronts. Click here for charts showing rainfall differences between La Niña and average.
- Deep soil moisture from persistent rains for the first 9 months of 2010 is no longer helping fine to medium fuels (1 and 10 hour fuels) which are largely cured.
- Most fronts in winter 2009/2010 were "wet" – featuring a day or more of drizzle and chilly temperatures after passage, or developing low pressure along the Lower Texas Gulf coast and heavier rains inland
- Additional fronts this winter should be dry, but one or two may have some rain on one of both sides of them, especially in January and early February.
- Fire Danger will continue to worsen through early spring. Abundant rangeland and plant growth in 2010 (fuel loading) has cured (fuel drying).
- Will there be a killing freeze? The two killing freezes in the 1980s (December 1983 and 1989) both occurred in neutral/La Niña leaning situations. The past two similar La Niña winters (1988/89 and 1999/2000) had no widespread killing freezes, but one notable cold snap occurred in early February, 1989.
Statistical Correction of the Climate Forecast System Forecast for the Niño 3.4 Sea Surface Temperature Anomalies in the eastern equatorial Pacific. Six consecutive months of values above +0.4 signify El Niño; six consecutive months of values below -0.4 signify La Niña. |
Preparing/Decision Making
While predicting specific weather events such as cold fronts, severe weather outbreaks, rain, and windstorms more than a week or two out is beyond the scope of sound science, the high confidence in a complete turnabout from a verdant Rio Grande Valley to a rain–starved region within the next six months provides persons tasked with agricultural and rangeland responsibilities the opportunity to prepare now for the coming change. Today is a good time to revisit plans to move people and equipment efficiently to wildland or urban/wildland interface fires. Growers and ranchers should plan now for irrigation efficiency and water conservation that may well become reality next February through April or May. As always, continue to monitor information on this web site through the remainder of winter into spring 2011, including "Droughtlooks", rangeland fire danger statements, Fire Weather Watches and Warnings, and Wind Advisories or Warnings. Weather Decision Support is part of our mission, and we’re here to help, 24 hours a day, 365 days a year.

Box and whisker chart of December through February precipitation distribution for climate division 63, Deep South Texas, El Niño, Neutral, and La Niña. Lines at either end of each ’whisker’ represent the 10th and 90th percentile; the box represents the 33rd through 67th percentile, with the red line the 50% level. For full details, click here for much more.

Photos of cured grass and brush in La Salle and Refugio County, Texas. Similar conditions have been observed across the ranchland and brush country of Deep South Texas. |


 Follow us on YouTube