
Evolution of a Central Gulf Coast Heavy Snowband
December 18, 1996
INTRODUCTION
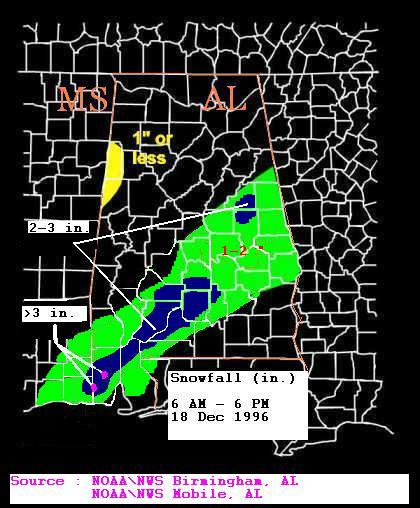
Although there was not a White Christmas that year, a blanket of wet heavy snow fell just days prior over portions of coastal Mississippi and southwest Alabama. This snow was part of a larger swath which extended from southeast Mississippi into east Alabama. The graphic below shows a composite of total snowfall across the region. The graphic shows a general 1-2 inches of wet snow fell over most locations within the snow swath with isolated snowfall totals as high as 3-4 inches. Note the isolated heavy snowfall over both Jackson County in Mississippi and Mobile County in Alabama. By definition, in most locations around the US (excluding mountainous regions and the Great Lakes) receiving 4 inches of snowfall in 12 hours, qualifies as heavy snow. With a return period of 1 event in 13 years (Branick, 1996), this heavy snow event was indeed a rarity for Deep South residents.
Visible satellite imagery shows the areal extent of the event snowfall (lighter white) around 1015am the next morning, before significant melting began. The area between the thin black lines represents snow on the ground. We can see the snow because it is highly reflective. The clouds are represented by the brighter white elements which are located over both east and central Alabama. When a forecaster loops a series of satellite images, clouds move but the snow does not - that is how we know where the snow is located. The snow fell during the morning and afternoon hours of December 18th, 1996.
The purpose of this web page is to share with Gulf Coast Residents some of the latest tools that the NWS possesses in order to diagnose and predict the locations and amount of snowfall.
EVENT SNOWFALL
Assuming a 10:1 snow-liquid water equivalent, 3.4 inches of snow was observed at Bates Field (KMOB) in West Mobile, AL. Notice that between 124-233pm, 2 inches of snow fell with 1.7 inches of that falling between 156 and 233pm. At no other time was there sleet or rain mixed in with the snow once it began until just before all precipitation ended altogether.

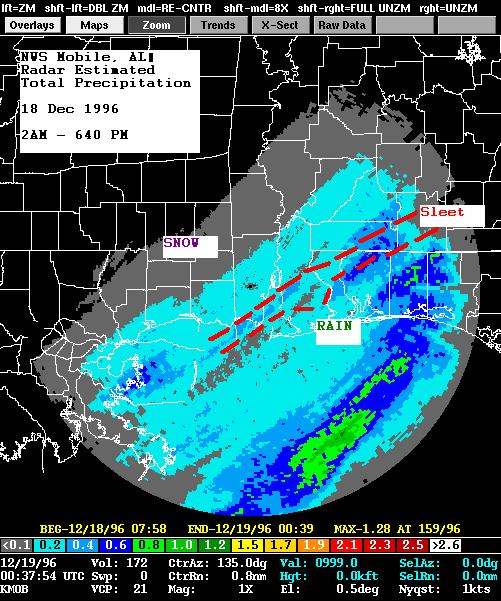
The three images below show radar accumulated precipitation estimates of how and where the snow fell over discrete time segments.
The leftmost image is the WSR-88D 3-hour precipitation product that estimates the total amount of precipitation (in inches) that fell between 9am and noon. Note the region in southwest Mobile County, AL where nearly 2 inches of snow fell in 3 hours. This area of heavy snow later moved over the Mobile Regional Airport (see time trend of snowfall at Bates Field in Mobile, AL).
The middle image is the same except for between noon and 3pm time period. The darker blue regions in the image indicate those areas that most likely received at least 2 inches of snow that day.
Finally, the far right image is the total amount of precipitation that fell between 2am and 6pm on December 18, 1996. Radar estimates of total liquid precipitation agree well with what was observed at the surface as far as actual snowfall amounts. The snow-liquid water ratio was an approximate 10:1 during this event. So, if you are interested in how much snow likely fell that day at a location near you, simply multiply what you see on the scale at the bottom of each image by 10. One exception is that once you go beyond about 75 miles from the radar in West Mobile, AL, the radar precipitation estimates are drastically underestimated. Also note the transition between snow and sleet, and sleet and rain in the image. Only the northwestern most corner of Escambia County Florida received snowfall that day. The rain-snow line is typical in these events, however, climatologically it is usually located much farther inland.
HOW DID THE SNOW OCCURThe snow event was rather unusual in the sense that surface low pressure development was very weak and far removed from the location of the coldest air. Although not shown, dating back to December 16th, 1996, the atmosphere grew colder with time over the region, as one surface cold front after another plunged southward into the region. Each front was successively colder and farther south than its' predecessor. Finally, on the day that snow began, a deep near sub-freezing layer of saturated air was in place from between 5000-12,000 feet. Once precipitation began to fall into the cold air below, the process of evaporation would eventually cool the lowest 5,000 feet of the atmosphere layer while becoming saturated.
As the precipitation intensity increased, the surface temperature in Mobile, AL fell from around 39°F just after sunrise to 32°F by noon. A strong piece of jet stream wind energy (seen in the VWP image below) enhanced the upward vertical motion locally along the evolving snowband which was already resident within an abundantly deep and saturated local airmass that was cold enough to produce snow.

Within the snow band, isolated cells were present which acted to greatly increased the observed snowfall intensity for those locations that experienced these. One neat thing that meteorologists can now do is slice the precipitation vertically. In other words, we can now explore the vertical dimension of storms, hurricanes, and yes, even snowbands!

The image below shows the individual intense cells along the snowband. These cells are slanted from South to North. When atmospheric moisture and stability conditions are just right, we term these features slantwise convection.

More Coastal Alabama and Mississippi Snowfall Amounts:
Site Amount (inches) Biloxi, MS 1 Vancleave, MS 1 Gulfport, MS 1 Leakesville, MS 1 Meridian, MS Trace Bay Springs, MS Trace Mobile Regional Airport (KMOB) 3.4 Bay Minette, AL 2.2 Robertsdale, AL 1.5 Atmore State Nursery, AL 2 Evergreen, AL 2 Camden, AL 2 Frisco City, AL 2.5 Highland Home, AL 2 Beatrice, AL 2.3
Pictures from the NWS Mobile Office during the December 18th snowfall (via Joe Maniscalco)


FUTURE EFFORTS
There are plans to continue research into the details of how the heavy snow band evolved. Emphasis will be placed in two primary areas. First a focus will be placed on examining the the characteristics of the snow band as it evolved. A second focus will be on learning how the synoptic scale forcing related to the development of the mesoscale heavy snow band.
Acknowledgements: Page initially created by Jeffrey Medlin (Meteorologist In Charge). Thanks to Brian Peters (previous Warning Coordination Meteorologist) of NWS Birmingham, AL who originally produced the snowfall graphic upon which later revisions were made. An additional thanks to Gary Beeler (retired Warning Coordination Meteorologist) and Joe Maniscalco (Forecaster) who also had a hand in obtaining local snowfall reports that made this study possible. Finally, thanks to NOAA\NWS Southern Region Scientific Services Division for providing the WSR-88D Level-II Radar Data necessary to generate the images. Page updated by Morgan Barry (Forecaster) and Joe Maniscalco (Forecaster).
LAST UPDATED: May 2017


 Follow us on YouTube