
| El Niño Conditions in the Tropical Pacific | ||||||||
| What are the effects of El Niño on Precipitation Across New Mexico? | ||||||||
|
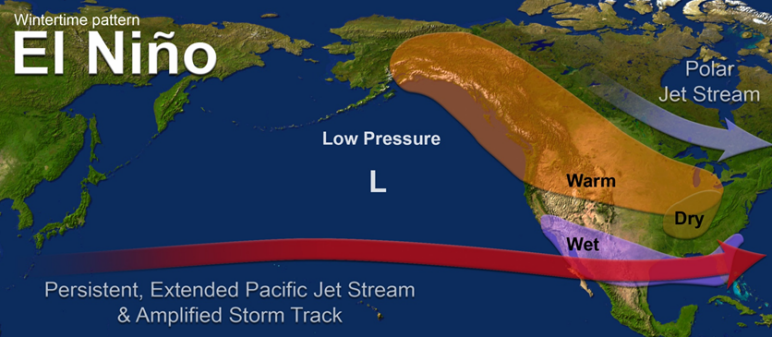
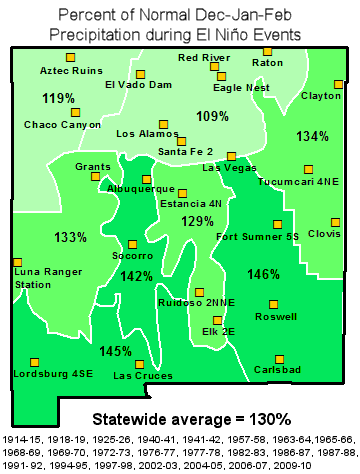
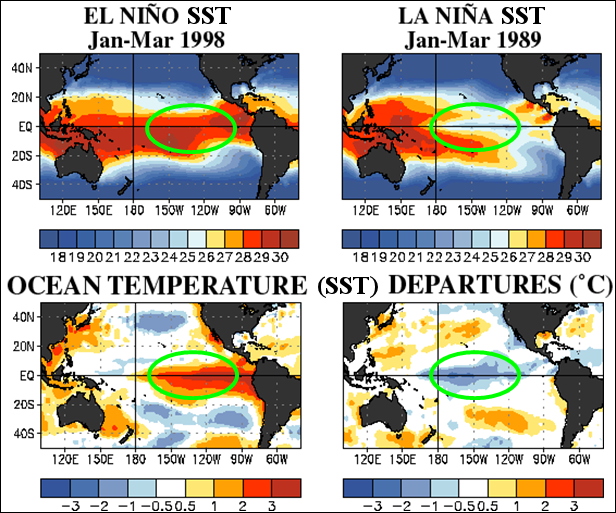
In a cycle of natural climate variability, ocean-atmospheric interactions result in sea surface temperatures (SST) that regularly fluctuate in the tropical Pacific Ocean. This example of interannual variability is referred to as ENSO, or El Niño Southern Oscillation, and was first noted as a cycle of warmer-than-normal and cooler-than-normal SSTs. Detailed information regarding ENSO can be found on NOAA's Climate Prediction Center (CPC) and Earth System Research Laboratory web sites. SSTs in the tropical Pacific vary dramatically, and in recent years cool conditions have dominated. The changes in SST in the tropical Pacific not only affect the distribution of precipitation near the equator, but also result in modified tropical atmospheric circulations that ultimately change the positions of the jet stream and storm tracks in the higher latitudes, including North America. Climate variability associated with the ENSO cycle has been observed at numerous locations across the globe for many years. In New Mexico, wetter than normal conditions are more likely during El Niño events with drier than normal conditions during La Niña events, particularly during the cool seasons of winter and spring. |
||||||||
|
||||||||
|
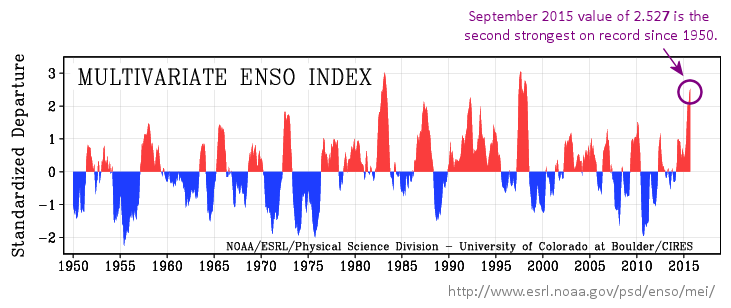
Research scientists have determined that the location and strength of the SST anomalies in the tropical Pacific can affect the pattern and strength of precipitation anomalies at higher latitudes. A number of indices are used to measure the ENSO cycle, as well as to define El Niño and La Niña events, including NOAA's ONI index (mentioned above) which monitors sea surface temperature anomalies in the tropical Pacific. Another index, the Multivariate ENSO Index*, or MEI, is shown below. The MEI index is derived using six atmospheric/oceanic parameters. In general, areas of the graph in red mark El Niño (warm) events, while blue areas represent La Niña (cold) events. Note the rapid developement of the ongoing (Fall 2015) event. |
||||||||
 |
||||||||
| * Information and references on the MEI can be found here . | ||||||||
|
|
||||||||
|
||||||||
|
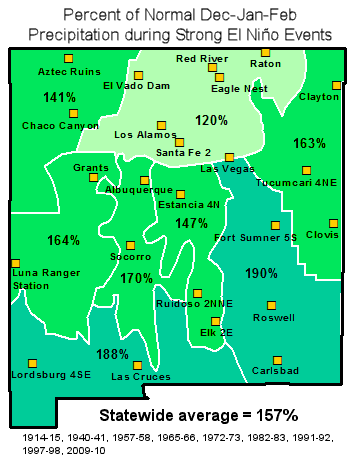
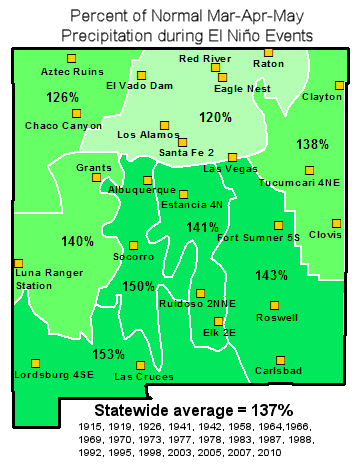
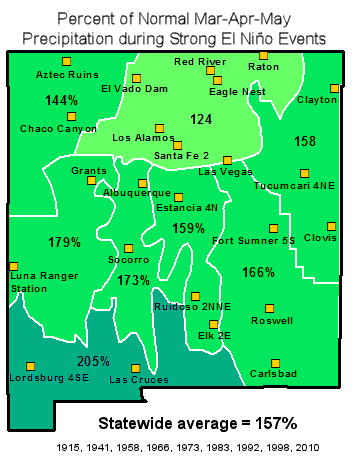
While odds favor a wet winter during an established El Niño event, a review of individual station statistics demonstrates how variable the precipitation can be from event to event. In the graphic below, winter precipitation values for 18 El Niño events are plotted with respect to the long term average at Ft. Sumner 5S. During all strong El Niño events (dark green bars), the winter precipitation was greater than the long term average. However, during five of the remaining El Niño events, precipitation was equal to or above the long term average. Note that the positive anomalies are generally greater following the PDO Regime shift. Similar statistics for all stations marked on the maps can be obtained by selecting any climate division on the winter maps (above) and spring maps (below). |
||||||||
|
|
||||||||
|
||||||||
|
It is important to note that there are other modes of climate variability that can have an effect on seasonal precipitation. While an El Niño will tilt the odds for a wet winter and Spring in New Mexico, it does not guarantee above average precipitation.
Three month outlook statistics are also downscaled for numerous sites across New Mexico, and are available on our local climate page or here. The Climate Prediction Center (CPC) routinely issues diagnostic discussions describing the current status of the El Niño Southern Oscillation (ENSO) cycle. Look for the "Expert Discussions/Assessments" on CPC's ENSO Page. |


 Follow us on YouTube