| 2016 Weather Highlights | Hydrology/Drought Status | Fire Weather | Records and Extremes | Monthly Highlights | Severe Weather |

|
2016 New Mexico Fire Weather Review
|
||||
|
Overview
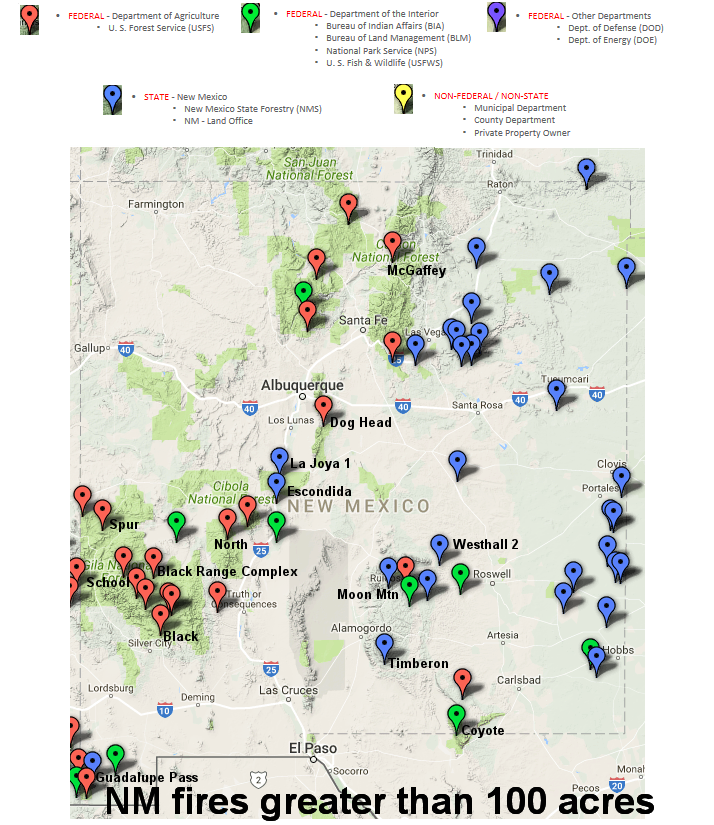
In many regards, 2016 was a near normal fire season for New Mexico. The total number of wildfire acreage and ignitions ended up just shy of normal. The number of emergency responder and land agency site specific (spot) forecast requests were also near normal. Red Flag Warnings are issued in New Mexico to highlight periods of strong wind, low humidity, an unstable atmosphere and dry fuel alignment. The number of Red Flag Warning days was also near normal. Large fires did impact the state (Figure 1). The Timberon fire started on July 13th and quickly raced through the town of Timberon, located 25 miles SE of Alamogordo, and destroyed 76 structures including homes. The Doghead fire started on June 14th and was located in the Manzano mountains or 25 miles southeast of Albuquerque. The fire destroyed 12 single residences and 44 minor structures. Several other large fires impacted the state but these fires were allowed to burn due to resource benefit purposes. The North fire, located in the San Mateo Mountains 25 miles south of Magdalena, started on May 31st due to lightning. It was 100 percent contained on July 21st and grew to a little over 42,000 acres. The pre-significant green up period of February and March was extra active with wildfire activity. Conditions were unusually dry due to the lack of precipitation events and there was abundant carryover grass from the previous year’s growing season. Several Red Flag Warnings were issued in March. Timely moisture intrusions affected the state during April and May and led to some green up which helped soften fire danger levels. Significant wind and low humidity periods generally preceded or followed some of the precipitation events and did allow for some wildfire activity. Fire danger peaked during the month of June which is normal for New Mexico but a secondary peak occurred in mid-July. Rare Red Flag Warning’s were issued for the 10th and 11th. The drier, early summer conditions, eventually abated due to higher humidity and increased wetting Monsoonal precipitation patterns. Active prescribed burning occurred during the late summer to fall period. October was especially dry and allowed burners to conduct several large landscape burns. November was exceptionally moist and prescribed burns became lower intensity pile burns versus the large landscape ones. Pile burns continued into December, especially the earlier half of the month. |
||||
|
|
||||
| Fig. 1. New Mexico Wildfires in 2016 (greater than 100 acres) | ||||
|
The charts below list the number of acres burned by all fire types across New Mexico and the total number of wildfires for each year since 2000. The average number of acres burned since 2000 is just over 316,000. Around 212,000 acres burned across the state in 2016. The average number of wildfire ignitions is 1520. A little over 1200 fire starts were reported in 2016. |
||||
 |
||||
| Statisics courtesy of Southwest Coordination Center (SWCC) | ||||
| Fig. 2 and 3. Number of acres burns by wildfires in New Mexico, and the number of fires in New Mexico, for the years 2000-2016. | ||||
|
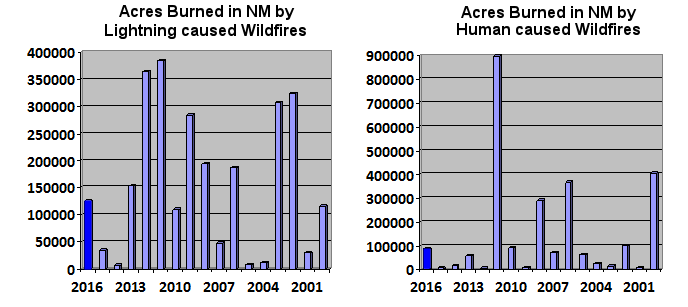
Below are the details of the annual number of acres burned by wildfires due to lightning (left) and humans (right) since 2000 are illustrated in figures 4 and 5 below. Acreage for human caused fires in 2016 was close to half the normal acreage of 152,000. The amount of lightning caused fire acreage in 2016 was a little closer to the average of 157,000. Managed or resource benefit fires are started from lightning. Land agency officials review several factors, including the latest and expected trends in fire danger, in order to efficiently manage a lightning caused wildfire. |
||||
 |
||||
| Statisics courtesy of Southwest Coordination Center (SWCC) | ||||
| Fig. 4 and 5. Number of acres burns by lightning ignited wildfires, and the number of human caused wildfires in New Mexico since 2000 | ||||
|
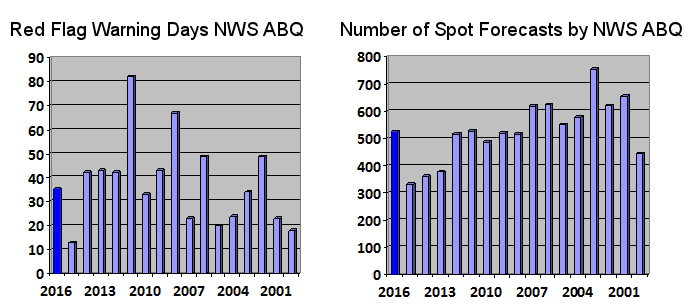
The National Weather Service (NWS) in Albuquerque issued Red Flag Warning’s for 35 separate days during 2016. That is 22 days greater compared to 2015. The average number of days since 2000 is 39. Warnings are issued to highlight the combination of weather and fuel dryness that promote critical fire behavior and growth conditions. A total of 525 site specific or spot forecast requests were made to NWS Albuquerque. The average number since 2000 is 530. Charts below show historical numbers of fire weather business for the area of northern and central New Mexico covered by NWS Albuquerque. |
||||
 |
||||
| Fig. 6 and 7. Number of days with a Red Flag Warning and the number of spot forecasts each year since 2000 | ||||
| (Return to the main page) | ||||


 Follow us on YouTube