National Weather Service United States Department of Commerce

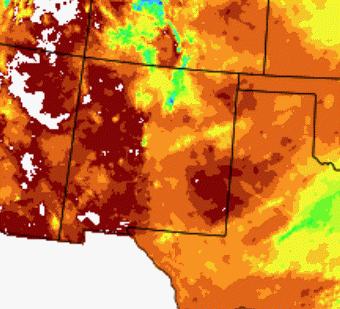
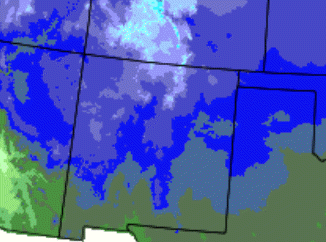
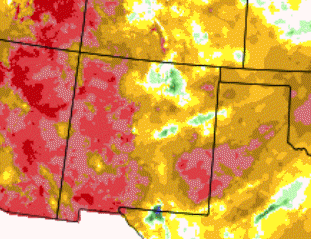
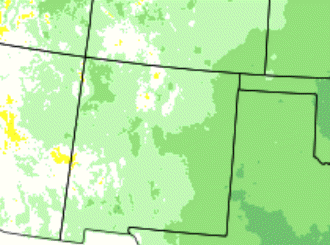
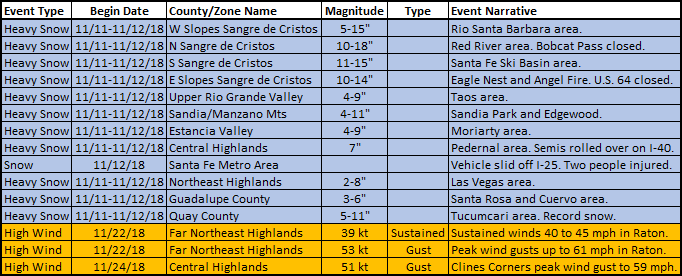
November 2018 was drier than normal across virtually all of the state, especially the southeast half. Temperatures were mostly below normal. 

The Halloween storm moved away from New Mexico at the start of November. It was fairly quiet through the first 10 days of the month. An impressive storm delivered snow and cold temperatures to northern and eastern NM on the 11th into the 12th. Over a foot of snow fell in the Sangre de Cristo Mountains and up to 10 inches fell around Tucumcari. The weather settled down again from the 13th through 28th, with only isolated high winds reported on the 22nd and 24th. The final day of the month turned more active with modest snow in the northern mountains and strong winds across the east on the 30th.


Statewide Precipitation and Temperatures

Statewide Precipitation - Actual

Statewide Temperatures - Actual


Statewide Precipitation - Percent Of Normal Statewide Temperatures - Departure From Normal


   Climate Cities Temperatures and Precipitation

Albuquerque
 

There was only a trace of precipitation measured at the Sunport in November 2018, compared to the normal of 0.57 inches. 

The average temperature for Albuquerque in November 2018 was 43.3°, which was 1.6 degrees below the normal of 44.9°. 

The average maximum temperature for the month was 55.4°. This was 0.4 degrees below the normal average maximum temperature of 55.8°.

The average minimum temperature for the month was 31.1°. This was 3.0 degrees below the normal average minimum temperature of 34.1 degrees.

There was a trace in November 2018, while normal is 1.0 inch. 32 other Novembers received a Trace of snow, while 15 reported no snow. 

Records:  12th: Record daily snowfall of a trace, which tied the previous high of a trace in 2000.

 
 Clayton
 

There was 0.11 inches of precipitation measured at Clayton in November 2018, or 0.34 inches below the average of 0.45 inches.

The average temperature for Clayton in November 2018 was 40.4°, which was 3.2 degrees below the normal of 43.6°. 

The average maximum temperature for the month was 54.3°. This was 2.9 degrees below the normal average maximum temperature of 57.2 degrees.

The average minimum temperature for the month was 26.5°. This was 3.5 degrees below the normal average minimum temperature of 30.0°.

There was 1.2 inches of snow at Clayton during November 2018, while normal is 3.0 inches.

Records: none

 
 Roswell
 

There was 0.01 inches of precipitation reported at Roswell during November of 2018. The normal is 0.58 inches, or 0.57 inches below normal..

The average temperature in Roswell for November 2018 was 47.3°, which is 2.0 degrees below the normal of 49.3 degrees.

The average maximum temperature for the month was 61.9°. This was 2.4 degrees below the average maximum temperature of 64.3 degrees.

The average minimum temperature for the month was 32.7°. This was 1.6 degrees below the normal average minimum temperature of 34.3°

There was no snow for the month, while normal is 1.3 inches. 43 Novembers have not reported any snow in Roswell. 

Records: none


Severe Weather
Storm reports are considered preliminary until a final review is certified in the NWS Storm Data publication.
Certified data is available three to four months post-event at: https://www.ncdc.noaa.gov/stormevents/