|
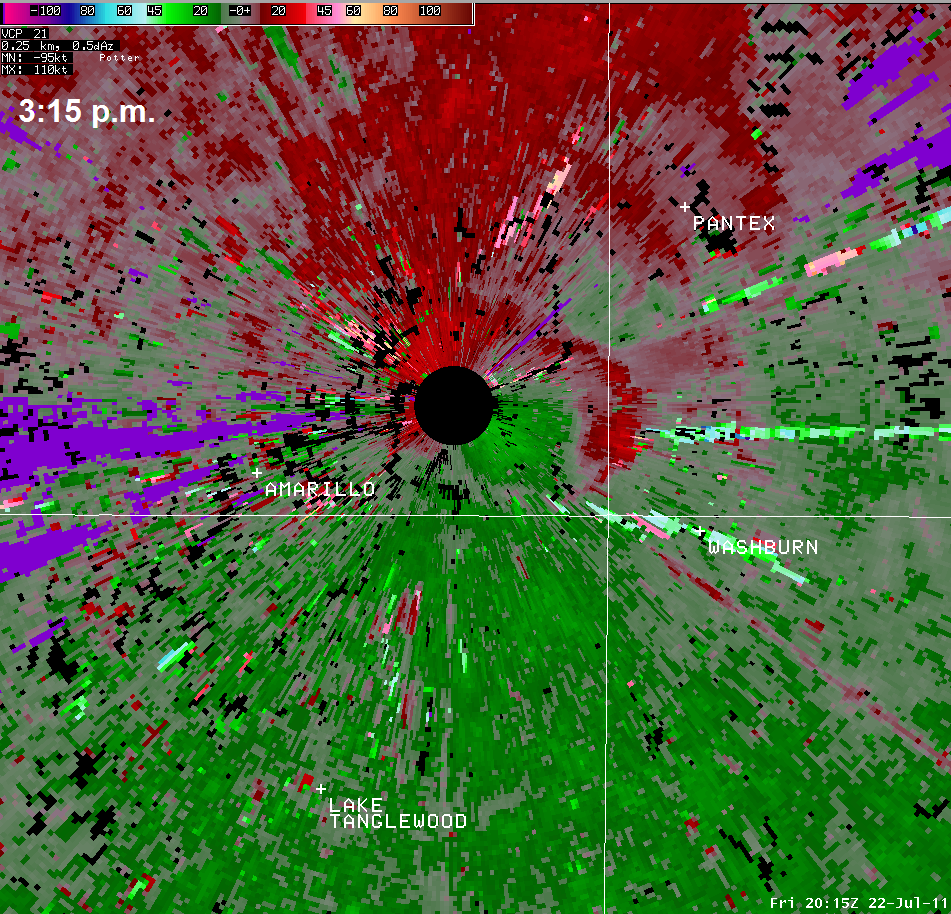
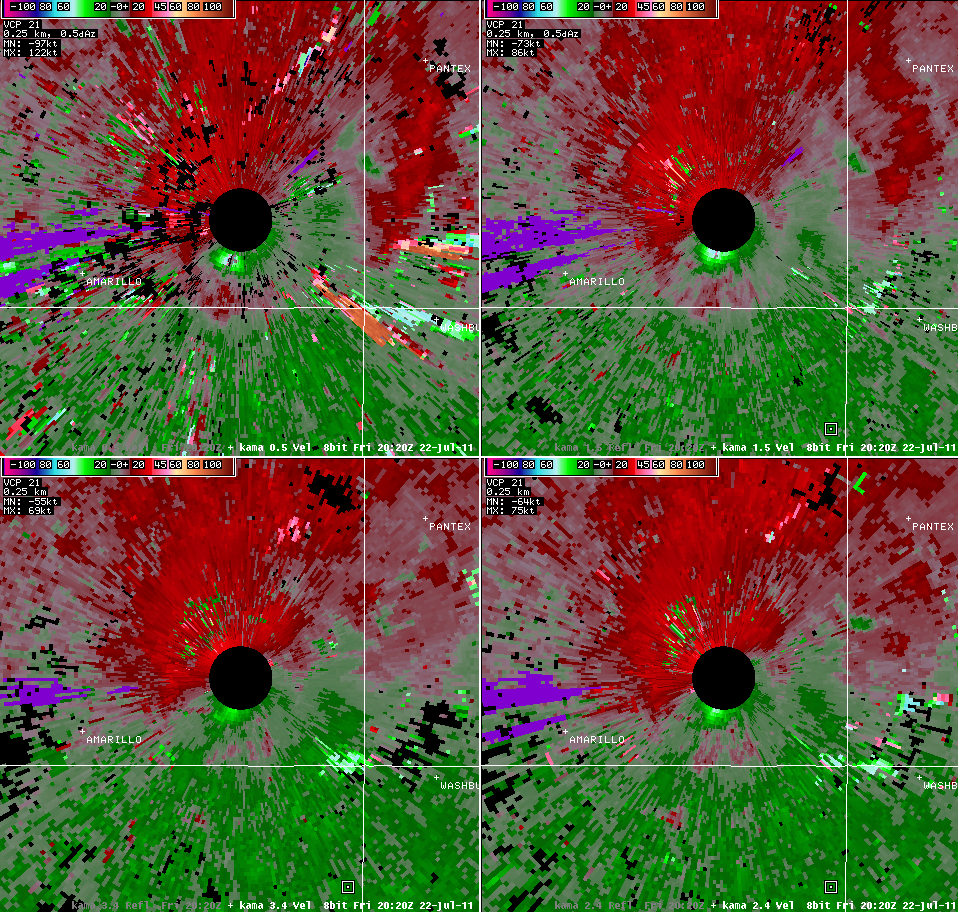
During the early to middle afternoon hours on July 22, isolated to scattered short-lived thunderstorms developed along and north of a diffuse outflow boundary that stretched from near Wayside to Canadian. One thunderstorm in particular rapidly intensified about 8 miles southeast of Amarillo around 3:00 p.m. and slowly moved north at about 10 mph. As quickly as the storm intensified, it also rapidly began to weaken as it approached Rick Husband International Airport. However, as it was weakening, a microburst associated with the storm resulted in a peak wind gust of 81 mph being recorded by the Automated Surface Observing System (ASOS) at 3:22 p.m. at Rick Husband International Airport. The 81 mph wind gust speed actually tied the all-time highest wind speed record at Amarillo set on April 19, 1973 and June 19, 2008.
Due to the storm's compact and short-lived nature, damage was concentrated in a small corridor near the airport. A National Weather Service damage survey found damage to hangar doors and two aircraft at Rick Husband International Airport. Additionally, a car's windshield was broken in a parking lot near the airport. There was also some damage along Highway 60 near the Lakeside Drive overpass where a billboard was damaged and metal sheeting was blown into a barbed wire fence. We would like to thank our airport partners that assisted with the damage survey.
|
|
A microburst is a downdraft (sinking air) in a thunderstorm that is less than 2.5 miles in scale. Some microbursts can pose a threat to life and property, but all microbursts pose a significant threat to aviation. Although microbursts are not as widely recognized as tornadoes, they can cause comparable, and in some cases, worse damage than some tornadoes produce. In fact, wind speeds as high as 150 mph are possible in extreme microburst cases.
There are a handful of factors that cause microbursts to develop, including mid-level dry air entrainment, cooling beneath the thunderstorm cloud base, sublimation (occurs when the cloud base is above the freezing level), and the existence of rain and/or hail within the thunderstorm (i.e. precipitation loading). Some microbursts are driven by a combination of these factors while others may only be driven by one factor. Due to this, microbursts can be subdivided into three primary types -- wet, dry, and hybrid. Cooling beneath the thunderstorm cloud base and sublimation are the primary forcing mechanisms with dry microbursts. Dry microbursts typically occur with very little precipitation at the surface or aloft, hence the dry type. Wet microbursts, on the other hand, are primarily driven by entrainment of mid-level dry air and precipitation loading. Hybrid microbursts possess characteristics of both wet and dry microbursts. They are forced in the mid-levels by dry air entrainment and/or precipitation loading and in the low-levels by cooling beneath the cloud base and/or sublimation.
It's possible that the microburst that produced the 81 mph wind gust at Amarillo was a hybrid microburst with an inclination toward the wet side. Before discussing the image below, we need to provide some background information first. The National Weather Service in Amarillo performs an upper air observation by releasing a radiosonde twice a day (currently 6 a.m. and 6 p.m.). These observations are vital for forecasters to assess how the vertical structure of the atmosphere changes with time. The data that are received by these radiosondes can be graphically plotted on a diagram called a Skew-T (Figure 1). Pressure lines are the horizontal lines and they decrease with height; the surface is the brown colored area at the bottom of the image. The bold red line on the Skew-T is the actual air temperature and the bold green line is the actual dew point temperature. As these lines move toward the left, values decrease, and as the lines move toward the right, values increase. It can be seen that as pressure decreases (height increases), the temperature generally decreases. The closer together the temperature and dew point lines are to each other, the greater the amount of saturation. When they are farther apart, it indicates less saturation. On the Skew-T below, the lines are far apart between the surface and roughly 8,000 feet above the surface, indicating this layer in the atmosphere is not very saturated (i.e. a dry layer). Between 8,000 feet and 15,000 feet, the lines are closer together, which implies a layer in the atmosphere that is more saturated (i.e. more moist). This layer is where clouds are most likely to form due to the greater saturation. Between 15,000 feet and 37,000 feet, the separation between the temperature and dew point substantially increases, which indicates a large layer of dry air.
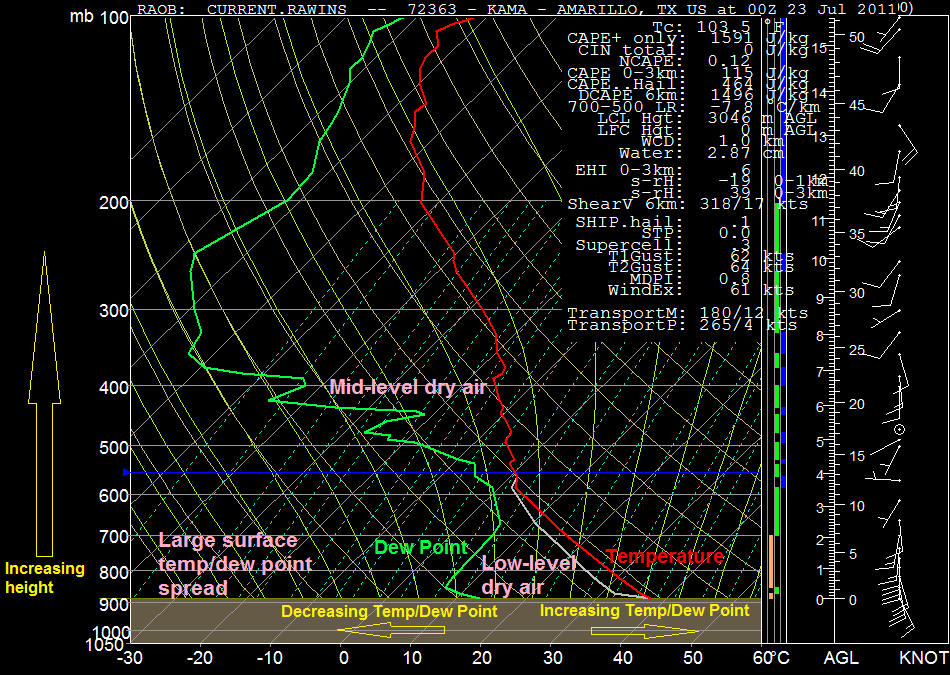
Figure 1. Amarillo Skew-T for the evening of July 22.
|
The Skew-T for Amarillo at 6 p.m. on the evening of July 22 (Figure 1) was modified for conditions just before the microburst occurred -- an air temperature of 100 F and a dew point temperature of 56 F. Modifying this Skew-T indicates a close match to a what a hybrid microburst Skew-T would look like. Abundant mid-level dry air was present, indicating the potential for this to be entrained into a thunderstorm. There was also a lot of dry air in the lower levels, indicating the potential for cooling below the cloud base. The cloud base was warmer than freezing, so sublimation should not have played a role in driving the microburst. The atmosphere was moderately unstable (characterized by a surface-based CAPE value of 1,591 J/kg), meaning that the air was more than buoyant enough for thunderstorms to develop. This also indicates that updrafts (rising air) within any thunderstorms could be strong enough to cause precipitation loading. Putting all of this information together indicates a high potential for microburst formation, regardless of whether dry, wet, or hybrid microbursts were most favored. Nonetheless, the driving forces for microburst production that were present likely favored hybrid microbursts. |


