A Comparison of High/Low Temperature Data for Two Locations in Southeast Tennessee and Southwest North Carolina
by
Hal Austin
1. Introduction
- Under the reorganization of the National Weather Service, the new forecast office of Knoxville/Tri-Cities Tennessee has been located in Morristown, approximately 40 miles northeast of Knoxville. This office has county warning authority and aviation responsibility for, and soon will issue public forecasts for, all of east Tennessee from the Cumberland Plateau eastward to the North Carolina state line, five counties in southwest Virginia and two counties in southwest North Carolina.
- Unlike most Southern Region offices, Morristown is surrounded by mountainous terrain. The highest elevation in this area is in the easternmost of the TN counties and extends into the adjacent counties in NC. There are numerous peaks in the area with elevations from 4,000 to 6,000 feet. Forecasting for mountainous terrain has always posed a challenge, involving meso- and micro-meteorological influences. The wide range in elevation makes it difficult to express forecasts of temperatures within a narrow range (approximately 50F) such as generally used in public products.
- To study this problem, data were compared from relatively close mountain and valley sites. The valley site is the Chattanooga National Weather Service Office at Lovell Field in Hamilton county with an elevation of 665 feet MSL. It is in the Great Tennessee Valley, between the Cumberland Plateau to the west and Great Smoky Mountains to the east. The elevated site is the Murphy co-op station is in central Cherokee county, in the southwest tip of North Carolina, 60 nautical miles due east of Chattanooga. The station elevation is 1800 feet MSL, 1135 feet higher than Chattanooga. It is surrounded by the Appalachian mountains.
- In anticipation of issuing official public forecasts from Morristown, forecasters have regularly prepared a practice zone forecast product for all of our counties. Our usual rule of thumb for forecasting high/low temperatures for the mountains of southeast Tennessee and southwest North Carolina (including Murphy) is to subtract about 50F from the forecast temperatures for Chattanooga. Using the dry adiabatic lapse rate (5.40F per 1,000 feet) and difference in station elevation, this method should be accurate. In a wet environment such as low clouds, fog or rain, however, the wet adiabatic lapse rate (which averages 3.30F per 1,000 feet) might work better. Sometimes, however, cold air pooling in valleys often occurs in the cool season, producing an inversion and resulting in higher mountain temperatures, so mountain/valley differences are affected by several factors and any simple scheme will fail on occasion.
2. Data and Analysis Method
- Daily records of high and low temperatures from June, 1994 through June, 1995 were examined for both sites. While hourly data area available at Chattanooga, high/low temperature and precipitation amounts from Murphy are available only twice a day, in the early morning and late afternoon. The temperature data at Chattanooga is was gathered using an HO-83 sensor, which keeps a constant track of highest/lowest temperatures. The Murphy site uses a max/min thermometer. This sensor difference should have little effect on the data comparison. On October 1, 1995, ASOS (Automated Surface Observing System) became the official temperature sensor at Chattanooga. It will be interesting to see how and if the temperature averages at Chattanooga change with this new technology.
- A linear regression was done using Quattro Pro with the high and low temperatures each month to detect a possible pattern. R is the correlation coefficient. This shows the strength of the correlation between the two groups of data. The range is -1 to 1, where 1 shows a perfect (positive) correlation.
- There are no Class A observation sites in the mountains of southwestern North Carolina and no specific forecast points. So the elevation for which the forecast is made is vague. A customary solution is to target the elevation near which most people live. This is roughly 3000 feet in the mountains, and is conveniently halfway between their peaks and the Tennessee Valley's elevation. Yet this is still just a compromise. However, it avoids the complication of multiple forecasts for different elevations, which would create an overburden of work and confuse the public.
3. Results
- The greatest difference between the two sites was noted with low temperatures. Station elevation, increased radiational cooling, cold air pooling, and drainage winds all contribute to generally lower temperatures in the elevated valley where Murphy is situated. Differences were smaller for high temperatures. This is likely because of increased vertical mixing and more uniform temperatures during the afternoon, when high temperatures are usually attained.
- Figures 1-4 show daily max/min temperatures for representative months for each season. Caution should be used in generalizing from these graphs, as interannual variability can be large. Nevertheless, some trends are seen, which may repeat themselves year after year.
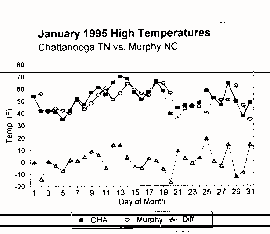
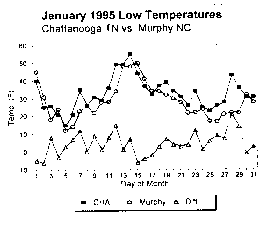
Figure 1
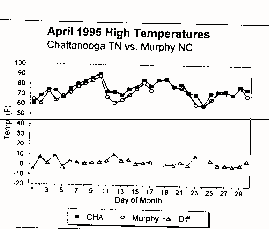
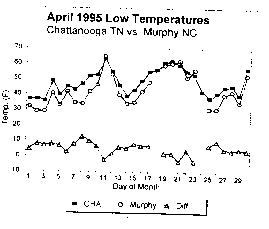
Figure 2
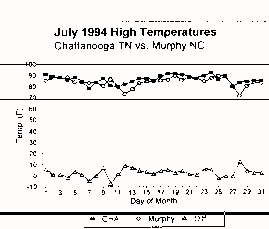
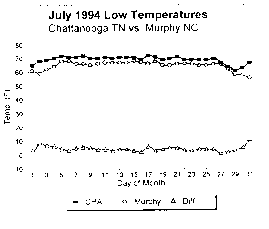
Figure 3
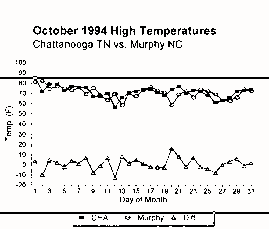
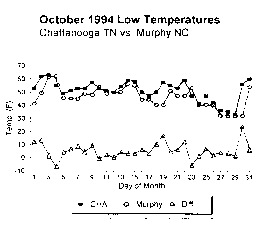
Figure 4
- Winds also play an important role. Chattanooga is located in a very broad valley while Murphy is surrounded by steep-walled mountains. On a cool, clear night, the effect of drainage winds will be much greater at Murphy. Doran and Whiteman (1993) used tower data to show that pressure-driven channeling dominated drainage as the major influence on winds in the eastern Tennessee Valley and Chattanooga. The corresponding effect of winds on temperatures cannot be understated.
- In almost all cases when daily max/min temperatures were compared between the two sites, the correlation coefficient was low, around 0.5 or less, indicating that there is usually no "magic number" one can subtract from Chattanooga's high/low to get a high/low temperature for Murphy. The exceptions were April through June 1995, when the value was quite high, 0.8 to 0.9. This was largely due to moist southerly flow and a well-mixed atmosphere, which occurred as the Bermuda high established itself in the late spring and summer and weather patterns became stagnant. This is a typical summertime airmass for the area, which yields small day-to-day and even week-to-week differences. In winter, the weather pattern across the southeast is much more active with frequent frontal passages, each bringing in a different airmass. Even though the average high/low difference for each winter month is not large, day-to-day differences often are. One day the difference in high temperature could be 30F, and a day or two later the difference could be 120F!
- Hiltbrand (1990) conducted a similar temperature study for Bristol, Tennessee and Mountain City, Tennessee. Bristol is near the northern end of the Tennessee Valley, 163 nm northeast of Chattanooga. Mountain City is 28 nm east and 1,000 feet higher than Bristol. This elevation difference is identical to that between Murphy and Chattanooga. Hiltbrand used 32 months of data. He calculated differences similar to those found in this study: about 2.50F for highs and 5.50F for lows. Unlike the present study however, variability was greater for highs than for lows. Other mountain/valley site pairs and/or different years should be examined to investigate this discrepancy and to depict other definite patterns.
4. Conclusions and Implications for Forecasters
- Simply subtracting 50F from Chattanooga's value to forecast temperatures for Murphy, without examining any other data, is not always a wise method. This should serve to warn forecasters not to compare monthly averages which smooth out differences, some quite large. It could lead to the use of a "magic number" when in fact one doesn't exist. Morristown keeps a daily record of highs and lows of all stations in the area, including Chattanooga and Murphy. The best method is to compare these highs and lows for the past several days at the two stations and take into account the synoptic situation. What may have caused the differences? If they have been large, one should assess their physical causes. Or, if the two stations have been close, one should be watchful for any upcoming factors that may cause a larger difference. Leffler and McGovern (1993) published a paper detailing how to make temperature adjustments using NWS and co-op station data for county-level temperature adjustments. This would be very helpful for all NWS offices, especially new spin-up NWSO's.
- Temperatures in complex terrain vary with several subsynoptic scale factors, which are extremely difficult to asses with a largely synoptic scale data network. Combined with the lack of a fixed forecast location within the mountain zone, missed or irrepresentative forecasts are bound to occur when 50F ranges are used. However, their occurrence can be minimized by monitoring differences closely and knowing the terrain well, which can illuminate smaller-scale factors. Also, a little review of recent trends, any forecast or guidance bias, and the synoptic picture can dramatically improve forecasts.
5. Acknowledgments
- Many thanks to Steve Hunter, SOO here at Morristown, for his proofreading skills and kind words of encouragement. I also want to thank my fellow forecaster Terry Getz for the initial idea for this paper.
6. References
- Doran, J. Christopher, and Whiteman, C. David, 1993: The relationship between overlying synoptic-scale flows and winds within a valley. Journal of Applied Meteorology, 32, Amer. Meteor. Soc., 1669-1682.
- Hiltbrand, R., 1990: Unpublished temperature study. WSO Tri-Cities Tennessee.
- Leffler, R.L., and W. E. McGovern, 1995: Use of National Weather Service cooperative station climatic data for the preparation of objective county-level temperature adjustments. Preprints, 14th Conference on Weather Analysis and Forecasting, Dallas, Amer. Meteor. Soc., 112-117.


