Excessive Rains Impact the Central Gulf Coast
June 2023
With the local area moving out of a triple dip La Niña to El Niño, a southward shift of a persistently active southern stream upper level flow over the Lower MS River Valley into the southeast US began to take hold. Most of the monthly rain fell during the middle of the month when the coastal plain saw a couple of surface fronts unusually far to the south for mid summer. These fronts along with other mesoscale boundaries provided a focus to concentrate lift along with anomalously high deep layer moisture and environmental instability. The net result was complexes of strong to severe storms moving repeatedly over the same areas causing rain amounts to swell in area rain gauges. The NWS Mobile's Automated Surface Observing Station (ASOS) at Pensacola International Airport saw just shy of 14" of rain collected for the month, with well over half of that falling in a one day span. On the 15th, storms deposited 9.30", setting a new daily record rainfall for the date. Even more astounding is the evening rain event on the 15th for the 6 hour period from 6pm to midnight measuring 9.23", aligns itself with one that typically occurs once in 50 to 100 years. It also turns out that this amount stands as the third wettest June day during Pensacola's climate period of record dating back to 1879.

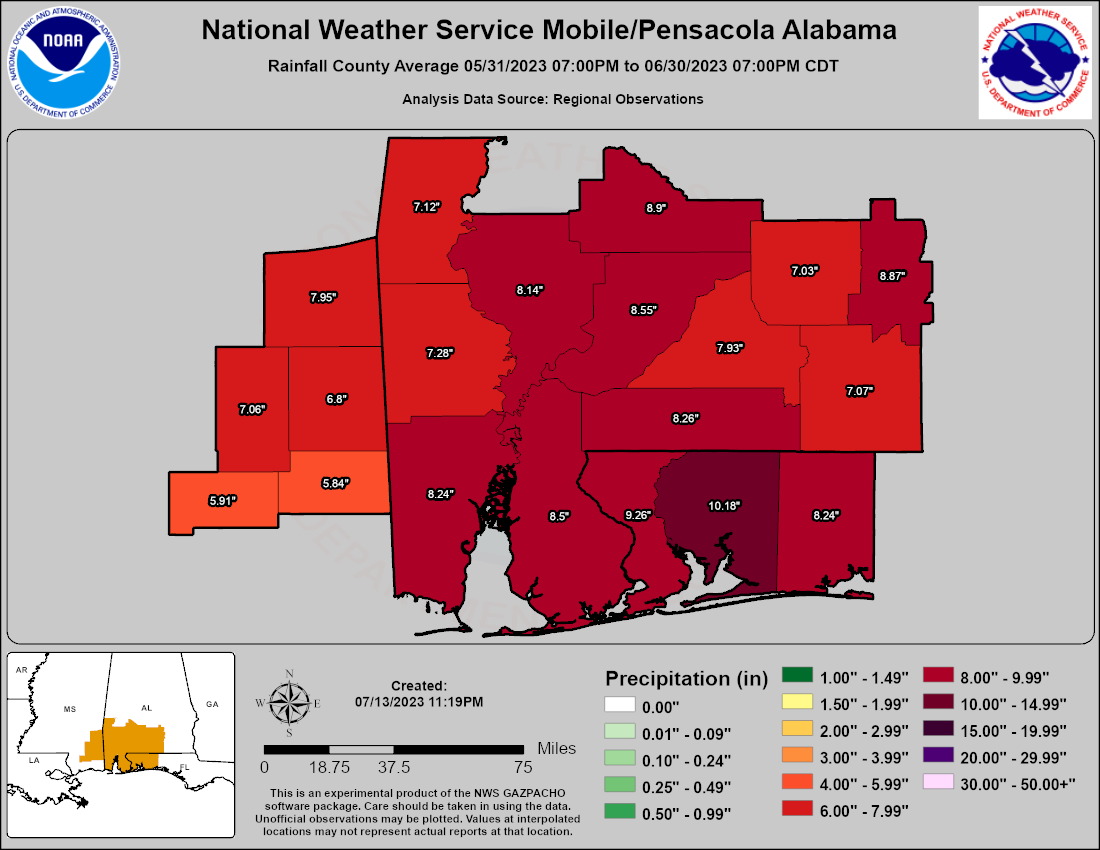
From an areal standpoint, some areas saw monthly rain amounts balloon to between 15 and 20". The map below shows a Graphical Information System (GIS) representation of the distribution of rainfall from over 190 rainfall reports received by the National Weather Service Mobile/Pensacola over the County Warning Area (CWA).
Note: The images below do not show all observations due to the density. For a comprehensive listing of the rainfall used to build the three images below, please see June 2023 Rainfall Observations.

Two additional graphics of the Areal Rainfall Distribution are provided in the tables below. Areal Rainfall Distribution without observations as a layer (Fig. 1) and County Averages (Fig. 2)

|
|
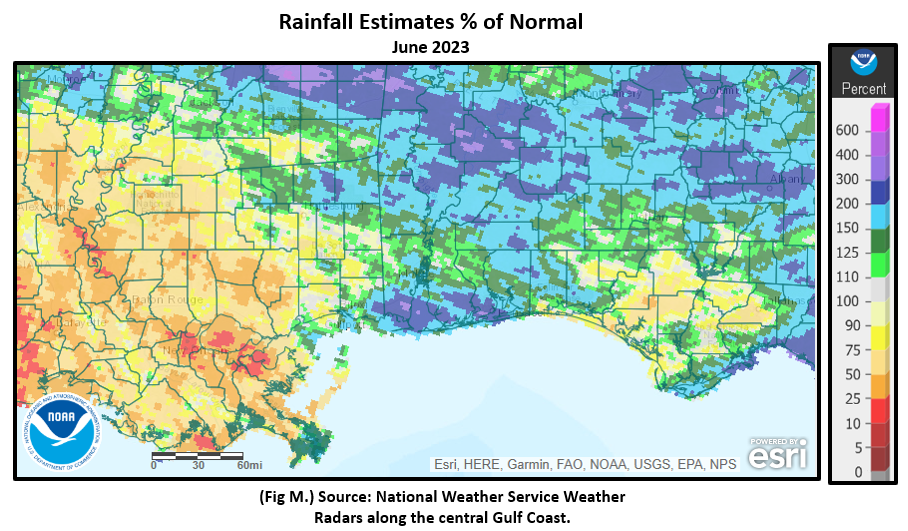
Many locales saw 150 to 300% of normal rainfall with pockets of an astounding 300 to 400% of normal rainfall being observed. The following images in figs. 3 and 4 show the monthly departures from normal and the the percent of normal rains respectively.

|
|
Acknowledgements: Page created by Joe Maniscalco (Observation Program Leader) with contributions from Brandon Black (Forecaster) who composed the GIS graphics, A huge thank you goes out to NWS COOP Observers, the many volunteer rainfall observers with the Community Collaborative Rain Hail and Snow Network (CoCoRaHS), USA CHILI - Mesonet, and citizens who share their data via personal weather stations.
LAST UPDATED: July 2023


 Follow us on YouTube