|
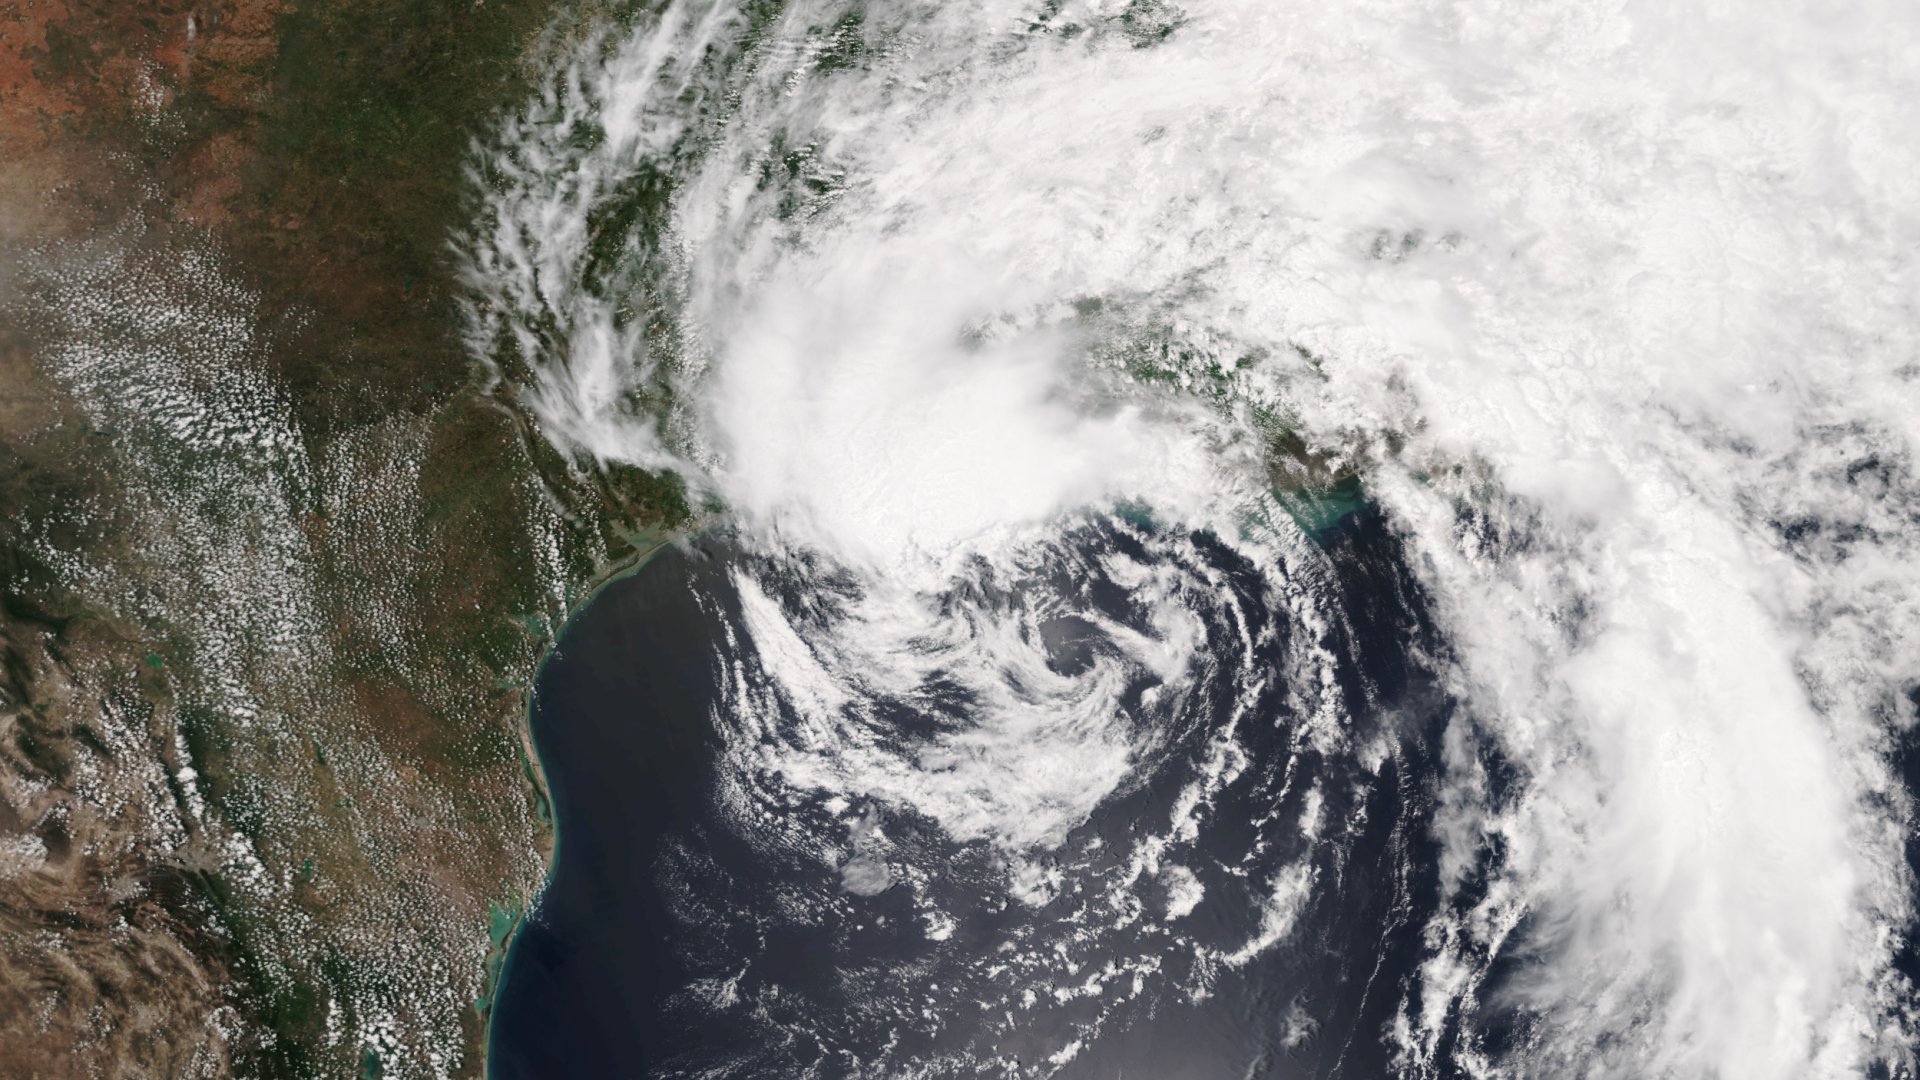
Above: MODIS Visible Satellite Image of Tropical Storm Cindy off the Louisiana coast 2:15 PM CDT June 21, 2017.
The genesis of Tropical Storm Cindy began as a broad tropical disturbance across the Western Caribbean Sea and the interaction with an upper-level trough on June 16th. For the next couple of days, the tropical disturbance moved generally northwest, eventually crossing the Yucatan Peninsula on June 18-19th. The disturbance emerged over the southern Gulf of Mexico early on June 19th. As a new policy this year to issue advisories on potential tropical cyclones within 48 hours of landfall, the National Hurricane Center began advisories on this system at 4 PM June 19th, with tropical storm watches and warnings issued from Southeast Texas and the entire Louisiana Coast.
By early afternoon of June 20th, the disturbance circulation consolidated enough, although still very large and broad, to be classified as a tropical storm, with the National Hurricane Center upgrading the system to Tropical Storm Cindy. Due to the upper level trough over Texas, persistent wind shear kept the system from strengthening much. Cindy’s circulation grew a bit more during the evening and overnight hours of June 20th-21st with maximum sustained winds reaching 50 knots (60 mph), mainly in various rain bands well away from the center.
The center of the broad circulation of Cindy made landfall around 2 A.M. CDT on June 22nd just east of Sabine Pass, or about 23 miles west of Cameron, Louisiana with maximum sustained winds of 50 mph (45 knots) and a minimum pressure of 991 millibars (29.26 inches).
After analyzing the Lake Charles, LA radar imagery and pressure graphs from Calcasieu Pass, LA, it was noted that the broad disorganized center had two gyres rotating around the center. This resulted in two pressure minimums at Calcasieu Pass, LA, one at 1:36 AM CDT at 993.8 millibars, and the second at 5:30 AM CDT at 993.1 millibars. This corresponded well with Lake Charles, LA radar reflectivity showing both these gyres as highlighted with increased convection associated with them. These gyres continued to rotate around the broad center of circulation as the entire system progressed northward for the remainder of June 22nd, paralleling the Louisiana/Texas border.
The biggest impact from Tropical Storm Cindy was minor to moderate storm surge flooding and inundation across Cameron, LA and further inland across Calcasieu parish eastward along the remainder of the Louisiana Coast.
In Cameron parish, tides reached 4.9 feet MLLW at the NOS Calcasieu Pass, LA gauge, resulting in water covering most of the roads and low lying areas in Cameron parish. Two to 3 feet of water above ground level was observed in downtown Cameron. One to two feet of water covered Highway 82 between the Cameron Ferry and Holly Beach. About 1 foot of water was observed on Highway 27 near Kelso Bayou Bridge near Hackberry. Two feet of water covered Highway 82 between Oak Grove and the Mermentau River, along with a small section of Grand Chenier, LA. No homes were flooded, but several hundred people evacuated worker trailers in lower Cameron Parish.
Further inland into Calcasieu parish, the combination of heavy rainfall and the storm surge helped back up the Calcasieu River and flooded low lying area in Lake Charles, Sulphur and Westlake, LA. Tides reached 4.64 MLLW at the NOS Calcasieu Lake, LA gauge in downtown Lake Charles, LA. Water came to the edge of I-10 between Sulphur and Lake Charles. Water of 1 to 3 feet deep was noted along the Lake Charles Beach and Yacht Club of downtown Lake Charles, and at least one foot deep along Contraband Bayou.
Vermilion parish, less than 500 people evacuated under voluntary evacuation recommendations across the coastal areas. Fortunately, no homes were flooded. Tides reached 6.38 MLLW at the NOS Freshwater Locks, LA gauge. The storm surge brought 1 to 3 feet of water above ground level at Freshwater City and Intracoastal City, LA, and about 1.5 feet above ground in Delcambre, LA.
Iberia parish, storm surge flooding was noted near the Port of Iberia, with several roads closed and equipment covered by water. Sections of Highway 83 was covered by water between Lydia and Alice B. Along the coast at Cypremort Point, LA, water of 2 to 3 feet above ground level was observed.
St. Mary parish, Tides reached around 5.1 feet MLLW at both the NOS gauges at Amerada Pass and Eugene Island, LA. Sections of Highway 317 going down to Burns Point had 1 to 2 feet of water covering it.
St. Martin parish, the combination of the coastal storm surge and ongoing flooding from the Atchafalaya River kept water levels high around Stephensville, LA.
Tidal maximums across the upper Texas coast ranged around 4.0 to 4.7 MLLW, which resulted in water briefly coming across Highway 87 between Sabine Pass and Port Arthur.
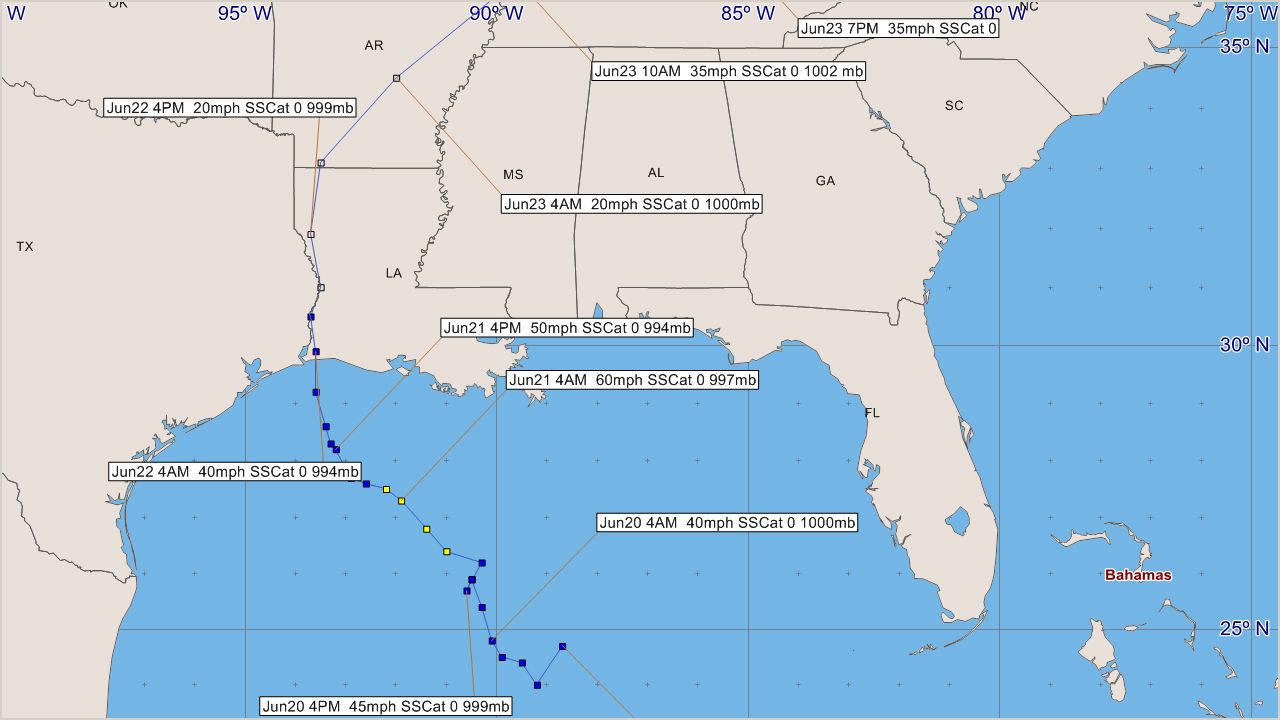
Above: Hurrevac track of Tropical Storm Cindy from operational National Hurricane Center public advisories.
Listed below are post-storm reports and meteorological data gathered. All data is considered preliminary, and is subject to change at any time. Additional information will continue to be added to this page in the future.
|


 Follow us on YouTube
.png)
.png)
.png)
.png)
.png)
.png)
.png)
.png)
.png)
.png)
.png)
.png)
.png)
.png)
.png)
.png)
.png)
.png)
.png)
.png)
.png)
.png)
.png)
.png)
.png)
.png)
.png)