|
Overview
That raw, damp, wet feeling that pervaded Deep South Texas during the now completed meteorological winter (December through February), requiring jackets, sweaters, and rain gear at the ready, has now been confirmed in a preliminary analysis of this season's data: The December, 2009/2010 winter was among the top ten wettest for most locations, and among the top 25 coolest. If not for a mid January thaw, where temperatures ranged some 8 to 12 degrees above average, the entire winter may well have ranked in the top ten coolest, as well.
Rainfall Capsule
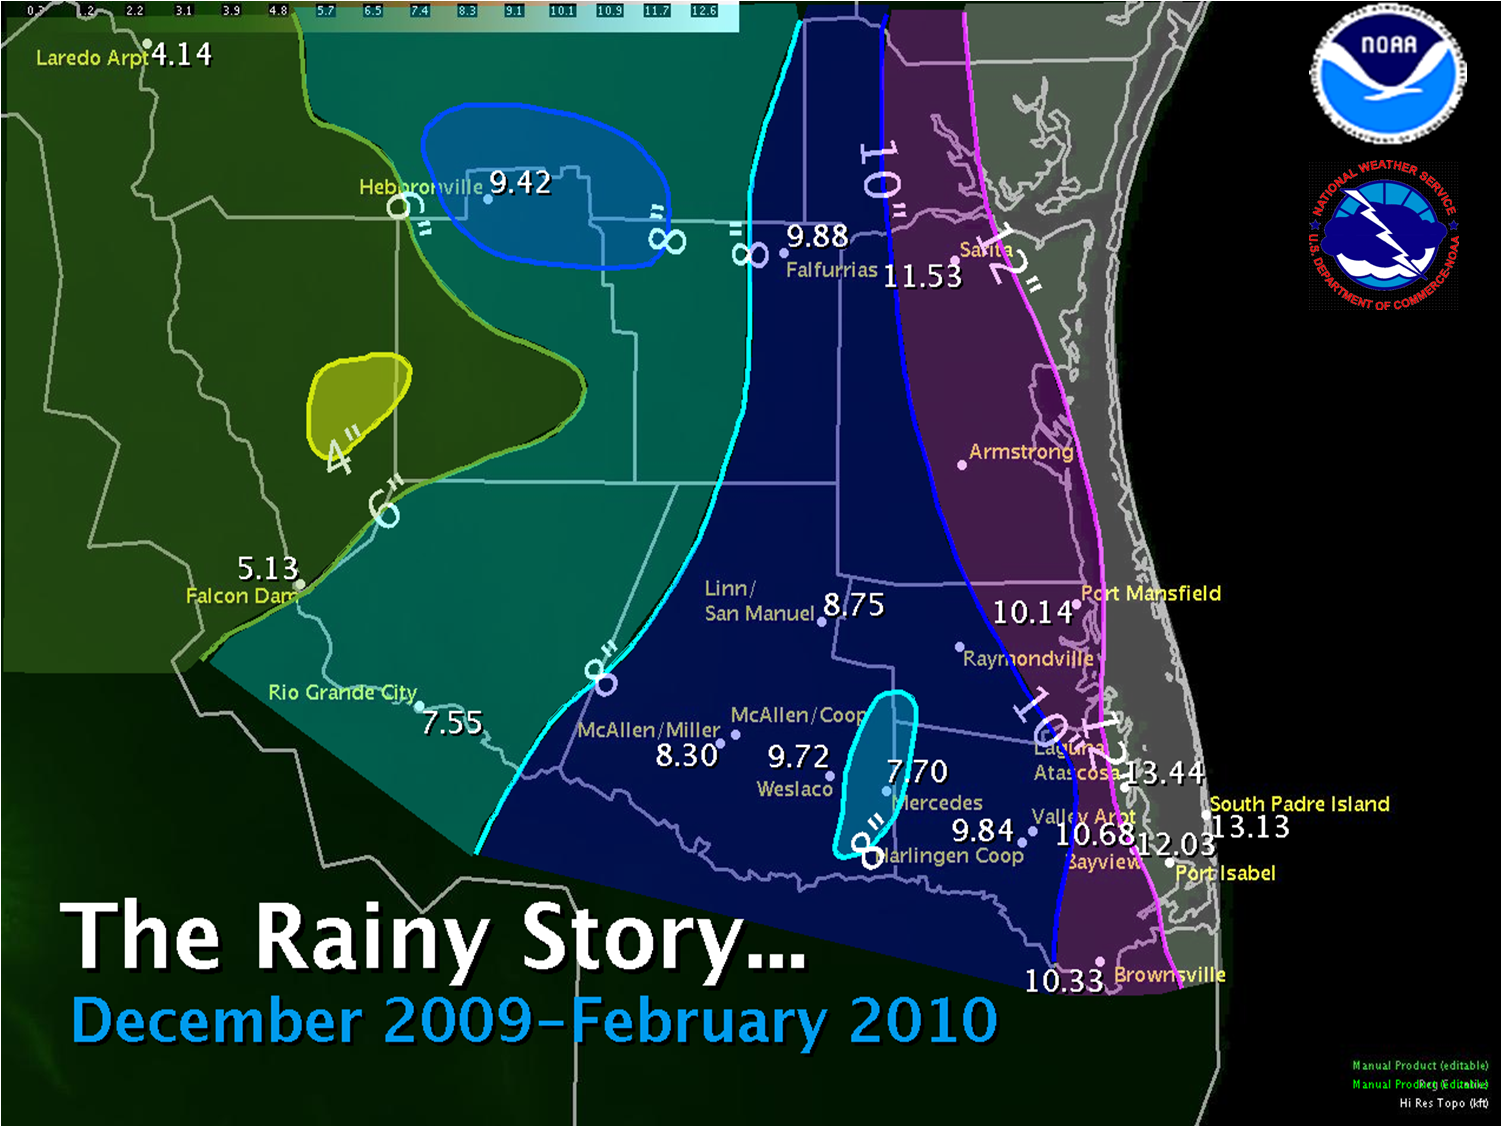
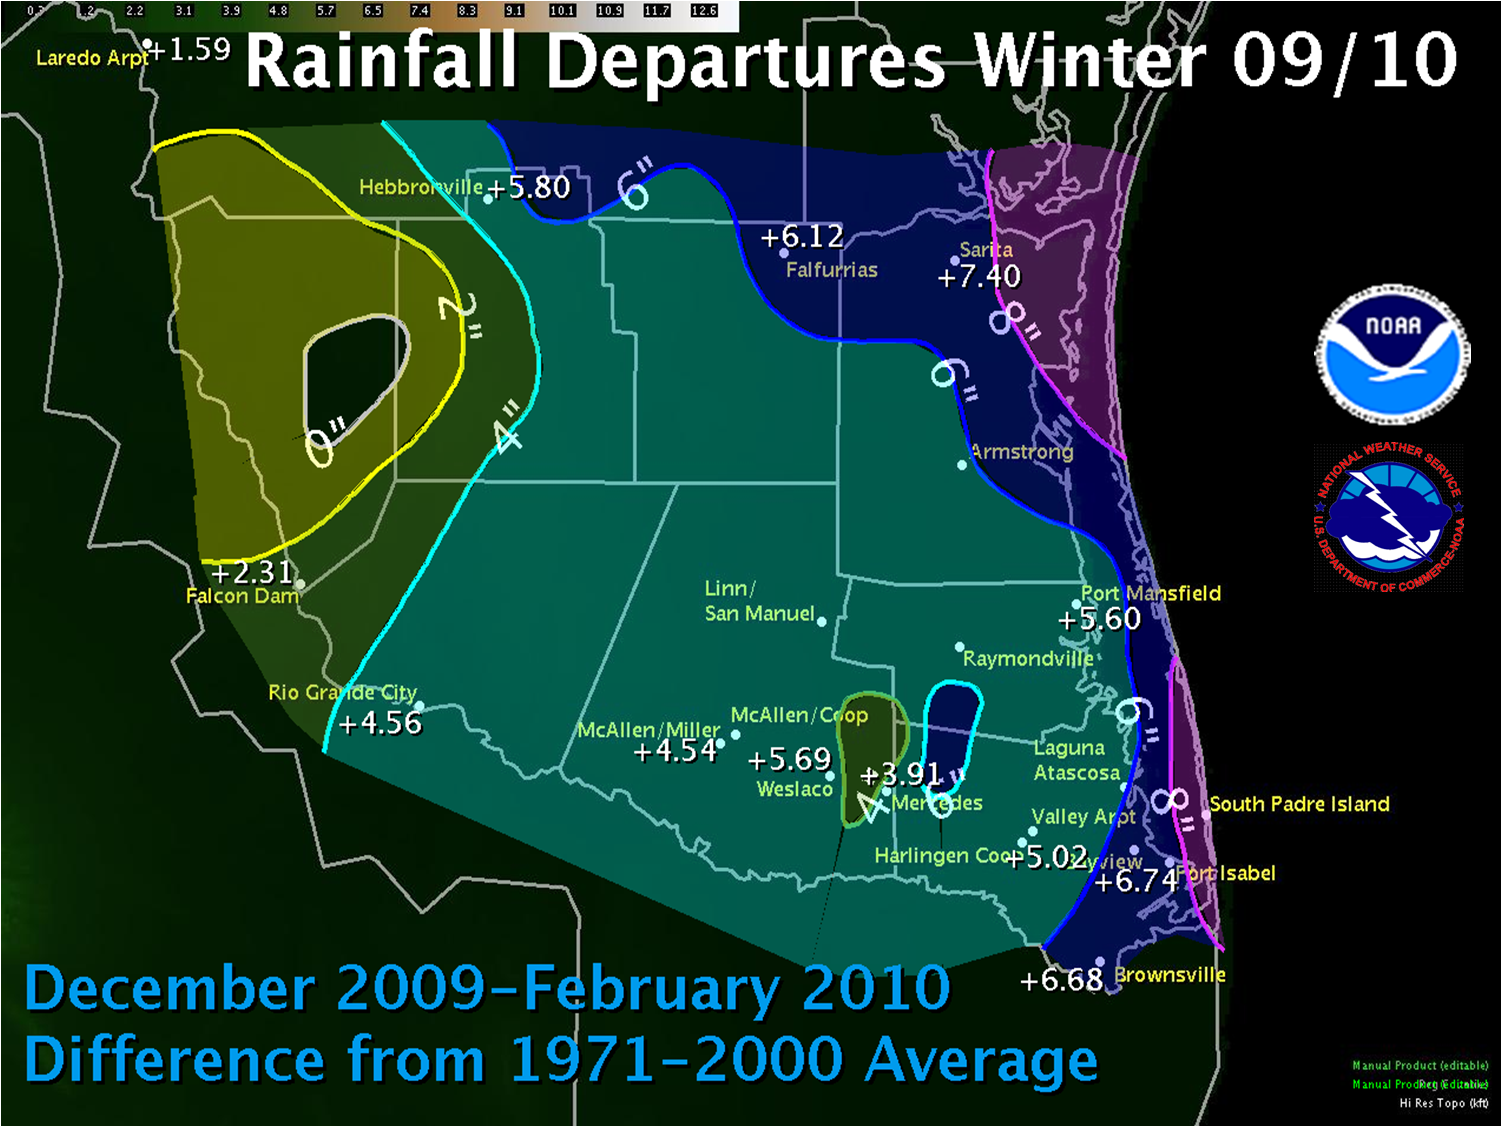
Some quick, preliminary statistics as of March 1st: For Brownsville, the seasonal rainfall of 10.33 inches (6.68 inches above the 1971–2000 average) ranked second wettest, all time, behind 1957’s huge 15.50 inches. Contrast that to this time in 2009, when the December to February rainfall was only 1.05 inches, or the 5th driest. A similar wet/dry contrast was noted at McAllen’s Miller Airport, where the Winter of 2009/10 had a whopping 8.30 inches of rain (4th wettest, 4.54 inches above the 1971–2000 average) compared with a paltry 0.75 inches (7th driest) in 2008/09. Other locations around the Rio Grande Valley and Deep South Texas showed the same tendencies.
Temperature Capsule
Including the January 18-28 ‘thaw’, the 2009/10 winter was a marked change from the much warmer winter of 2008/09. Unofficially, Brownsville’s 59.1°F average temperature ranked 25th coldest, a full 2°F below the 1971–2000 value (61.6°F) and the coldest since 1983/84. Contrast this with 2008/09, when the 65.3°F average, some 6°F above this past winter, rated a 9th place tie for warmest winter (records since 1878). For the Harlingen Cooperative site, the 57.39°F average fell 2.72°F shy of the 60.11°F 1971–2000 marker; in 2008/09, the same site’s 63.9°F value, more than 6.5°F higher than this past winter, ranked in the top 20 warmest (records since 1911). For McAllen/Miller, the 2009/10 average of 59.6°F fell 2.2° shy of the 1971–2000 marker, (61.8°F); ranking it 10th coolest since records began in 1960/61. Contrast this season with 2008/09, when the 65.8°F average, also a little more than 6°F higher, was a full 4°F above the marker and ranked 6th warmest, all time (since 1961).
Rainfall Table
The following are selected rainfall totals for December 2009–February 2010 across Deep South Texas.
Preliminary rainfall, winter 2009/2010
| Location |
County |
Rainfall |
|
Laguna Atascosa NWR
|
Cameron
|
13.31
|
|
South Padre Island Isla Blanca
|
Cameron
|
13.13
|
|
Port Isabel
|
Cameron
|
12.03
|
|
Rancho Viejo
|
Cameron
|
11.93
|
|
Sarita 7 E
|
Kenedy
|
11.53
|
|
San Benito 5.0 SSE
|
Cameron
|
10.85
|
|
Rio Hondo 9.4 NE
|
Cameron
|
10.82
|
|
Bayview/Cameron Co. Arpt
|
Cameron
|
10.68
|
|
Brownsville 4.1 E
|
Cameron
|
10.58
|
|
Brownsville 2.2 W
|
Cameron
|
10.51
|
|
Brownsville/SPI Intl Arpt
|
Cameron
|
10.33
|
|
Los Fresnos
|
Cameron
|
10.22
|
|
Port Mansfield
|
Willacy
|
10.14
|
|
Armstrong
|
Kenedy
|
10.00 (estimate)
|
|
Falfurrias
|
Brooks
|
9.88
|
|
McAllen 1.7 SSE
|
Hidalgo
|
9.85
|
|
Harlingen Cooperative
|
Cameron
|
9.84
|
|
Weslaco Cooperative
|
Hidalgo
|
9.72
|
|
Harlingen 2.6 ESE
|
Cameron
|
9.66
|
|
Hebbronville
|
Jim Hogg
|
9.42
|
|
McAllen 2.6 NE
|
Hidalgo
|
9.28
|
|
Pharr 5.1 N
|
Hidalgo
|
9.11
|
|
Alamo 1.5 NNE
|
Hidalgo
|
8.88
|
|
Linn/San Manuel NWR
|
Hidalgo
|
8.75
|
|
McAllen/Miller Arpt
|
Hidalgo
|
8.30
|
|
Mercedes
|
Hidalgo
|
7.70
|
|
Rio Grande City
|
Starr
|
7.55
|
|
Palm Valley 2.2 W
|
Cameronq
|
7.28
|
|
Falcon Lake
|
Starr
|
6.95
|
|
Harlingen/Valley Int'l Arpt
|
Cameron
|
6.26*
|
|
Falcon Dam
|
Zapata
|
5.13
|
*Rainfall may have been undermeasured.
Temperature Table
The following are selected Deep South Texas temperature averages, and departures, contrasting the winter of 2008/2009 (warmer than average) with the winter of 2009/10 (cooler than average), based on the 1971–2000 thirty–year averages.
Preliminary Temperature Assessment and Comparison
| Location |
County |
Winter 09/10 Average |
Winter 08/09 Average |
30 Year Average |
2009/10 Departure |
2008/09 Departure |
|
Weslaco 2 E
|
Hidalgo
|
57.28
|
64.1
|
61.7
|
-4.42
|
+2.4
|
|
Hebbronville
|
Jim Hogg
|
53.3
|
60.4
|
57.7
|
-4.4
|
unkn
|
|
Falfurrias
|
Brooks
|
53.61
|
60.0
|
57.67
|
-4.06
|
+2.33
|
|
Rio Grande City
|
Starr
|
55.55
|
62.1
|
58.79
|
-3.24
|
+3.31
|
|
Raymondville
|
Willacy
|
56.47
|
63.2
|
59.7
|
-3.23
|
+3.5
|
|
Harlingen/Valley Intl
|
Cameron
|
57.2
|
64.7
|
60.47
|
-3.2
|
+4.3
|
|
Port Isabel
|
Cameron
|
58.2
|
63.6
|
61.36
|
-3.16
|
+2.24
|
|
Falcon Dam
|
Zapata
|
56.0
|
62.4
|
58.75
|
-2.75
|
+3.65
|
|
Harlingen/Coop
|
Cameron
|
57.39
|
63.9
|
60.11
|
-2.72
|
+3.79
|
|
Port Mansfield
|
Willacy
|
56.04
|
62.4
|
58.65
|
-2.61
|
+3.85
|
|
Santa Rosa 3 WNW
|
Cameron
|
58.1*
|
64.2
|
60.4
|
-2.3
|
+4.2
|
|
McAllen/Miller
|
Hidalgo
|
59.6
|
65.8
|
61.8
|
-2.2
|
+4
|
|
Brownsville/SPI Intl
|
Cameron
|
59.1
|
65.3
|
61.1
|
-2
|
+4.2
|
|
McAllen/Coop
|
Hidalgo
|
58.66
|
64.3
|
60.36
|
-1.7
|
+3.97
|
|
Sarita 7 E
|
Kenedy
|
52.77
|
60.5
|
n/a
|
n/a
|
n/a
|
|
Bayview/Cam. Co arpt
|
Cameron
|
57.88
|
65.35
|
n/a
|
n/a
|
n/a
|
|
Mercedes
|
Hidalgo
|
57.38
|
63.1
|
n/a
|
n/a
|
n/a
|
* More than 10% of data are missing as of writing.
|
|
How It Happened, In Brief
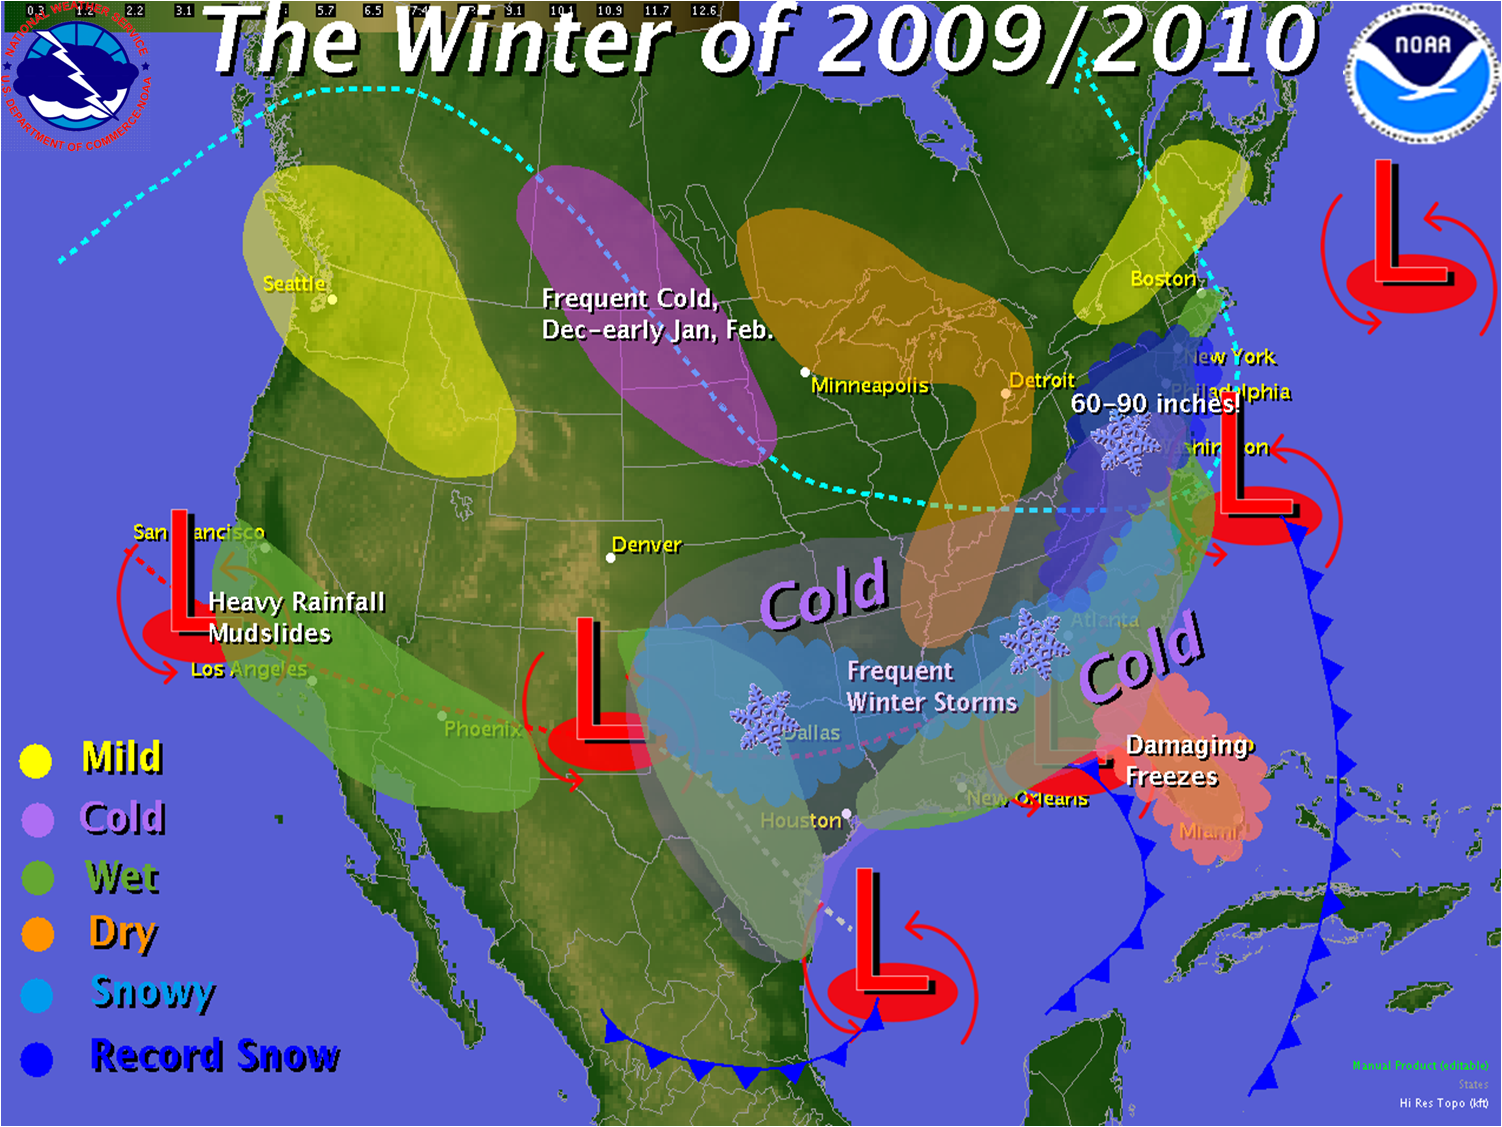
El Niño was generally expected to result in a great opportunity for above average winter rainfall when we wrote about it late last summer; indeed, the experts’ forecast for a moderate bordering on high El Niño/Southern Oscillation Index played out almost perfectly. As autumn slid into winter, the increased subtropical jet stream developed almost on cue, and the rains began as November turned to December. The chill felt in Deep South Texas was likely from a combination of the increased cloud cover along with a persistent negative Arctic Oscillation teleconnection, which aided the import of colder air behind developing storm systems moving from the northern Gulf through the Mid Atlantic region. El Niño looks to be holding on as we move into early spring. For more on the possible evolution of Deep South Texas weather conditions as we move through March and April, click here.
|

